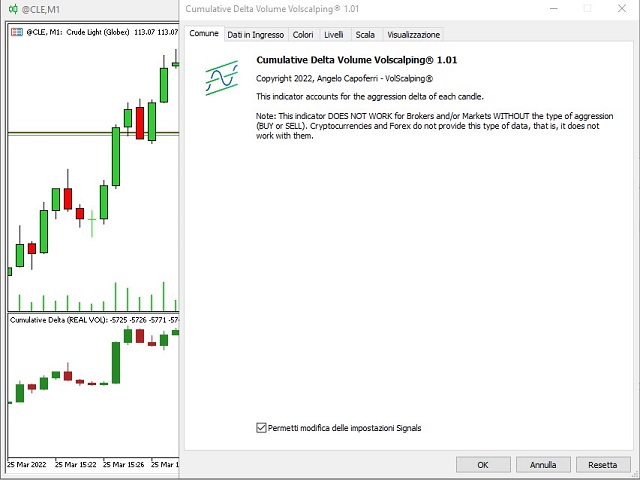
Delta Cumulative Volume
- 지표
- 버전: 1.1
- 활성화: 5
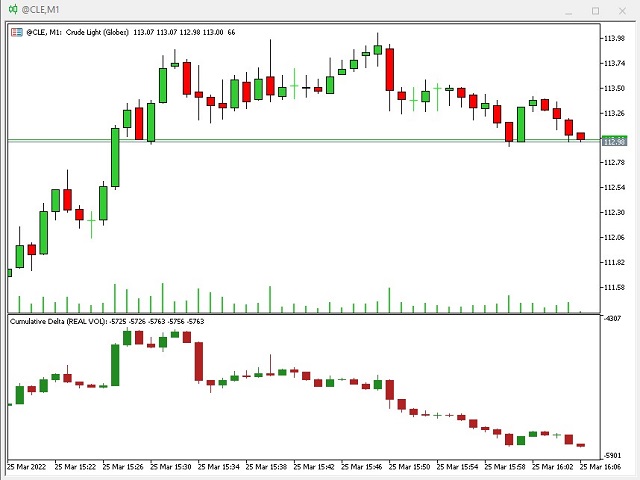
이 지표는 단일 캔들에 대해 매도 및 매도(공격) 체결된 계약 간의 차이를 감지합니다.
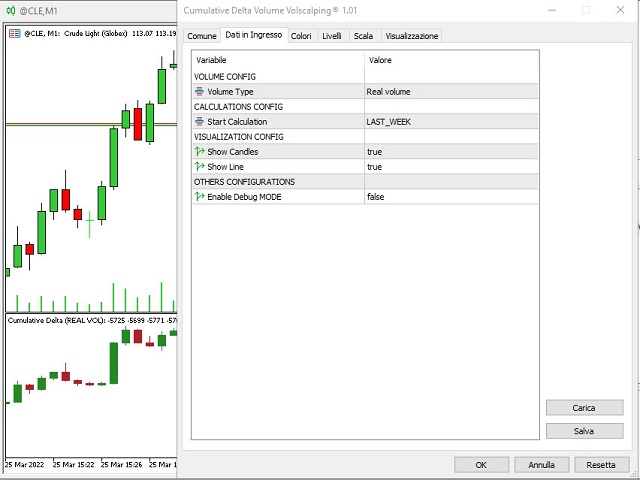
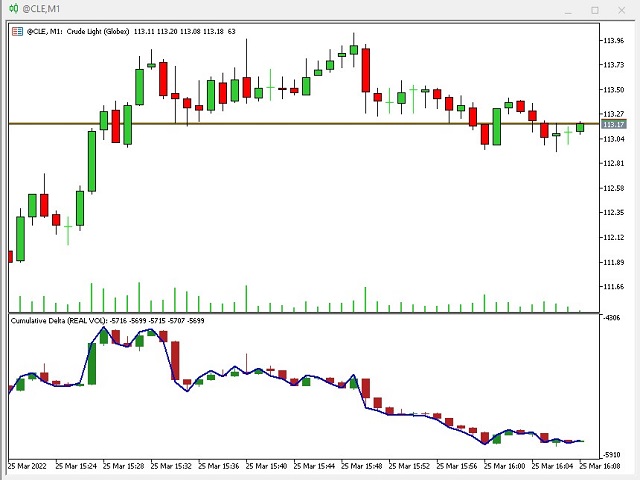
지표는 가격 차트 아래의 전용 창에 판매 및 구매 계약의 차이에 의해 정확하게 주어진 양초를 표시하며, 이는 시장의 체적 강도를 생성합니다.
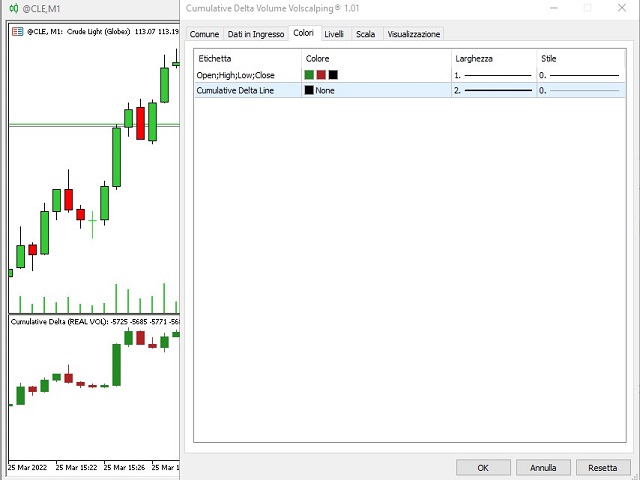
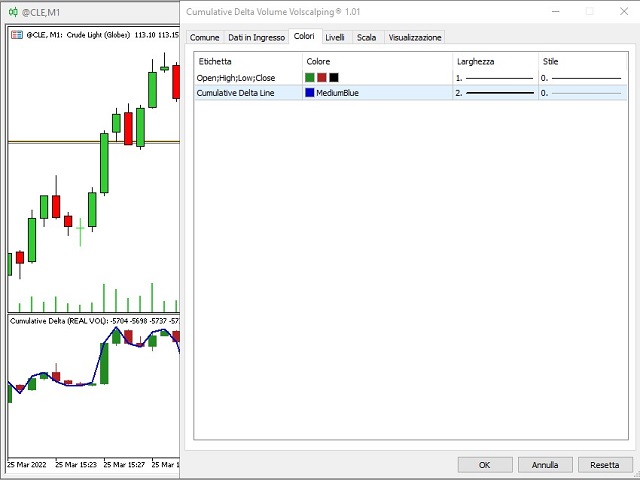
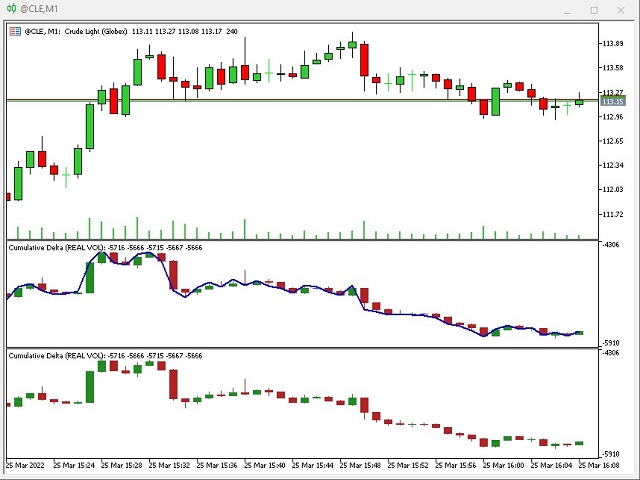
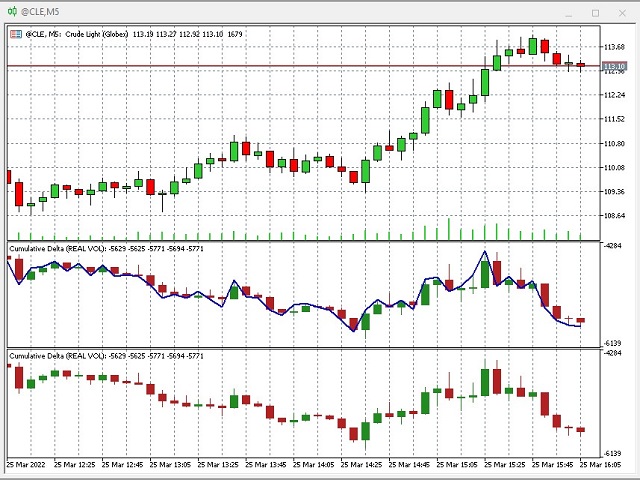
누적 촛대 델타 차트만 선택하는 방법 또는 양초 자체의 추세선을 선택하는 방법이 가능합니다(스크린샷 참조): 두 번째 상자 u "없음"을 선택하면 추세선이 그려지지 않고 색상을 선택하면, 체적 양초의 추세선이 차트에 함께 나타납니다.
이 표시기는 무엇을 위한 것입니까? 가격 차트를 체적 델타 차트와 비교하면 시장의 진정한 강점을 볼 수 있습니다. 두 차트의 수렴은 가격의 올바른 상승/하강을 결정하는 반면 가격과 체적 델타 간의 발산은 신호 경고여야 합니다 가격이 반전되어야 하기 때문입니다. 이 지표는 잘못된 신호를 필터링하고 가격과 거래량 사이의 분기 단계에서 발생하는 신호를 제거하기 위해 거래 전략과 함께 사용해야 합니다.
주의: 이 표시기는 실제 시장의 데이터 흐름을 제공하고 판매/구매 계약(BID/ASK)을 나누는 브로커에서만 작동합니다. CFD, FOREX 및 CRYPTOCURRENCIES는 합성 시장에 속하며 실제 데이터 흐름이 없으므로 표시기가 이러한 도구에서 작동하지 않습니다.
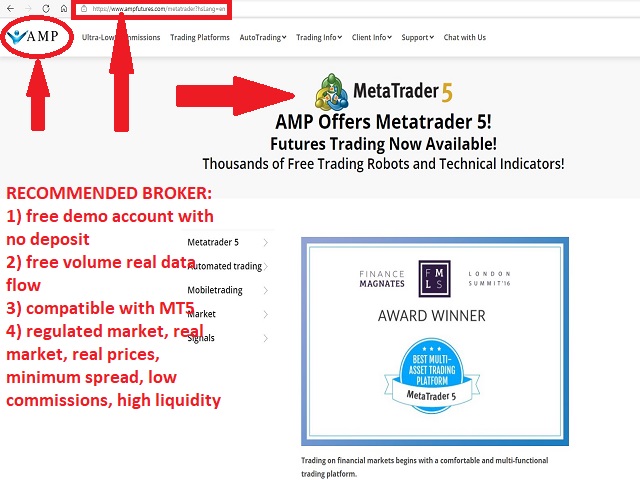
표시기가 작동하는 실제 데이터 흐름과 보증금 없이 무료 데모 계정을 제공하는 브로커는 AMP FUTURE입니다.