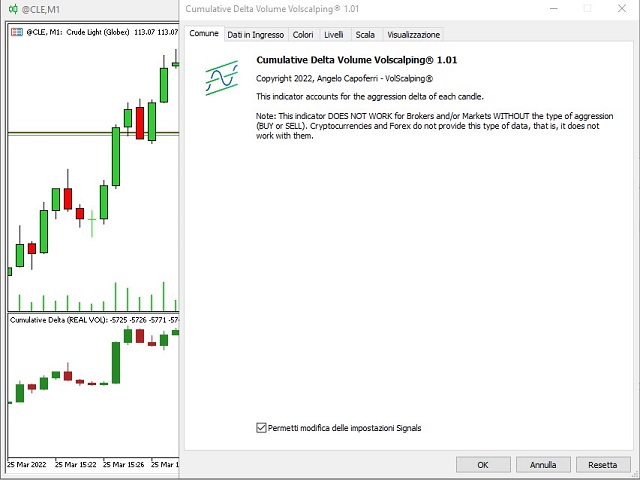
Delta Cumulative Volume
- Indicatori
- Versione: 1.1
- Attivazioni: 5
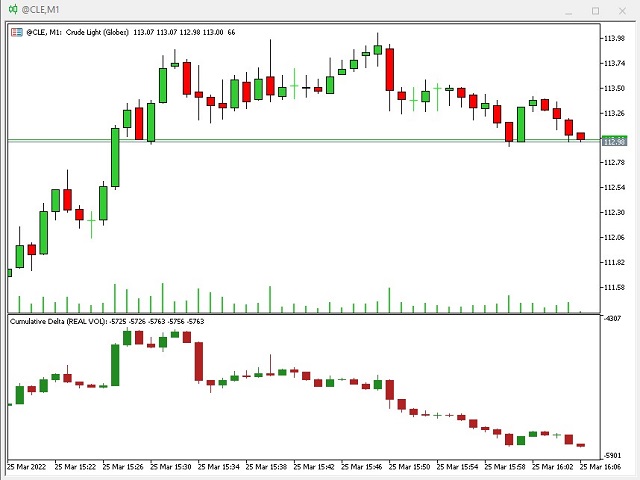
questo indicatore rileva la differenza tra i contratti battuti in bid e in ask (aggression) per ogni singola candela.
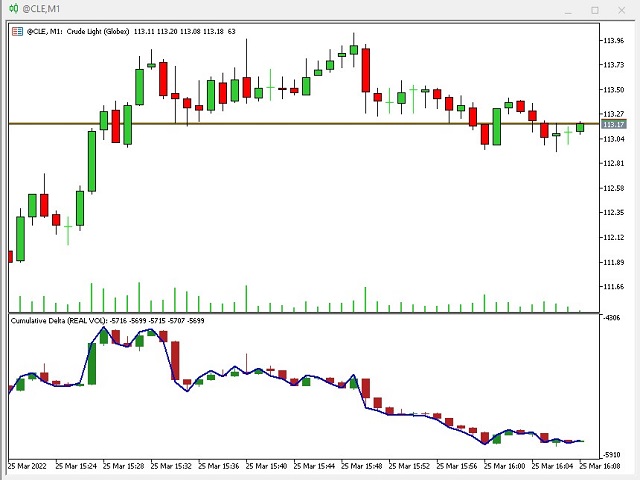
l'indicatore mostra nella finetra dedicata sotto al grafico dei prezzi, delle candele date appunto dalla differenza tra i contratti venduti ed acquistati, che generano appunto la forza volumetrica del mercato.
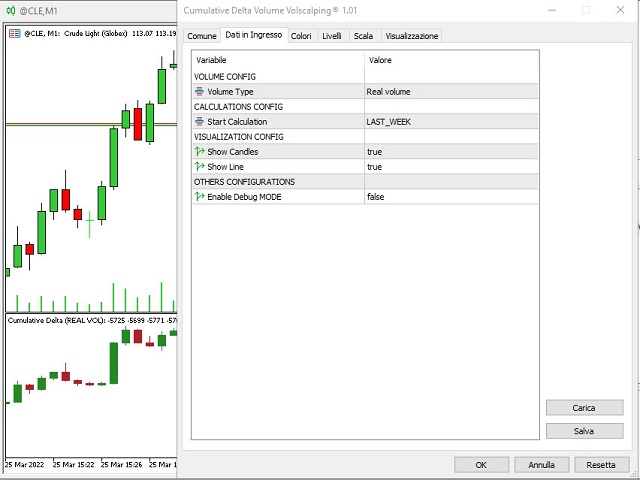
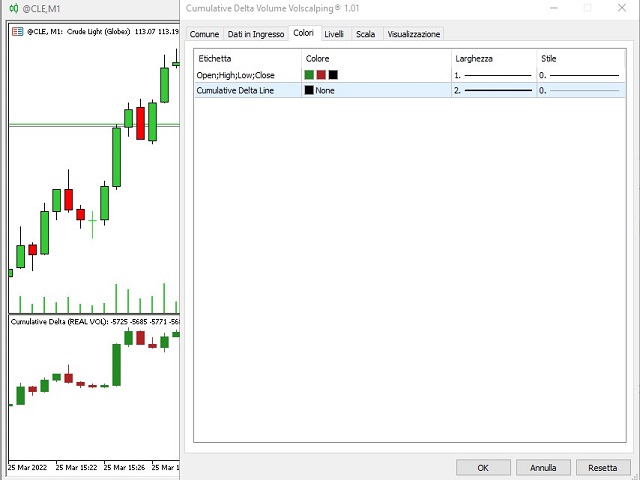
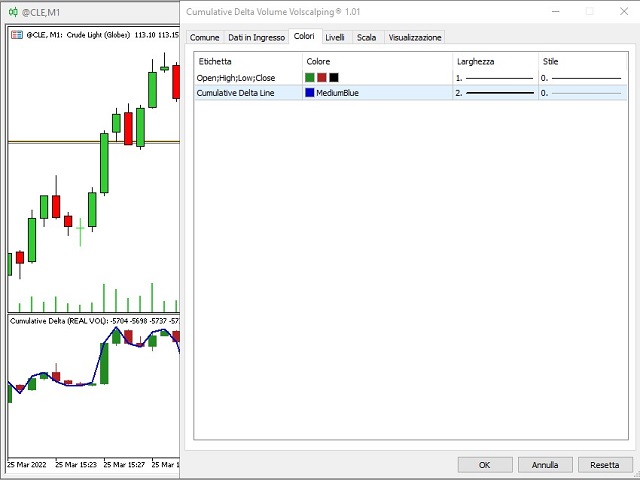
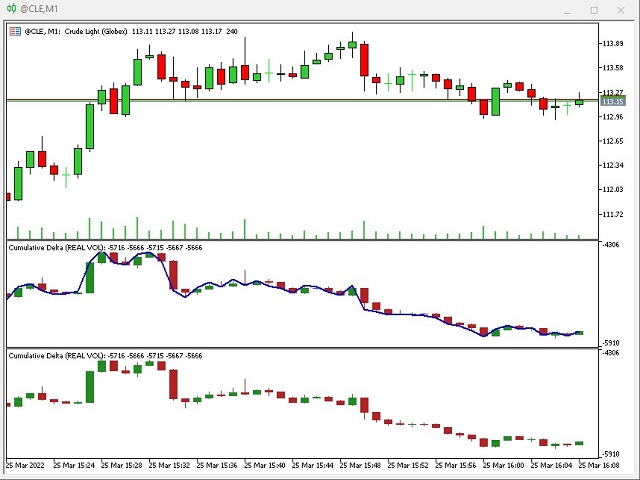
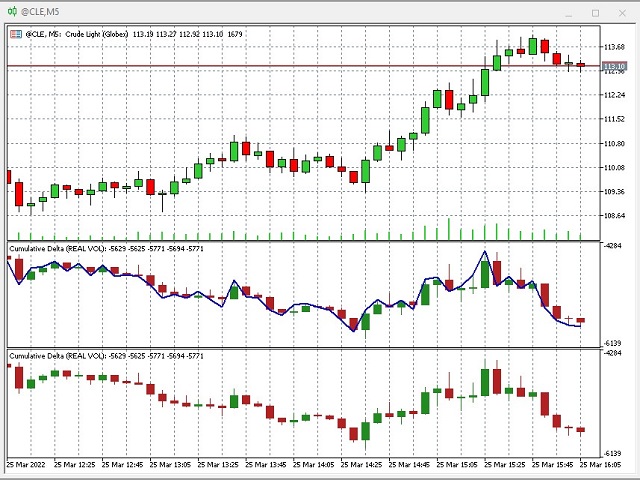
è possibile (vedere dagli screenshot) come selezionare solo il grafico delta cumulativo a candele, oppure anche ccon una trendline delle candele stesse: selezionando la seconda casella u "NONE" nessuna trendline verrà disegnata, mentre selezionando un colore, la trendline delle candele volumetriche apparirà sul grafico insieme alle stesse.
A COSA SERVE QUESTO INDICATORE? confrontando il grafico dei prezzi con il grafico del delta volumetrico, si può notare la reale forza del mercato, la convergenza dei due grafici determinerà una corretta salita/discesa dei prezzi, mentre una divergenza tra i prezzi e il delta volumetrico, deve essere un segnale di allerta per il trader, perchè il prezzo dovrebbe invertire. questo indicatore deve essere utilizzto insieme ad una strategia di trading, per filtrare i falsi segnali, eliminando quelli che si presentano in fase di divergenza tra il prezzo ed il volume.
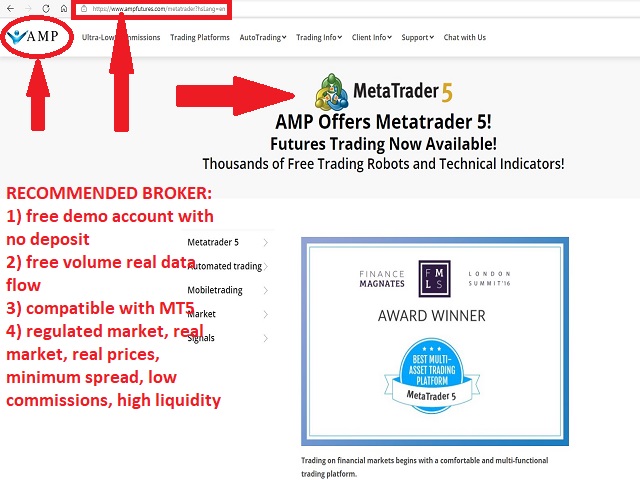
ATTENZIONE: l'indicatore funziona SOLO con broker che offrono il flusso dati del mercato reale, e che dividono i contratti venduti/acquistati (BID/ASK). CFD, FOREX E CRYPTOCURRENCIES apaprtengono al mercato sintetico, non dispongono di un flusso dati reale e pertanto l'indicatore con questi strumenti NON FUNZIONA-
un broker che offre il conto demo gratuito senza deposito e con flusso dati reale, su cui l'indicatore funziona, è AMP FUTURE.