
Ticks RSI
- Indicadores
- Versión: 1.12
- Actualizado: 18 noviembre 2021
- Activaciones: 5

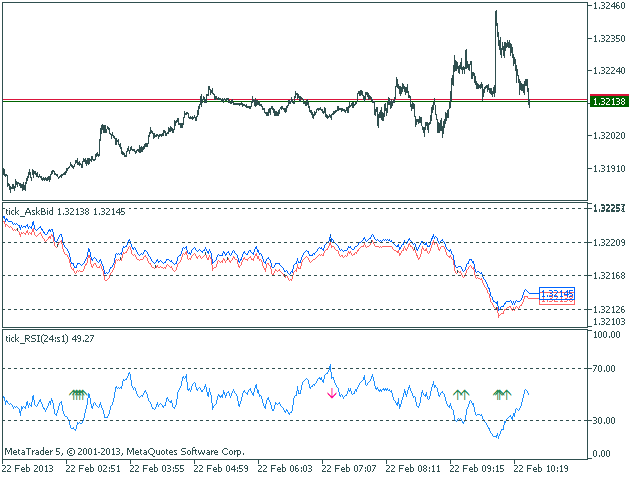
El indicador Relative Strength Index dibujado utilizando un gráfico de ticks.
Después de lanzarlo, espere a que aparezcan suficientes ticks.
Parámetros:
- Período RSI - período de promediación.
- Nivel de sobrecompra - nivel de sobrecompra.
- nivel de sobreventa - nivel de sobreventa.
- barra calculada - número de barras en el gráfico para el cálculo del indicador.
Los siguientes parámetros sirven para ajustar el peso de las señales RSI (de 0 a 100). Puede encontrar su descripción en la sección Señales del Oscilador Índice de Fuerza Relativa de la Referencia MQL5.
- El oscilador tiene dirección requerida.
- Retroceso detrás del nivel de sobrecompra/sobreventa.
- Oscilación fallida.
- Divergencia del oscilador y el precio.
- Doble divergencia del oscilador y el precio.
- Cabeza/hombros.
Índices de amortiguación: 0 - RSI_LINE, 1 - SIGNAL_UP, 2 - SIGNAL_DOWN, 3 - BID, 4 - ASK.


One has to install from inside market window tab in terminal. works fine then