Setup 91 Larry Williams With Notifications
- Indikatoren
-
Rafael Henrique Capati
 Web Developer with experience in IT, now fascinated with automated trading and indicators for MT5. I'm very happy to collaborate with the community and share my experiences.
 - Version: 1.12
- Aktualisiert: 31 März 2021
- Aktivierungen: 5
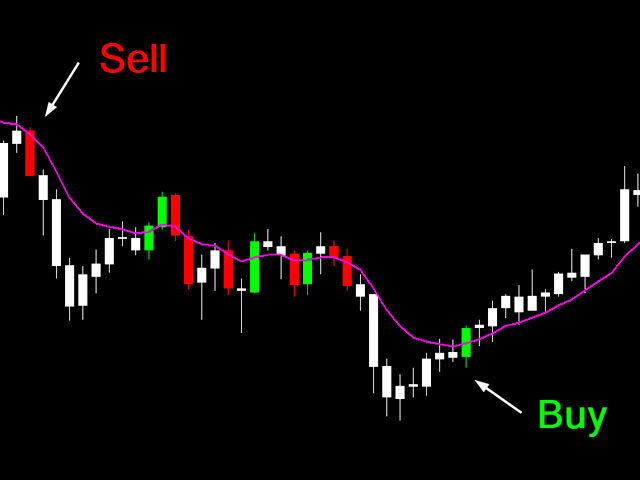
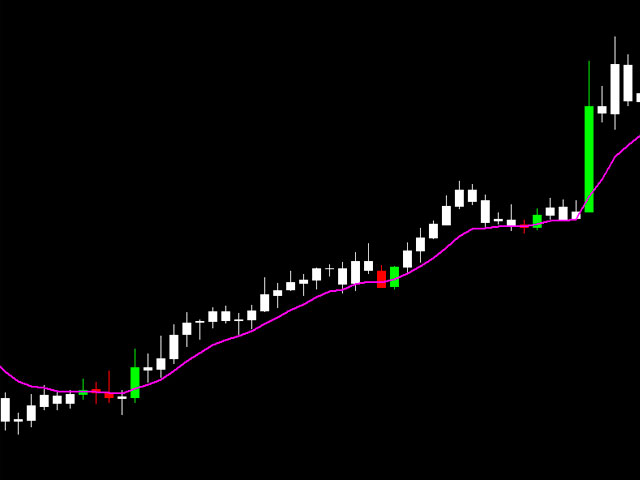
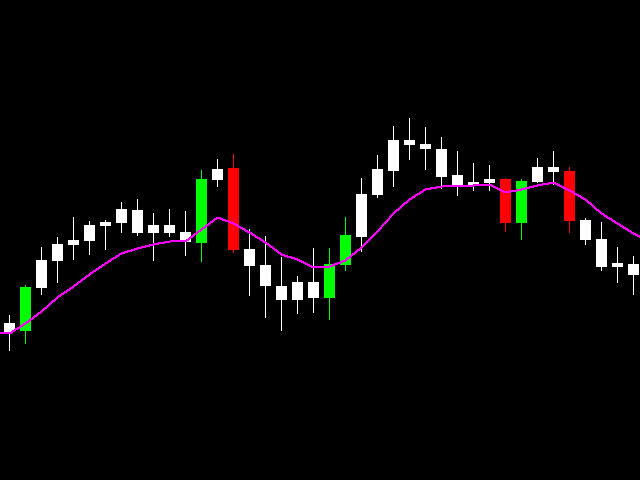
Die Strategie Setup 9.1 wurde von dem nordamerikanischen Händler Larry Williams entwickelt.
SIMPLE Setup, effektiv, mit einem guten Maß an Genauigkeit und hervorragende Rendite.
Kaufsignal:
- Der exponentielle gleitende Durchschnitt von 9 (MME9) fällt, warten Sie, bis er sich nach oben dreht (bei geschlossener Kerze).
- Platzieren Sie einen Kauf-Stopp-Auftrag 1 Tick über dem HIGH der Kerze, die die Wende verursacht hat.
- Der Einstieg erfolgt bei der nächsten Kerze, die dieses Hoch durchbricht. Wenn das Hoch bei der nächsten Kerze nicht durchbrochen wird, können Sie die Order stornieren und auf ein neues Signal warten, oder wenn der MME9 weiter fällt, bleibt der Einstieg gültig (optional). Wenn der gleitende Durchschnitt nach unten dreht (gegenteiliges Signal), wird der Auftrag abgebrochen.
- Stop-Loss 1 Tick unter dem Tief der Kerze, die das Signal gab. Nach dem Kauf wird der Handel von MME9 durchgeführt, d.h. bis er nach unten dreht und die Kerze, die diese Drehung verursacht hat, ihren Tiefpunkt verliert.
Verkaufssignal:
- Der exponentielle gleitende Durchschnitt von 9 (MME9) steigt, erwarten Sie, dass er sich nach unten dreht (bei geschlossener Kerze).
- Platzieren Sie einen Verkaufsstopp 1 Tick unter dem LOW der Kerze, die die Wende ausgelöst hat.
- Die Bestätigung des Einstiegs erfolgt bei der nächsten Kerze, die dieses Tief durchbricht. Wenn es bei der nächsten Kerze nicht durchbrochen wird, kann der Auftrag storniert werden. Wenn der gleitende Durchschnitt jedoch weiter ansteigt, kann der Auftrag offen gehalten werden, bis der Durchbruch erfolgt. Wenn der gleitende Durchschnitt nach oben dreht (gegenteiliges Signal), wird der Auftrag annulliert.
- Stop-Loss 1 Tick über dem Hoch der Kerze, die das Signal gab.
- Nach dem Verkauf wird der Handel von MME9 weitergeführt, d.h. bis der gleitende Durchschnitt nach oben dreht und die Kerze, die diese Drehung verursacht hat, ihren Höchststand verliert.
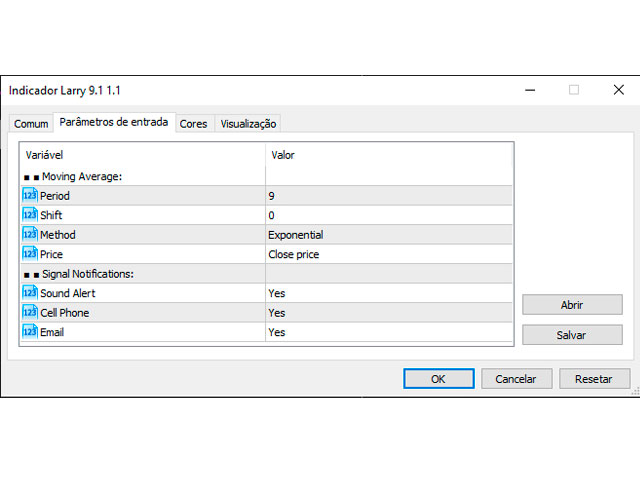
Benachrichtigungen
Sie müssen nicht mehr die ganze Zeit auf den Chart starren und auf ein Signal warten, denn es ist jetzt möglich, Signalbenachrichtigungen auf Ihrem Handy, per E-Mail oder einen akustischen Alarm auf der Plattform zu erhalten. Dies kann sehr hilfreich sein, wenn Sie nicht viel Zeit haben, um auf den Bildschirm zu schauen oder einfach auf eine Bestätigung warten, um sich zu positionieren.
Auf diese Weise müssen die Anleger nicht lange warten, um eine perfekte Konfiguration zu erhalten. Zum richtigen Zeitpunkt erhalten sie den Indikatoralarm und können die Setup-Formation analysieren.