Three Green and Three Red 4Umbrella
- Indikatoren
- Version: 1.0
- Aktivierungen: 5

Für diesen Satz von Indikatoren
1. Allgemeine Informationen
- Berechnet mit hochleistungsfähigen mathematischen Algorithmen.
- Berechnet aus dem Preis der Kerzen
- Der Einstiegspunkt dieses Auftrags wird durch den Zug EMA und den Oszillator gefiltert.
- Berechnen Sie die Integrität der Kerze
2. Wie funktioniert das?
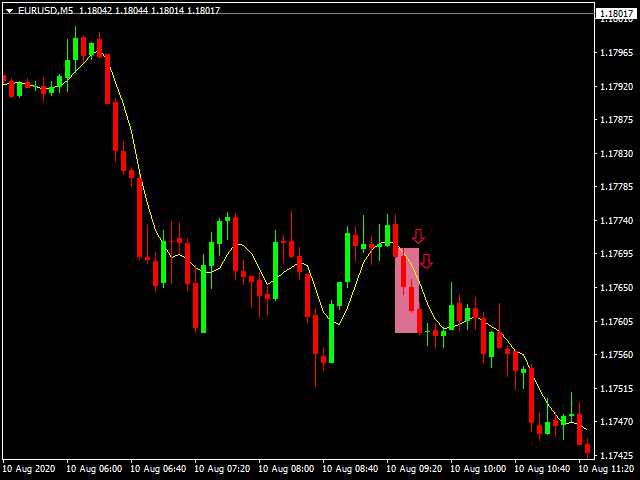
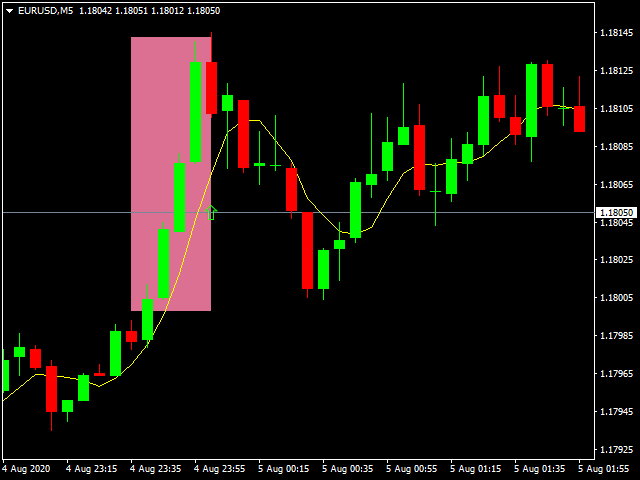
- Es gibt zwei Arten von Ordereingangspunkten: die Benachrichtigung auf dem Monitor und der Pfeil.
- Sie können sich zu 75-95 Prozent auf diesen Einstiegspunkt verlassen.
3. Einstellungen
- Retracement ist der Rücklauf der Kerze zwischen 23,6% - 100%
- Expansion ist die Verlängerung der Kerze um 100% oder höher
- Eine vollständige Kerze liegt zwischen 61,8-100%.
- EMA Low ist der Haupttrend 100 - 250
- EMA Fast ist ein Untertrend von 13 - 55.
- SMA ist ein Filter, kurzfristig ist 5 - 10.
- RSI ist zu viel kaufen (70-90) (überkauft)
- RSI ist zu viel verkaufen (10-30) (überverkauft)
- RSI ist der Trend (5 oder höher)
4. Verwenden Sie
- Alle Vermögenswerte
- Wenn Sie den resultierenden Pfeil sehen, können Sie den Auftrag sofort eingeben.
- Benachrichtigungen
1. überwachen
2. per E-Mail
3. per Mobiltelefon
5. Für wen ist es geeignet?
- Forex Zeitrahmen H1 oder höher
- Binäre Optionen (M1-M15)
- Kurzer Handel, mittlerer Handel, langer Handel