Profit on fibonacci
- Indikatoren
- Version: 1.1
- Aktualisiert: 20 Dezember 2019
- Aktivierungen: 5

mql5 Version: https: //www.mql5.com/en/market/product/44815
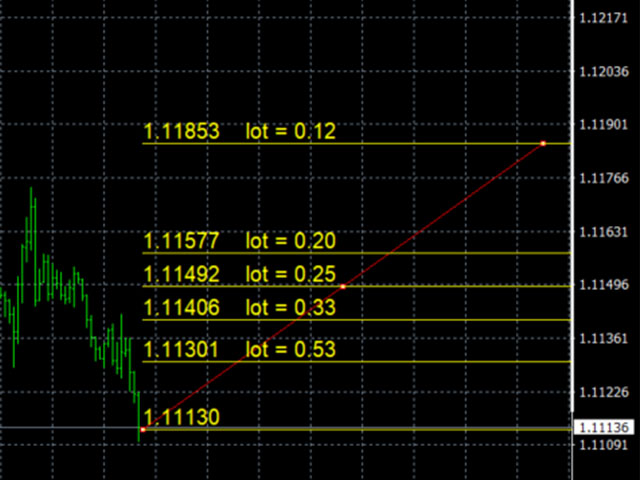
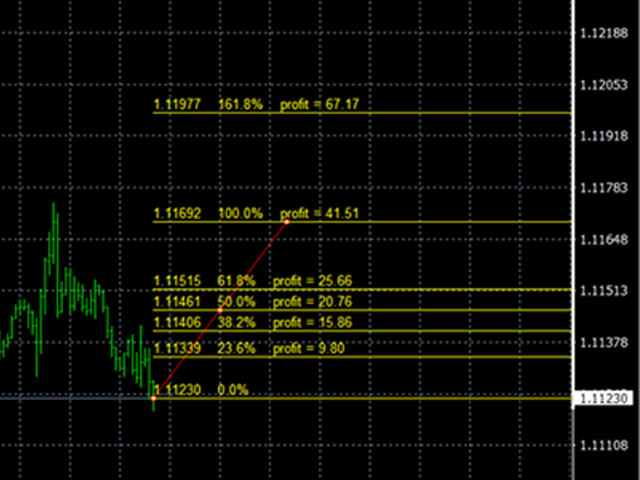
Einfacher Indikator zur Berechnung des Gewinns auf Fibonacci-Retracement-Levels mit fester Losgröße, oder zur Berechnung der Losgröße auf Fibonacci-Levels mit festem Gewinn. Fügen Sie dem Chart hinzu und verschieben Sie die Trendlinie, um die Fibonacci-Retracement-Levels festzulegen. Funktioniert ähnlich wie die Standard-Fibonacci-Retracement-Linien-Studie in Metatrader.
Eingaben
- Fixed - wählen Sie aus, welcher Wert fixiert werden soll, Lot oder Profit
- Fixer Wert - Wert, der auf allen Ebenen fixiert werden soll
- Levels - Levels, für die Werte berechnet werden sollen, getrennt durch Leerzeichen, Standard sind Fibonacci-Levels
- Spread verwenden - wenn wahr, wird der Spread in die Berechnungen einbezogen
- Preis anzeigen - wenn wahr, wird der Preis auf den Ebenen angezeigt
- Fibonacci-Level anzeigen - wenn wahr, werden die Werte der Levels angezeigt
- Fibonacci-Linien als Strahlen - wenn wahr, werden die Levels als Strahlen dargestellt
- Fibonacci-Linien Farbe - Farbe der Levels
- Farbe der Trendlinie - Farbe der Trendlinie, die das Fibonacci-Retracement definiert
- Schriftgröße
- Instanz - eindeutige Nummer des Indikators, wenn Sie mehrere ProfitOnFibonacci-Indikatoren auf demselben Diagramm hinzufügen möchten, müssen sie unterschiedliche Instanznummern haben