ForexAurum Fibonacci
- Indikatoren
- Version: 1.0
- Aktivierungen: 5

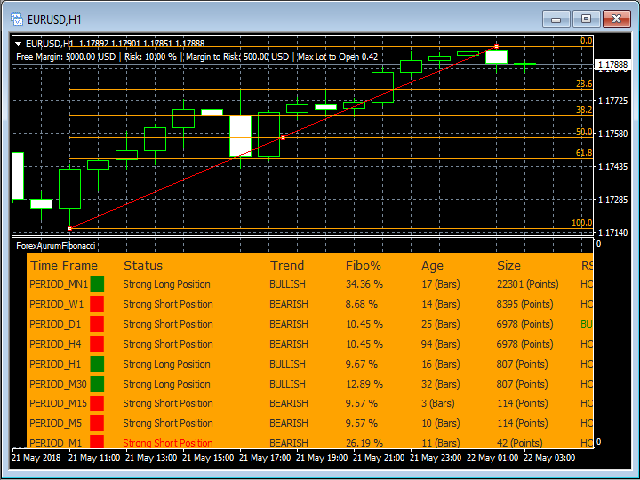
DerForexAurum Fibonacci-Indikator ist ein nützliches Werkzeug für Händler, die Fibonacci in Kombination mit den ZigZag-Indikatoren verwenden. Er verwendet die Echtzeitberechnung der Niveaus für alle Zeitrahmen und zeigt die Ergebnisse für Sie an. Zusätzlich können Sie RSI-, ADX- und Stochastik-Indikatoren einrichten, um den Einstieg zu bestätigen.
Wie man es benutzt
Ziehen Sie den Indikator einfach auf ein 1-Minuten-Diagramm eines beliebigen Symbols und legen Sie ihn dort ab. Dann können Sie nach der Initialisierung jederzeit zu einem höheren Zeitrahmen wechseln.
Empfehlung
- Ziehen Sie die Indikatoren immer auf einen 1-Minuten-Chart.
- Verwenden Sie den Fibonacci-Indikator, um die Unterstützung und den Widerstand auf einem höheren Zeitrahmen(1 Stunde und 4 Stunden) zu bestimmen.
- Verwenden Sie die anderen Indikatoren, um Eingaben auf einem niedrigeren Zeitrahmen(15 Minuten) zu bestätigen.
Parameter
- Risiko %: Der Indikator verwendet diesen Parameter, um die maximale Losgröße zu berechnen, die Sie auf der Grundlage der freien Marge eröffnen können.
- Debug-Protokoll: Die Aktivierung des Debug-Logs kann für den Support erforderlich sein.
- RSI_PARAM: Trennzeichen für den Abschnitt RSI-Parameter.
- RSI-Periode: die RSI-Periode, standardmäßig 14.
- RSI Max Level: das überkaufte Niveau, standardmäßig 70%.
- RSI Min Level: Das überverkaufte Niveau, standardmäßig 30%.
- ADX_PARAM: Begrenzungszeichen für den Abschnitt ADX-Parameter.
- ADX Periode: die ADX Periode, standardmäßig 14.
- ADX Level: die Trendstärke, standardmäßig 30 %.
- STOCHASTIC_PARAM: Begrenzungszeichen für den Abschnitt Stochastik-Parameter.
- Periode der %K-Linie: standardmäßig 5.
- Periode der %D-Linie: standardmäßig 3.
- Verlangsamung: Standardmäßig 3.
- STC Max Level: das überkaufte Niveau, standardmäßig 80 %.
- STC Min Level: das überverkaufte Niveau, standardmäßig 20%.
Alle Ihre Bemerkungen sind willkommen, bitte zögern Sie nicht, uns zu kontaktieren.