Deluxe Pivot Point Plotter
- Indikatoren
- Version: 3.0
- Aktualisiert: 24 März 2020
- Aktivierungen: 5

Übersicht
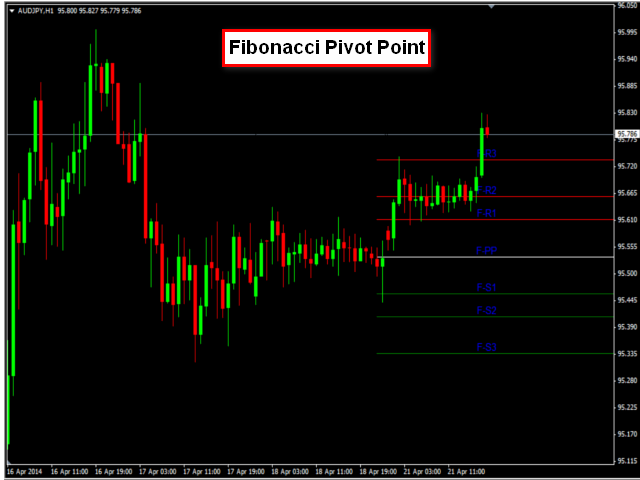
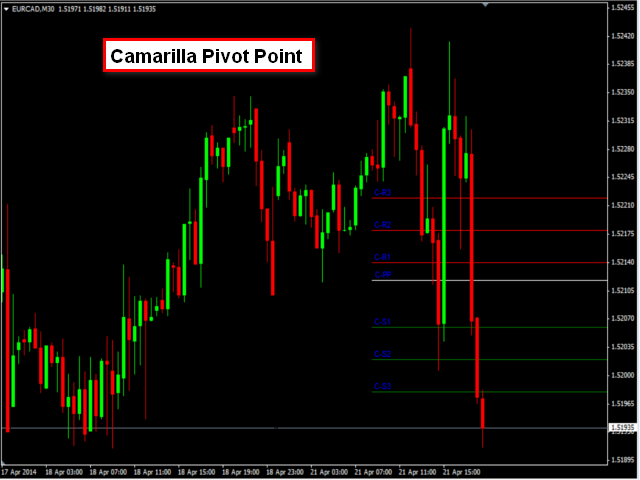
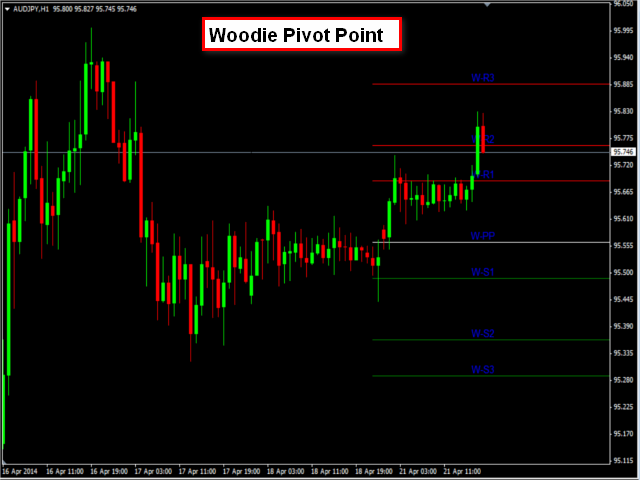
Dies ist die DELUXE-Version der Pivot Point Plotter-Serie. Es handelt sich um einen robusten Indikator, der dynamisch jeden der 4 wichtigsten Pivot-Punkte auf Ihrem Chart berechnet und einzeichnet, unabhängig vom Intraday-Zeitrahmen, auf dem der Indikator platziert ist.Dieser Indikator kann STANDARD, CAMARILLA, FIBONNACI oder WOODIE tägliche Pivot-Punkte darstellen. Welchen Indikator Sie auch immer für Ihren Handel verwenden, dieser Indikator ist Ihr One-Stop-Shop.
Bitte beachten Sie, dass es sich um einen DAILY Pivot Point Plotter für DAY TRADER handelt, die auf MT4-Plattformen mit Intra-Day-Zeitfenstern (d.h. 1MIN, 5MIN, 15MIN, 30MIN, 1H und 4H) handeln. Dieser Indikator ist ein absoluter Daytrader-Begleiter.
Merkmale
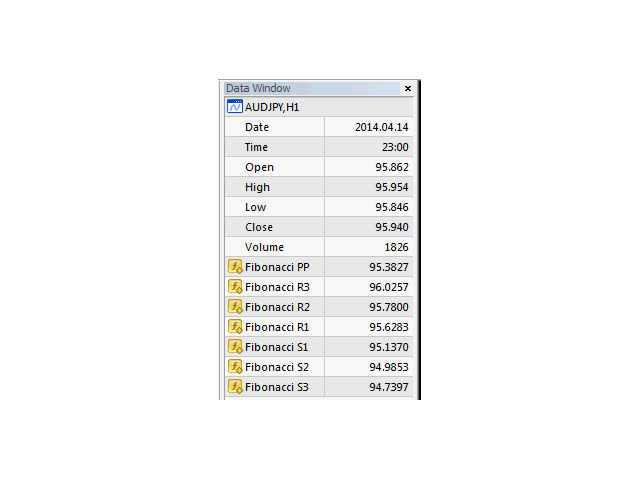
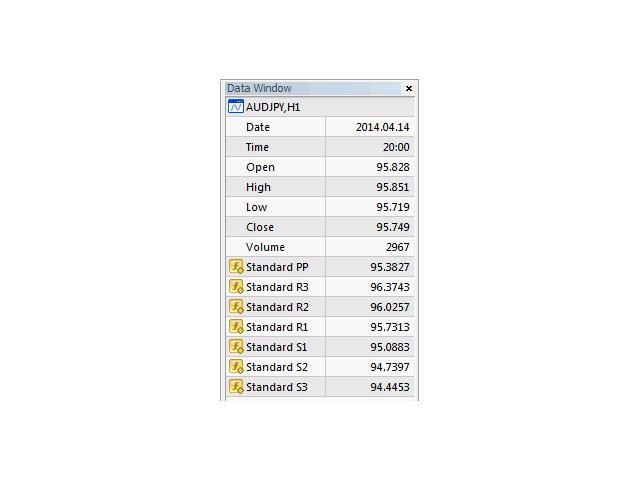
- Zeichnet STANDARD, CAMARILLA, FIBONNACI oder WOODIE tägliche Pivot-Punkte
- Berechnet und plottet dynamisch tägliche Pivot-Punkte (zentraler Pivot-Punkt, R1, R2, R3, S1, S2 und S3)
- Enthält die Option zur Berechnung und Darstellung von Mittelpunkten
- Tägliche Pivot-Punkte werden unabhängig vom Intraday-Zeitrahmen gezeichnet, auf dem Sie handeln, d.h. 1MIN, 5MIN, 15MIN, 30MIN, 1H und 4H Zeitrahmen. Die täglichen Pivot-Punkte ändern sich nicht, wenn Sie den Zeitrahmen wechseln.
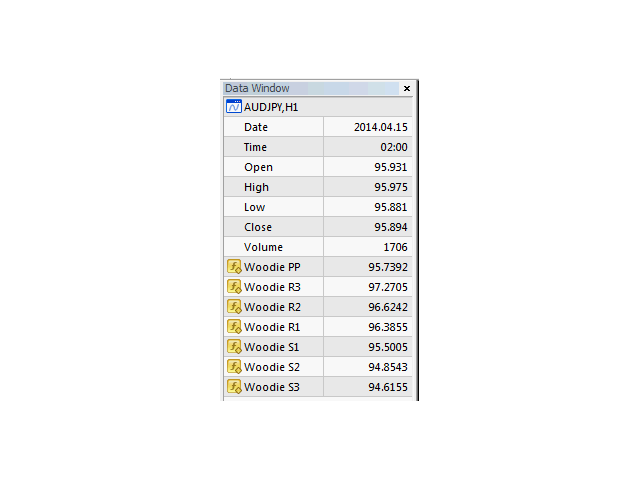
- Die Werte der vorangegangenen Tage sind im Puffer enthalten und können im Datenfenster angezeigt werden. Dies ist besonders nützlich, wenn Sie verstehen möchten, wie sich der Preis um Pivot-Punkte herum verhält.
- Vollständig anpassbare Optionen (siehe Abschnitt 'EINGABEPARAMETER')
- Kann so konfiguriert werden, dass täglich eine E-Mail mit den täglichen Pivot-Punkten gesendet wird
- Kann so konfiguriert werden, dass täglich eine Benachrichtigung über Daily Pivot-Punkte an ein mobiles Endgerät gesendet wird
- Kann in EAs verwendet werden, die iCustom verwenden, um Daten aus dem entsprechenden Puffer zu erhalten (siehe Abschnitt "INDICATOR BUFFER" für Details)
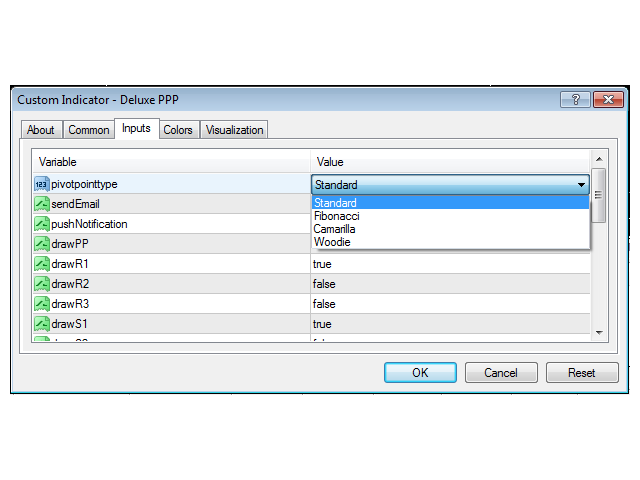
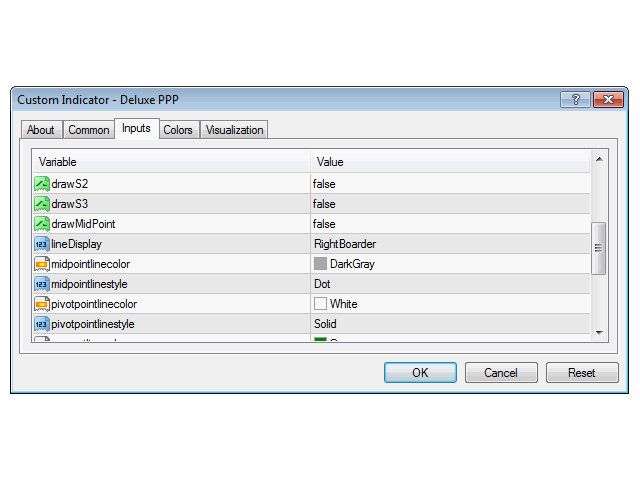
Eingabe-Parameter
- pivotpointtype - Typ des zu zeichnenden Pivotpunktes
- sendEmail - E-Mail an die im MetaTrader 4 konfigurierte E-Mail-Adresse senden
- pushNotification - Push-Benachrichtigung an mobiles Endgerät
- drawPP - Pivotpunkt zeichnen
- drawR1 - Widerstandswert 1 zeichnen
- drawR2 - Widerstandswert 2 zeichnen
- drawR3 - Widerstandswert 3 zeichnen
- drawS1 - Unterstützung zeichnen 1
- drawS2 - Stützpunkt 2 zeichnen
- drawS3 - Unterstützung 3 zeichnen
- drawMidPoint - Mittelpunkte zeichnen
- lineDisplay - Zeichnet Pivot-Linien im gesamten Diagramm oder am rechten Rand des Diagramms
- midpointlinecolor - Linienfarbe der Midpoints
- midpointlinestyle - Linienstil der Midpoints
- pivotpointlinecolor - Linienfarbe des zentralen Pivotpunktes
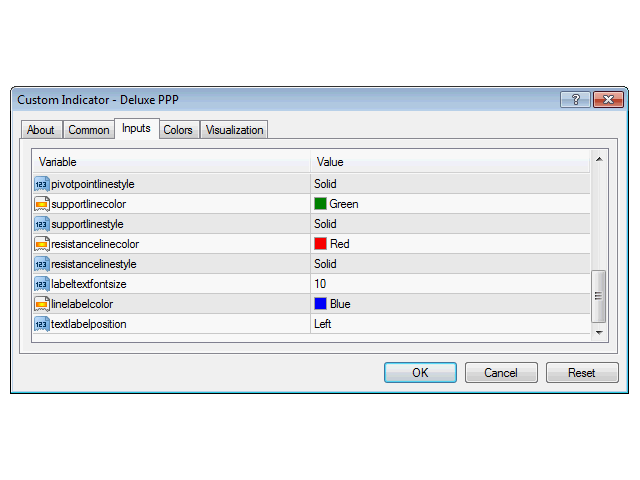
- pivotpointlinestyle - Linienstil des zentralen Pivotpunktes
- supportlinecolor - Linienfarbe der Unterstützungslinien (S1, S2 und S3)
- supportlinestyle - Linienstil der Unterstützungslinien (S1, S2 und S3)
- resistancelinecolor - Linienfarbe der Widerstandslinien (R1, R2 und R3)
- resistancelinestyle - Linienstil der Widerstandslinien (R1, R2 und R3)
- labeltextfontsize - Schriftgröße der Textbeschriftung
- linelabelcolor - Farbe der Textbeschriftung
- textlabelposition - Position der Textbeschriftung
Vorteile
- Spart Zeit, da Sie nie wieder tägliche Pivots manuell berechnen müssen...NIEMALS (Sehen Sie, wie Sie mit der PPP-Serie Geld und Zeit sparen können, im Abschnitt 'WIE DIE PPP-SERIE ZEIT UND GELD SPART').
- Nutzt die Daten der Plattform Ihres Brokers, so dass Sie sich nicht auf bereits berechnete Pivot-Punkte von Websites im Internet verlassen müssen, deren Daten sich von denen Ihres Brokers unterscheiden könnten.
- Vollständig anpassbar, so dass nur Pivot-Punkte angezeigt werden, die Sie in Ihrer Strategie verwenden (siehe Abschnitt 'EINGABEPARAMETER' für eine vollständige Liste der anpassbaren Optionen).
- Kann für alle Instrumente auf dem MetaTrader 4 verwendet werden.
Indikator-Puffer
- Puffer 0 - Zentraler Pivot-Punkt
- Puffer 1 - Widerstand 3
- Puffer 2 - Widerstand 2
- Puffer 3 - Widerstand 1
- Puffer 4 - Unterstützung 1
- Puffer 5 - Unterstützung 2
- Puffer 6 - Stütze 3
Wie die PPP-Serie hilft, Zeit und Geld zu sparen
Nehmen wir an, dass:
- Sie verbringen jeden Tag 5 Minuten mit der Berechnung und Darstellung von Pivot-Punkten in einem einzigen Chat.
- Ihre 1 Stunde Arbeit ist 7,25 $ wert (Federal Minimum Wage in den Vereinigten Staaten)
- Es gibt 20 Handelstage im Monat
- Zeitaufwand für die Berechnung und Darstellung von Pivot-Punkten in einem Monat = 5 * 20 = 100 Minuten (20 Handelstage im Monat)
- Zeitaufwand für die Berechnung und Darstellung von Pivot-Punkten in einem Jahr = 100 * 12 (Monate in einem Jahr) = 1200 Minuten
- 1200 min in Stunden umrechnen = 1200/60 = 20 Stunden
- 20 Stunden Arbeit monetarisieren = 20 * 7,25 = $145
Die obige Analyse zeigt, dass Sie unter den konservativsten Annahmen 20 Stunden pro Jahr für die Berechnung und Darstellung von Pivot-Punkten aufwenden würden. Die aufgewendete Zeit hätte einen Aufwand von 145 $ bedeutet. Wenn Sie 2 Paare handeln, wären das 290 $ im Jahr. Wenn Sie mit 3 Währungspaaren handeln, wären es 435 $. Stellen Sie sich vor, wie viel es wäre, wenn Sie mit 5 oder mehr Währungen handeln würden.
Anhand der obigen Analyse können Sie sofort erkennen, wie viel Zeit und Geld Sie für die vermeintlich einfachste Sache der Welt aufwenden.
Investieren Sie Ihre Zeit sinnvoll in Ihre Strategie und lassen Sie Daily Pivot die harte Arbeit der Berechnung und Darstellung Ihrer täglichen Pivot-Punkte erledigen.