SRFactor mt5
- Indikatoren
- Version: 1.2
- Aktualisiert: 14 August 2018

Dieser Indikator identifiziert kurz-, mittel- und langfristige Höchst- und Tiefststände des Marktes nach der von Larry Williams in seinem Buch "Long-term secrets to short-term trading" beschriebenen Methode.
Kurze Beschreibung des Prinzips zur Identifizierung der Markthochs und -tiefs
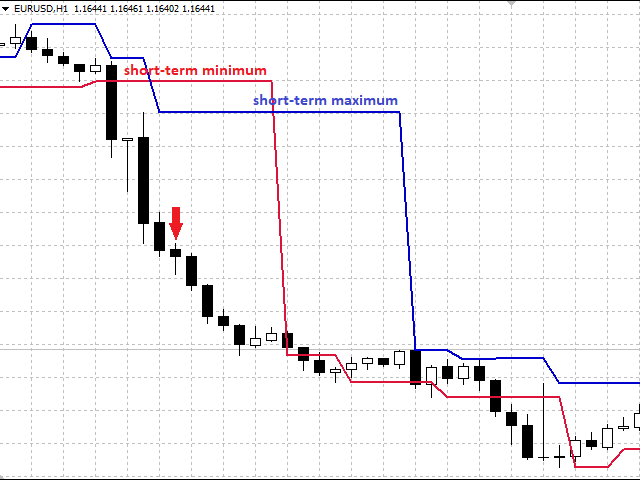
Ein kurzfristiges Hoch ist ein Hoch eines Balkens mit niedrigeren Hochs auf beiden Seiten, und umgekehrt ist ein kurzfristiges Tief eines Balkens ein Tief mit höheren Tiefs auf beiden Seiten. Mittelfristige Hochs und Tiefs werden in ähnlicher Weise bestimmt: Ein mittelfristiges Hoch ist ein kurzfristiges Hoch mit niedrigeren kurzfristigen Hochs zu beiden Seiten, ein mittelfristiges Tief ist ein kurzfristiges Tief mit höheren kurzfristigen Tiefs zu beiden Seiten. Langfristige Extrema werden nach demselben Prinzip bestimmt, abhängig von den nächstgelegenen mittelfristigen Hochs und Tiefs. Innere Balken mit einem niedrigeren Hoch und einem niedrigeren Tief als das des vorherigen Balkens werden bei der Analyse nicht berücksichtigt. Die kurzfristigen Extremwerte werden also mit einer Verzögerung von mindestens einem Balken ermittelt.
Verwendung des Indikators für die technische Analyse des Marktes
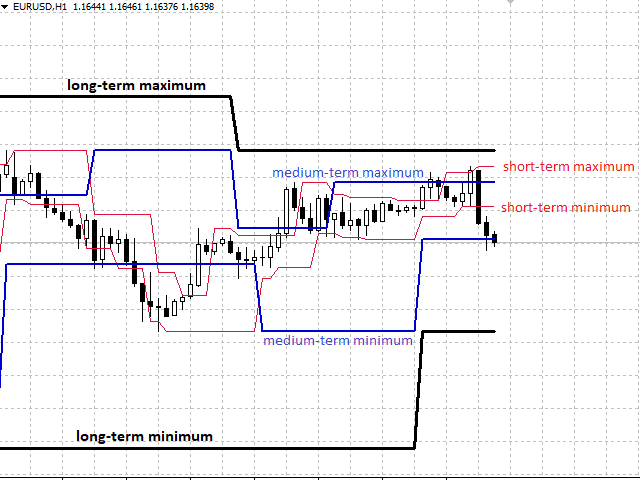
Die Position des Kurses eines Instruments im Verhältnis zu den Indikatorlinien sowie die Position der Indikatorlinien zueinander geben Aufschluss über die Trendentwicklung, ermöglichen ein schnelles Auffinden der Unterstützungs- und Widerstandsniveaus und bestimmen das Potenzial für einen Anstieg (Rückgang) des Kurses durch langfristige Hochs und Tiefs. Dieser Indikator ist nützlich für die Erstellung von automatischen Handelssystemen, da er es Ihnen ermöglicht, die Trendrichtung schnell programmatisch zu bestimmen.
Das Abprallen des Kurses von einem Hoch oder Tief ist eine Bestätigung für das Vorhandensein eines Unterstützungs- oder Widerstandsniveaus und dient als Signal für die Eröffnung von Geschäften beim nächsten Ausbruch oder einem Abprallen von diesem Niveau. Weitere Informationen über Einstiegssignale finden Sie in dem Buch von Larry Williams.
Der Indikator zeichnet die Linien nicht neu, sobald sie durchbrochen wurden, und positioniert die mittel- und langfristigen Hochs (Tiefs) nicht neu. Wenn sich ein kurzfristiges Hoch (Tief) als höher (niedriger) erweist, ist es möglich, den Trend anhand der Position der Indikatorlinien im Verhältnis zueinander zu bestimmen. In einigen Fällen, wenn sich ein Outside Bar bildet, kann das kurzfristige Tief höher sein als das kurzfristige Hoch. Dies ist kein Fehler in der Logik des Indikators, sondern kann als Einstiegspunkt für eine Short- oder Long-Position dienen (siehe Abbildung 1). Dieses Prinzip wird bei Signalen des ersten Typs im SRVector Indikator verwendet.
Parameter
- Kurzfristige Extremwerte anzeigen - zeigt die kurzfristigen Niveaus an;
- Mittelfristige Extremwerte anzeigen - zeigt die mittelfristigen Niveaus an;
- Langfristige Extrema anzeigen - zeigt die langfristigen Niveaus an;
- Preise für die Bildung von Extremen - stellt die Niveaus auf der Grundlage von Höchst- und Tiefstpreisen oder auf der Grundlage von Eröffnungs- und Schlusskursen der Balken dar.

Полезный индикатор, пользуюсь им постоянно, но есть вопрос: какие цифровые значения периодов используются в этом индикаторе? На примере ZigZag например там 3 цифры периодов, в индикаторе их можно выставить, но здесь уже кастомные неменяющиеся, собственно какие значения используются? Это нужно знать для настройки других индикаторов в купе с этим.