SRFactor mt5
- Indicadores
-
Aleksandr Teleguz
 Программист python
 - Versión: 1.2
- Actualizado: 14 agosto 2018
Este indicador identifica los máximos y mínimos del mercado a corto, medio y largo plazo según el método descrito por Larry Williams en el libro "Long-term secrets to short-term trading".
Breve descripción del principio de identificación de los máximos y mínimos del mercado
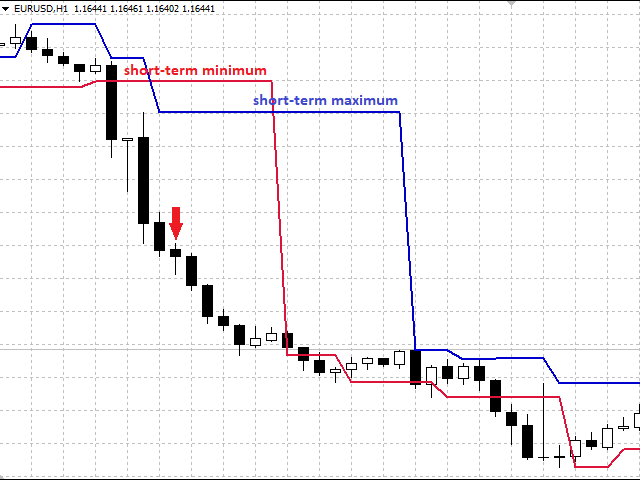
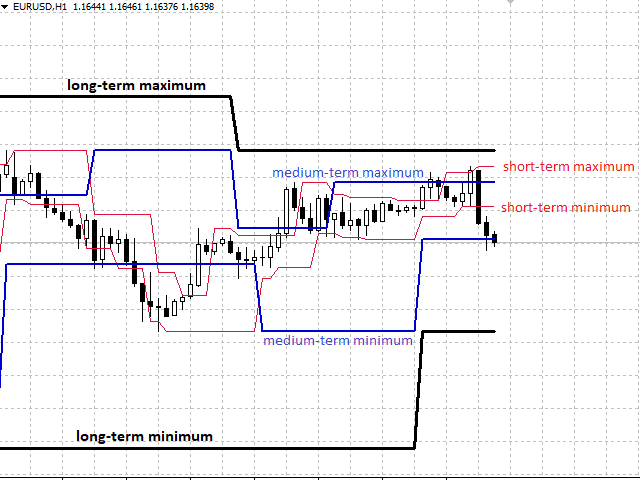
Un máximo a corto plazo es un máximo de una barra con máximos más bajos a ambos lados y, a la inversa, un mínimo a corto plazo de una barra es un mínimo con mínimos más altos a ambos lados. Los máximos y mínimos a medio plazo se determinan de forma similar: un máximo a medio plazo es un máximo a corto plazo con máximos a corto plazo más bajos a ambos lados, y un mínimo a medio plazo es un mínimo a corto plazo con mínimos a corto plazo más altos a ambos lados. Los extremos a largo plazo se determinan por el mismo principio, en función de los máximos y mínimos a medio plazo más próximos. Las barras interiores con un máximo y un mínimo inferiores a los de la barra anterior no se tienen en cuenta durante el análisis. Por lo tanto, los extremos a corto plazo se determinan con un retraso de al menos una barra.
Utilización del indicador para el análisis técnico del mercado
La posición del precio de un instrumento con respecto a las líneas del indicador, así como la posición de las líneas del indicador entre sí, da una idea del desarrollo de la tendencia, permite encontrar rápidamente los niveles de soporte y resistencia, determinar el potencial de crecimiento (caída) del precio por máximos y mínimos a largo plazo. Este indicador será útil para crear sistemas automáticos de trading, ya que permite determinar rápidamente la dirección de la tendencia de forma programática.
El rebote del precio desde un máximo o un mínimo es una confirmación de la presencia de un nivel de soporte o resistencia y sirve como señal para abrir operaciones en la próxima ruptura o rebote desde este nivel. Puede encontrar información adicional sobre señales de entrada en el libro de Larry Williams.
El indicador no redibuja las líneas una vez que se rompen y no reposiciona los máximos (mínimos) a medio y largo plazo. Si un máximo (mínimo) a corto plazo resulta ser superior (inferior), es posible determinar la tendencia basándose en la posición de las líneas del indicador entre sí. En algunos casos, cuando se forma una barra exterior, el mínimo a corto plazo puede ser superior al máximo a corto plazo. Esto no es un error en la lógica del indicador, sino que puede servir como punto de entrada para una posición corta o larga (véase la figura 1). Este principio se utiliza en las señales del primer tipo del indicador SRVector.
Parámetros
- Mostrarextremos a corto plazo - muestra los niveles a corto plazo;
- Mostrar extremos a medio plazo: muestra los niveles a medio plazo;
- Mostrar extremos a largo plazo - mostrar los niveles a largo plazo;
- Precios para construir extremos - trazar los niveles basados en precios altos y bajos, o basados en precios de apertura y cierre de las barras.

Полезный индикатор, пользуюсь им постоянно, но есть вопрос: какие цифровые значения периодов используются в этом индикаторе? На примере ZigZag например там 3 цифры периодов, в индикаторе их можно выставить, но здесь уже кастомные неменяющиеся, собственно какие значения используются? Это нужно знать для настройки других индикаторов в купе с этим.