Stochastic Dashboard
- Indikatoren
- Version: 2.10
- Aktualisiert: 25 August 2018
- Aktivierungen: 5

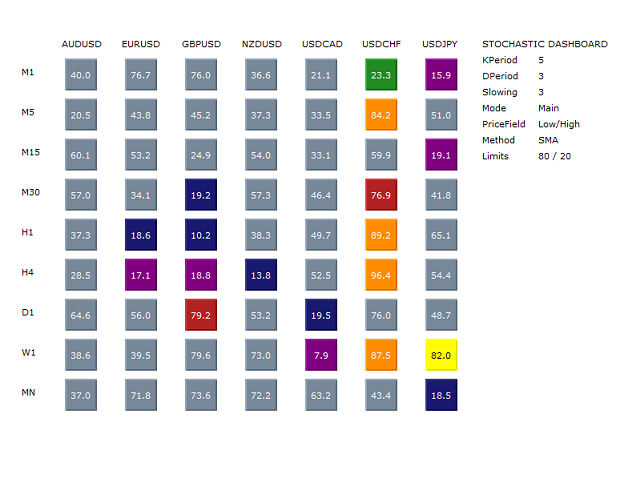
Stochastic Dashboard ist ein Informationspanel, das Ihnen einen globalen Marktüberblick durch einen stochastischen Indikator ermöglicht.
Stochastic Dashboard analysiert und verfolgt alle Vermögenswerte, in die Sie investieren möchten. Profitieren Sie von diesem nützlichen Dashboard, mit dem Sie in wenigen Sekunden den Chart öffnen und schnell in ihn investieren können.
Hauptmerkmale von Stochastic Dashboard
- Grafisches Panel, das es Ihnen ermöglicht, die Situation vieler Vermögenswerte zu erkennen.
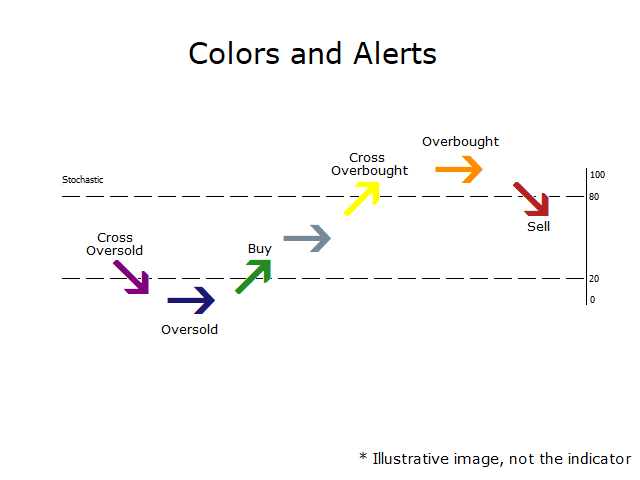
- 7 verschiedene stochastische Situationen, um zu erkennen, wann ein Vermögenswert überkauft oder überverkauft ist.
- Alarme, Mails und Benachrichtigungen, die Ihnen die Möglichkeit geben, nach neuen Marktchancen zu suchen.
- Alle stochastischen Eingaben sind zu 100% anpassbar, einschließlich der überkauften und überverkauften Niveaus.
- Sie können auch auswählen, ob die Berechnung nach dem Schließen der Kerze oder mit der aktuellen Kerze durchgeführt werden soll.
Wie der Indikator funktioniert
Die Farben und Warnmeldungen des Indikators werden in der Abbildung "Farben und Warnmeldungen" dargestellt.
Alle Alarme werden Sie einmal pro Kerze über die Situation informieren. Wenn die überkauften oder überverkauften Signale aktiviert sind, werden Alarme gesendet, solange sich der Indikator in dieser Zone befindet. Die Demoversion ist aufgrund der Einschränkungen des Strategietesters auf einen einzigen Vermögenswert beschränkt.
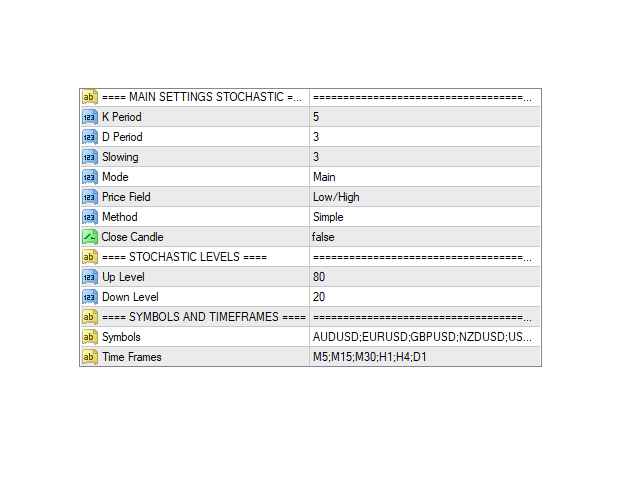
Eingaben
- Haupteinstellungen Stochastik
- K-Periode
- D-Periode
- Verlangsamung
- Modus (Haupt oder Signal)
- Preisfeld (Tief/Hoch oder Schluss/Schluss)
- Methode (einfach, exponentiell, geglättet oder linear gewichtet)
- Close Candle (Stochastik wird mit geschlossener Kerze oder mit aktueller Kerze angezeigt)
- Stochastik-Stufen
- Aufwärts Level
- Abwärts Level
- Symbole und TimeFrames
- Symbole (Symbole müssen durch ";" getrennt und ohne Leerzeichen angezeigt werden)
- Zeitrahmen (Zeitrahmen, die durch ";" getrennt und ohne Leerzeichen angezeigt werden - M1, M5, M15, M30, H1, H4, D1, W1 und MN)
- Alarme und Mails
- Kauf/Verkaufsalarm, Mail oder Benachrichtigung (Alarme ein- oder ausschalten)
- Overbought/Sold Alert, Mail oder Benachrichtigung (Alarme ein- oder ausschalten)
- Cross Overbought/Sold Alert, Mail oder Benachrichtigung (Alarme ein- oder ausschalten)
- Diagramme
- Schriftfarbe
- Indikatordaten anzeigen (aktivieren oder deaktivieren Sie die seitlichen Informationen in Bezug auf die Stochastik und ihre Konfiguration)
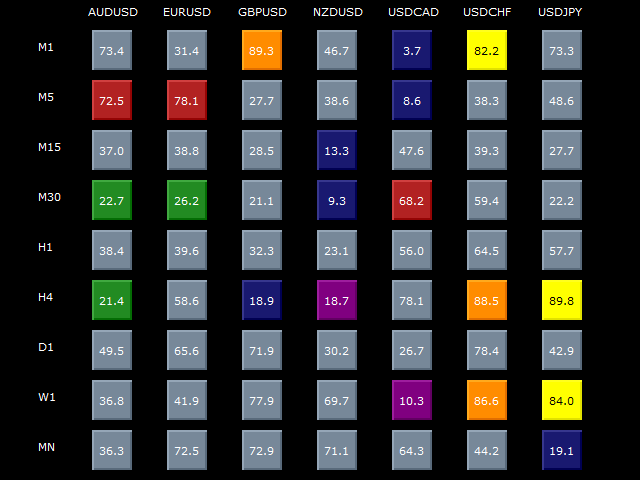


This is a great indicator to spot 'clusters' of overbought'
or 'oversold' pairs and other instruments from a stochastics point of view.
My only resrvation it the size of the indicator
- the buttons, text and spacing could be half their size
- any plans to modify / updgrade to allow more user control over these
- as inputs - that would really top off a great indicator
cheers