• Übersicht
  • Bewertungen
  • Diskussion (4)
  • Neue Funktionen

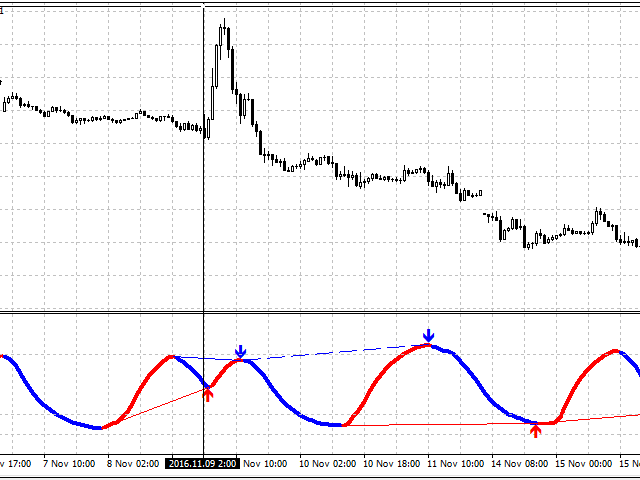
DSS Divergence Trader

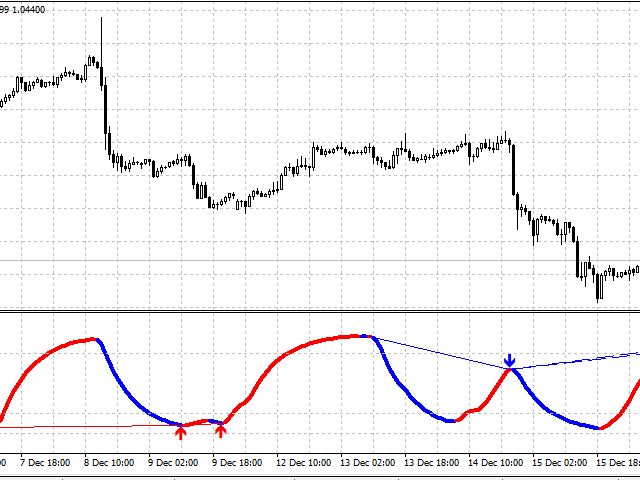
Convergence is when the higher highs and higher lows of an uptrend are also confirmed by our indicator making lower lows which helps us confirm that momentum is increasing and so the trend is likely to continue. Vice versa for a downtrend.

Divergence is when we get higher highs on an uptrend but which are not supported by our indicator which makes lower highs and therefore signals the underlying momentum is failing and so a reversal might occur. Vice versa for downtrend.

I have combined these methods of trading with a Double Smoothed Stochastic. This is similar to Stochastic except for this Indicator we use what is called double exponentially smoothing.

This will give the trader a more speedy response to price changes which tends to smooth out the erratic movements of a regular Stochastic. When combined with spotting Divergence and Convergence signals we get our DSS Divergence Convergence Indicator.

Features :

  • Customizable so the user can input the required size of chart.
  • Can change the color of the chart, arrows and lines.
  • Has choices of which alarms we want to use.
  • Can be traded on any market and timeframe. (I tend to see more accurate signals on larger timeframes such as the 1hr chart)

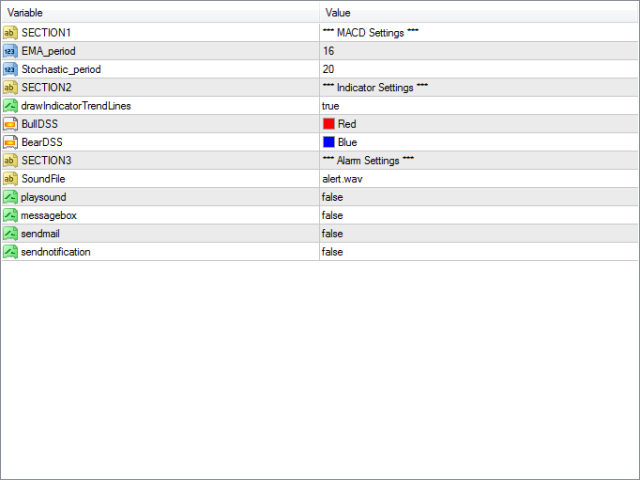
Settings :

MACD Settings

  • EMA Period - EMA settings for smaller chart
  • Stochastic Period - Stochastic settings for smaller chart

Indicator Settings

  • Indicator Trend Lines - if true we see the trend lines, if false we don't see the trendlines.
  • Bull DSS Line Color - Sets color of bull DSS
  • Bear DSS Line Color - Sets color of bear DSS

Alert Settings

  • SoundFile - Sets the wave file used contained within folder program files > mt4 > sounds
  • PlaySound - true means we here our PC alarm, false means we don't hear our PC alarm.
  • MessageBox - true means we see a message box, false means we don't see a message box
  • SendeMail - true means we get an alert sent to our email, false means we don't get an alert sent to our email.
  • SendMobile - true means we get an alert sent to our mobile device, false means we don't get an alarm sent to out mobile device.
Empfohlene Produkte
GTAS STrend
Riviera Systems
4.5 (2)
GTAS S-Trend is a momentum indicator that helps to determine trends using combination of MACD, RSI and moving averages. This indicator was created by Bernard Prats Desclaux, proprietary trader and ex-hedge fund manager, founder of E-Winvest. Description The indicator oscillates between -65 and +65 with a neutral zone between -25 and +25 around a 0 equilibrium line. S-Trend between -25 and +25 indicates congestion zones with a bullish bias between 0 and +25, and a bearish bias between 0 and -25.
FREE
Awesome MACD Indicator
Komang Putra Riswanjaya
5 (1)
AWESOME MACD INDICATOR Awesome MACD Indicator is a powerful trading tool that combines the strengths of Moving Average (MA) and Moving Average Convergence Divergence (MACD) to provide accurate and reliable trading signals. Designed for forex and stock traders, this indicator simplifies the identification of trading opportunities by detecting significant crosses in price movements. Key Features: MA and MACD Combination: Awesome MACD leverages the power of Moving Averages (MA) to identify short-te
FREE
TrueChannel
Aleksey Ivanov
5 (7)
The TrueChannel   indicator shows us the true price movement channels. This indicator resembles Donchian Channel   in its appearance, but is built on the basis of completely different principles and gives (in comparison with Donchian Channel , which is better just to use to assess volatility) more adequate trading signals.              As shown in the article , the price actually moves in channels parallel to the time axis and jumps abruptly from the previous channels to the subsequ
FREE
Introducing the Consecutive Green/Red Candle Alert Indicator for MT4 - Your Trend Spotting Companion! Are you ready to take your trading to the next level? We present the Consecutive Green/Red Candle Alert Indicator, a powerful tool designed to help you spot trends and potential reversals with ease. Whether you're a new trader looking for clarity in the market or an experienced pro seeking additional confirmation, this indicator is your trusted companion. Key Features of the Consecutive Green/Re
FREE
Wolf Wave Pattern Indicator MetaTrader 4 The Wolf Wave Pattern Indicator for MetaTrader 4 is a specialized technical analysis tool designed to detect wave structures within the financial markets. This indicator is particularly effective in identifying the Wolf Wave Pattern, which consists of five distinct geometric waves signaling potential market reversals. By using this indicator, traders can optimize their entry and exit points based on precise pattern recognition. «Indicator Installation & U
FREE
Die Moving Average Convergence Divergence (MACD) Handelsstrategie ist ein beliebtes technisches Analysewerkzeug, das verwendet wird, um Änderungen im Momentum und in der Trendrichtung zu identifizieren. Der MACD wird berechnet, indem man den 26-Perioden-exponentiellen gleitenden Durchschnitt (EMA) vom 12-Perioden-EMA subtrahiert. Eine 9-Perioden-EMA, genannt "Signal Line", wird dann oben auf den MACD geplottet, um als Auslöser für Kauf- und Verkaufssignale zu fungieren. Der MACD wird als bullis
FREE
Th3Eng HistoMaster
Ahmed Farag
4.67 (3)
Th3Eng HistoMaster  indicator Free Histogram Indicator to detect the current trend direction. The indicator is based on CCI indicator. Also draw arrows when it detect the trend is strong buy or strong sell, with Alerting system (Popup with sound, Email alerting and mobile notification). Also draws a dashboard shows all Time-Frames' current signal. Requirements works with all pairs, stocks, CFDs and crypto currencies. works with all Spreads works with all Account types works on all Time-Frames
FREE
Auto Fibo Retracement MT4
Nguyen Tuan Son
3.67 (3)
Auto Fibonacci Retracement Indicator — Flexible and Reliable This is not just another Auto Fibonacci Retracement indicator — it’s one of the most flexible and dependable tools available . If you find it useful, please leave a review or comment to support the project. Looking for something even more powerful? Check out our Timeframes Trend Scanner indicator. Features Automatically calculates up to 7 Fibonacci levels on your customized timeframe. Fully adjustable levels to fit your trading prefer
FREE
The indicator calculates and displays Renko bars using PSAR and CCI data as well as provides buy/sell signals. Renko is a non-trivial price display method. Instead of displaying each bar within a time interval, only the bars where the price moved a certain number of points are shown. Renko bars do not depend on a time interval, therefore the indicator works on any timeframe without losing its efficiency. The buy signal is generated when the CCI indicator crosses the 100 level upwards, and the PS
Wise Men Indicator demo
Bohdan Kasyanenko
3 (2)
The indicator displays signals according to the strategy of Bill Williams on the chart. Demo version of the indicator has the same features as the paid, except that it can work only on a demo account . Signal "First Wise Man" is formed when there is a divergent bar with angulation.  Bullish divergent bar - with lower minimum and closing price in the upper half. Bearish divergent bar - higher maximum and the closing price at the bottom half. Angulation is formed when all three lines of Alligator
FREE
The indicator is designed for intraday trading. Equipped with all notification functions for convenience in manual trading. It is recommended to use timeframes m5, m15, m30. You can also view and select settings for any financial instrument. Settings: Indicator period - Indicator period Alert - The function of enabling alerts. Push notifications - Enabling Push notifications to the mobile terminal e-mail - Sending a signal to e-mail In addition to this product, I recommend looking at my othe
FREE
RSI divergence indicator finds divergences between price chart and RSI   indicator and informs you with alerts (popup, mobile notification or email). Its main use is to find trend reversals in the chart. Always use the divergence indicators with other technical assets like support resistance zones, candlestick patterns and price action to have a higher possibility to find trend reversals. Three confirmation type for RSI   divergences: RSI   line cross 50 level (doesn't repaint) Price returns to
FREE
UPD1 Rsi Dots Dashboard
Vitaliy Kuznetsov
5 (1)
Der Indikator zeigt Signale an, die auf dem Terminal-RSI-Oszillator auf dem Chart basieren. Es ist möglich, wiederholte Signale herauszufiltern. Hier wird der Oszillator verwendet, um nach einem umgekehrten Signal zu suchen. Es wird als Einstiegspunkt in Swing-Strategien und den Handel von Levels empfohlen. Ein Dashboard mit mehreren Währungen ist verfügbar. Damit können Sie problemlos zwischen Diagrammen wechseln. In Produktdiskussionen können Sie einen Algorithmus vorschlagen, in den Sie ei
FREE
Double Fibonacci
Fabio Mazzotta
5 (1)
Fibonacci will be designed by default based on the monthly candle but you can simultaneously view Fibonacci on a weekly candle or you can choose your two favorite timeframes. When you run this script, an input prompt will appear and the following input parameters can be configured: Input Parameters: Name Example Default Timeframe1 Monthly 43200 Timeframe2 Weekly 10080 TF1status 1 on 1 TF2status 0 off 0 candleID you can choose which candle to apply 1 Prefix1 It's is the prefix of the first object
FREE
With the MACD Multi Time Frame indicator, you can spot divergences of higher timeframes while you are searching for pinpointed entries on lower timeframes. This FREE version of the indicator works only on EURUSD and GBPUSD. The full version of the indicator can be found here: MACD Multi Time Frame This blog post gives you REAL-TIME MACD Divergence Analysis for FREE and tips how to trade the divergences: REAL-TIME MACD Divergence Analysis The MACD Multi Time Frame gives you a very good overview o
FREE
Divergence Reader - индикатор который поможет Вам идентифицировать на графике дивергенцию и конвергенцию. Настройки Type - выбор типа сигнала (дивергенция, конвергенция, оба сигнала); Minimum length of divergence (Candle) - минимальная длинна сигнала (в свечах); MACD SETTINGS - настройки индикатора МАСD; Важно! Индикатор не рисует графику на истории! Для визуальной проверки индикатора рекоммендую использовать тестер.
FREE
PZ The Zone
PZ TRADING SLU
4.33 (3)
This indicator displays buy or sell signals according to Bill Williams' definition of the Trading Zone. [ Installation Guide | Update Guide | Troubleshooting | FAQ | All Products ] Easy to use and understand Avoid trading flat markets Deterministic indicator with clear rules The indicator is non-repainting It implements alerts of all kinds It has straightforward trading implications. A blue arrow is a buy signal A red arrow is a sell signal According to Bill Williams trading in the zone helps to
FREE
Pulse Indicator
Igor Kryuchkov
3.83 (6)
This indicator is suitable for trading Forex and Binary Options, depending on its settings. The indicator is designed for trend trading. A buy signal: An up arrow appears on the chart. A sell signal: A down arrow appears on the chart. Input parameters === Setup CCI === Period CCI 1 - Period of the CCI Period CCI 2 - Period of the CCI Level BUY - Level of the CCI for buying Level SELL - Level of the CCI for selling === Setup RSI === Level SELL - Level of the RSI for selling Period SELL - Period
FREE
Investment Castle RSI Divergence
Ahmed Alaaeldin Abdulrahman Ahmed Elherzawi
The RSI Divergence Indicator is a powerful tool designed to identify potential reversals in the market by spotting discrepancies between the Relative Strength Index (RSI) and price movement. Divergences can be a significant indication of an impending trend change, either from bullish to bearish or vice versa. This indicator is built for making the task of identifying potential trade opportunities more straightforward and efficient. Features: Automatic Detection: The indicator scans the chart f
FREE
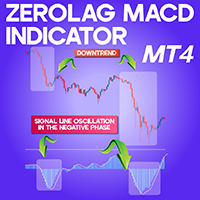
Zerolag MACD indicator MT4 The Zerolag MACD indicator offers a refined alternative to the traditional MACD, designed for enhanced responsiveness. By minimizing latency in its signal calculations, this tool empowers traders to act swiftly, especially in volatile market conditions. While it preserves the foundational components of the original MACD—such as signal line, histogram, and moving averages—it delivers them with improved speed and precision. «Indicator Installation & User Guide» MT4 Indi
FREE
MACD Trend EA
Lachezar Krastev
4.5 (2)
MACD Trend EA is based on the popular forex indicator MACD (Moving Average Convergence Divergence). It is fully automated trading expert advisor and completely FREE!  As the name suggests, this expert advisor uses a trend-following strategy and uses the MACD indicator to detect the beginning of uptrends and downtrends. MACD Trend EA Top Features - Trend Following Strategy - Money Management - Advanced Exit System + TP and SL  - Trailing Stop System - Broker protection System - Custom Magic Re
FREE
The indicator calculates and displays renko bars using MA and PSAR data as well as provides buy/sell signals. Renko is a non-trivial price display method. Instead of displaying each bar within a time interval, only the bars where the price moved a certain number of points are shown. Renko bars do not depend on a time interval, therefore the indicator works on any timeframe without losing its efficiency. Buy signal forms when PSAR readings are moving down, MA is moving up, the price is closing ab
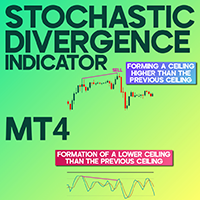
Stochastic Divergence Indicator MetaTrader 4 The Stochastic Divergence Indicator for MetaTrader 4 automatically identifies divergences between the price chart and the Stochastic Oscillator, displaying entry signals directly on the chart. This MetaTrader 4 oscillator highlights detected divergences using blue and pink lines. «Indicator Installation & User Guide» MT4 Indicator Installation  |  Stochastic Divergence Indicator for MT5 | ALL Products By  TradingFinderLab  | Best MT4 Indicator:  Refin
FREE
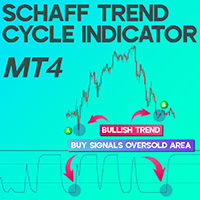
Schaff Trend Cycle Indicator for MetaTrader4 The Schaff Trend Cycle Indicator for MetaTrader4 merges the core functionalities of two widely used indicators—MACD (Moving Average Convergence Divergence) and the Stochastic Oscillator. This tool is engineered to identify trend reversals and momentum extremes with enhanced sensitivity. Readings below 25 often signal an oversold market, while values above 75 highlight overbought conditions. This makes the STC highly reliable for early trend recognitio
FREE
RSI TrendLine Divergency Message is an indicator for the MetaTrader 4 trading platform. Unlike the original indicator, this three in one version has a system of alerts that inform on market situation changes. It consists of the following signals: when the Main line crosses the levels of extreme zones and 50% level; when the Main line crosses the Trend line in the indicator window; divergence on the last bar. Parameters of levels of extremum, 50-level and divergence are adjustable. Parameters La
Divergence Convergence MACD is based on the classical divergence and convergence methods of charting. Divergence is when we get higher highs and lower lows on our uptrend but which are not supported by our indicator which makes lower highs and therefore signals the underlying momentum is failing and so a reversal might occur. Vice versa for downtrend. Convergence is when the higher highs and higher lows of an uptrend are also confirmed by our indicator making lower lows which helps us confirm th
FREE
This indicator is based on Guppy's GMMA Strategy. And shows arrows when GMMA lines cross up or down. To have this indicator and get alerts for Multiple Timeframes and multiple Pairs you can check out the demo of this GMMA Trend Scanner indicator: https://www.mql5.com/en/market/product/38747 About GMMA In Brief: GMMA attempts to identify trends by combining two groups of moving averages with differing time periods: The long-term EMAs (30, 35, 40, 45, 50, and 60) the behaviors of investors that h
FREE
Pro Support Resistance
Suvashish Halder
4.8 (5)
This is the best Support and Resistance Indicator on the market, and it shows both confirmed Support and Resistance as well as Retests. Support & Resistance: Support marks where buying demand halts price declines, acting as a safety net. Resistance caps price surges, driven by selling pressure. Traders leverage these levels to predict reversals, plan entries, exits, and manage risks, making them trading's fundamental guideposts. Join To Learn Market Depth -   https://www.mql5.com/en/channels/suv
FREE
This indicator is a perfect tool able to compare which brokers have the lower latency. It shows us immediately which brokers are slower or faster. When you see the dot icon on the line, it means this broker is the faster one and the red line (Broker_A) is the slower one. See the example on the screenshot. How It Works? This indicator shares the prices information to and from the "shared" common data folder. It compares all the prices. The price is based on average by (Ask + Bid) / 2. There are
FREE
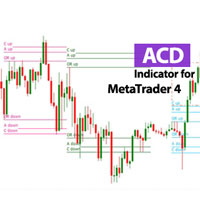
ACD Indicator for MetaTrader 4 The ACD indicator, developed by Mark Fisher, is a technical analysis tool in MetaTrader 4 used to detect potential market trends and assess trend strength. The ACD system is built around identifying the market’s Opening Range (OR) and using it to establish key trading levels. This range typically includes the first 30 minutes to one hour of market activity. After defining the OR, traders identify levels A and C, derived from it, to guide trading decisions. These le
FREE
Käufer dieses Produkts erwarben auch
M1 Sniper
Oleg Rodin
5 (7)
M1 SNIPER ist ein benutzerfreundliches Handelsindikatorsystem. Es handelt sich um einen Pfeilindikator, der für den M1-Zeitrahmen entwickelt wurde. Der Indikator kann als eigenständiges System für Scalping im M1-Zeitrahmen oder als Teil Ihres bestehenden Handelssystems verwendet werden. Obwohl dieses Handelssystem speziell für den M1-Zeitrahmen entwickelt wurde, kann es auch für andere Zeitrahmen verwendet werden. Ursprünglich habe ich diese Methode für den Handel mit XAUUSD und BTCUSD entwickel
Gann Made Easy
Oleg Rodin
4.81 (133)
Gann Made Easy ist ein professionelles und einfach zu bedienendes Forex-Handelssystem, das auf den besten Handelsprinzipien unter Verwendung der Theorie von Mr. basiert. W.D. Gann. Der Indikator liefert genaue KAUF- und VERKAUFSsignale, einschließlich Stop-Loss- und Take-Profit-Levels. Mit PUSH-Benachrichtigungen können Sie auch unterwegs handeln. Bitte kontaktieren Sie mich nach dem Kauf! Ich werde meine Handelstipps und tolle Bonusindikatoren kostenlos mit Ihnen teilen! Wahrscheinlich haben Si
Scalper Inside PRO
Alexey Minkov
4.74 (66)
An exclusive indicator that utilizes an innovative algorithm to swiftly and accurately determine the market trend. The indicator automatically calculates opening, closing, and profit levels, providing detailed trading statistics. With these features, you can choose the most appropriate trading instrument for the current market conditions. Additionally, you can easily integrate your own arrow indicators into Scalper Inside Pro to quickly evaluate their statistics and profitability. Scalper Inside
Trend indicator AI
Ramil Minniakhmetov
5 (5)
Trend Ai Indicator ist ein großartiges Tool, das die Marktanalyse eines Händlers verbessert, indem Trendidentifikation mit umsetzbaren Einstiegspunkten und Umkehrwarnungen kombiniert wird. Dieser Indikator ermöglicht es Benutzern, die Komplexität des Forex-Marktes mit Zuversicht und Präzision zu navigieren Über die primären Signale hinaus identifiziert der Trend Ai-Indikator sekundäre Einstiegspunkte, die bei Pullbacks oder Retracements auftreten, sodass Händler von Preiskorrekturen innerhalb d
Algo Pumping MT4
Ihor Otkydach
4.92 (13)
PUMPING STATION – Ihre persönliche „All-inclusive“-Strategie Wir präsentieren Ihnen PUMPING STATION – einen revolutionären Forex-Indikator, der Ihr Trading in eine spannende und effektive Erfahrung verwandeln wird. Es handelt sich nicht nur um ein Hilfsmittel, sondern um ein vollwertiges Handelssystem mit leistungsstarken Algorithmen, die Ihnen helfen, stabiler zu traden. Beim Kauf dieses Produkts erhalten Sie KOSTENLOS: Exklusive Set-Dateien: Für automatische Einrichtung und maximale Leistung.
Cycle Maestro
Stefano Frisetti
1 (1)
HANDEL mit CYCLEMAESTRO Das Signal ist einfach und unmittelbar: Sobald der Hintergrund eines Bereichs grün oder rot wird, bedeutet dies, dass ein Handelssignal aktiv ist: GRÜN = KAUFEN und ROT = VERKAUFEN. Der HÄNDLER kann den HANDEL eröffnen und den nächsten Anweisungen folgen.  HINWEIS: CYCLEMAESTRO wird nur über diese Website vertrieben, es gibt keine anderen Vertriebshändler. Die DEMO-Version dient nur als Referenz und wird nicht unterstützt. Die endgültige Version wird unterstützt und f
Trend Screener
STE S.S.COMPANY
4.79 (95)
Trendindikator, bahnbrechende, einzigartige Lösung für Trendhandel und -filterung mit allen wichtigen Trendfunktionen in einem Tool! Es handelt sich um einen 100 % nicht neu zu malenden Multi-Timeframe- und Multi-Währungs-Indikator, der für alle Symbole/Instrumente verwendet werden kann: Forex, Rohstoffe, Kryptowährungen, Indizes und Aktien. ZEITLICH BEGRENZTES ANGEBOT: Der Support- und Resistance-Screener-Indikator ist für nur 50 $ und lebenslang verfügbar. (Ursprünglicher Preis 250 $) (Angebot
Daily Candle Predictor ist ein Indikator, der den Schlusskurs einer Kerze vorhersagt. Der Indikator ist in erster Linie für die Verwendung in D1-Charts gedacht. Dieser Indikator eignet sich sowohl für den traditionellen Devisenhandel als auch für den Handel mit binären Optionen. Der Indikator kann als eigenständiges Handelssystem oder als Ergänzung zu Ihrem bestehenden Handelssystem verwendet werden. Dieser Indikator analysiert die aktuelle Kerze und berechnet bestimmte Stärkefaktoren innerhalb
PRO Renko System ist ein hochpräzises Handelssystem, das speziell für den Handel mit RENKO-Charts entwickelt wurde. Dies ist ein universelles System, das auf verschiedene Handelsinstrumente angewendet werden kann. Das System neutralisiert effektiv so genannte Marktgeräusche, die Ihnen Zugang zu genauen Umkehrsignalen geben. Der Indikator ist sehr einfach zu bedienen und hat nur einen Parameter, der für die Signalerzeugung verantwortlich ist. Sie können das Tool einfach an jedes Handelsinstrum
Derzeit 20% Rabatt! Die beste Lösung für jeden Neueinsteiger oder Expert Händler! Dieses Dashboard arbeitet mit 28 Währungspaaren. Es basiert auf 2 unserer Hauptindikatoren (Advanced Currency Strength 28 und Advanced Currency Impulse). Es bietet einen hervorragenden Überblick über den gesamten Forex-Markt. Es zeigt die Werte der Advanced Currency Strength, die Veränderungsrate der Währungen und die Signale für 28 Devisenpaare in allen (9) Zeitrahmen. Stellen Sie sich vor, wie sich Ihr Handel
Easy Breakout
Mohamed Hassan
5 (12)
After your purchase, feel free to contact me for more details on how to receive a bonus indicator called VFI, which pairs perfectly with Easy Breakout for enhanced confluence!   Easy Breakout is a powerful price action trading system built on one of the most popular and widely trusted strategies among traders: the Breakout strategy ! This indicator delivers crystal-clear Buy and Sell signals based on breakouts from key support and resistance zones. Unlike typical breakout indicators, it levera
Scalper Vault
Oleg Rodin
5 (33)
Scalper Vault ist ein professionelles Scalping-System, das Ihnen alles bietet, was Sie für erfolgreiches Scalping benötigen. Dieser Indikator ist ein komplettes Handelssystem, das von Forex- und Binäroptionshändlern verwendet werden kann. Der empfohlene Zeitrahmen ist M5. Das System liefert Ihnen genaue Pfeilsignale in Richtung des Trends. Es liefert Ihnen auch Top- und Bottom-Signale und Gann-Marktniveaus. Die Indikatoren bieten alle Arten von Warnungen, einschließlich PUSH-Benachrichtigungen.
Dynamic Forex28 Navigator
Bernhard Schweigert
5 (5)
Dynamic Forex28 Navigator – Das Forex-Handelstool der nächsten Generation AKTUELL 49 % RABATT. Dynamic Forex28 Navigator ist die Weiterentwicklung unserer seit langem beliebten Indikatoren und vereint die Leistung von drei in einem: Advanced Currency Strength28 Indicator (695 Bewertungen) + Advanced Currency IMPULSE mit ALERT (520 Bewertungen) + CS28 Combo Signals (Bonus) Details zum Indikator https://www.mql5.com/en/blogs/post/758844 Was bietet der Strength Indicator der nächsten Generation?
Gold Stuff
Vasiliy Strukov
4.85 (262)
Gold Stuff-Ein Trendindikator, der speziell für Gold entwickelt wurde, kann auch auf allen Finanzinstrumenten verwendet werden. Der Indikator wird nicht neu gezeichnet und verzögert sich nicht. Empfohlener Zeitrahmen H1. Nach diesem Indikator geschrieben EA Gold Stuff Berater, können Sie es in meinem Profil finden. WICHTIG! Kontaktieren Sie mich sofort nach dem Kauf, um Anweisungen und Bonus zu erhalten!   Sie können eine kostenlose Kopie unseres Strong Support- und Trendscanner-Indikators er
RelicusRoad Pro
Relicus LLC
4.63 (105)
Wie oft haben Sie schon einen Trading-Indikator mit großartigen Backtests, Nachweisen der Live-Kontoleistung mit fantastischen Zahlen und überall Statistiken gekauft, aber nachdem Sie ihn verwendet haben, sprengen Sie Ihr Konto? Sie sollten einem Signal nicht einfach so vertrauen, Sie müssen wissen, warum es überhaupt erschienen ist, und das ist es, was RelicusRoad Pro am besten kann! Benutzerhandbuch + Strategien + Schulungsvideos + Private Gruppe mit VIP-Zugang + Mobile Version verfügbar Ein
TPSpro RFI Levels
Roman Podpora
4.85 (27)
Umkehrzonen / Spitzenvolumina / Aktive Zonen eines Hauptakteurs =       TS TPSPROSYSTEM ANLEITUNG RUS       /       ANWEISUNGEN       ENG              /          Version MT5 Jeder Käufer dieses Indikators erhält zusätzlich KOSTENLOS: 6 Monate Zugriff auf Handelssignale vom Dienst RFI SIGNALS – vorgefertigte Einstiegspunkte gemäß dem TPSproSYSTEM-Algorithmus. Schulungsmaterialien mit regelmäßigen Updates – tauchen Sie in die Strategie ein und steigern Sie Ihr berufliches Niveau. 24/5-Support an
System Trend Pro
Aleksandr Makarov
5 (2)
Special offer! https://www.mql5.com/ru/users/bossik2810 System Trend Pro - This is the best trend trading indicator!!! The indicator no repaint!!!  The indicator has   MTF   mode, which adds confidence to trading on the trend (   no repaint   ). How to trade? Everything is very simple, we wait for the first signal (big arrow), then wait for the second signal (small arrow) and enter the market in the direction of the arrow. (See screens 1 and 2.) Exit on the opposite signal or take 20-30 pips,
FX Volume
Daniel Stein
4.6 (35)
FX Volume: Erleben Sie den echten Marktüberblick aus der Sicht eines Brokers Kurzüberblick Möchten Sie Ihre Handelsstrategie auf das nächste Level bringen? FX Volume liefert Ihnen Echtzeit-Einblicke in die Positionierung von Retail-Tradern und Brokern — lange bevor verzögerte Berichte wie der COT verfügbar sind. Ob Sie nach beständigen Gewinnen streben oder einfach einen tieferen Vorteil am Markt suchen, FX Volume hilft Ihnen, große Ungleichgewichte zu erkennen, Breakouts zu bestätigen und Ihr
M1 Arrow
Oleg Rodin
5 (19)
Eine Intraday-Strategie, die auf zwei Grundprinzipien des Marktes basiert. Der Algorithmus basiert auf der Analyse von Volumina und Preiswellen mit zusätzlichen Filtern. Der intelligente Algorithmus des Indikators gibt nur dann ein Signal, wenn sich zwei Marktfaktoren zu einem vereinen. Der Indikator berechnet Wellen eines bestimmten Bereichs auf dem M1-Diagramm unter Verwendung der Daten des höheren Zeitrahmens. Und um die Welle zu bestätigen, verwendet der Indikator eine Volumenanalyse. Dieser
FX Power MT4 NG
Daniel Stein
4.94 (18)
FX Power: Analysieren Sie die Stärke von Währungen für intelligentere Handelsentscheidungen Übersicht FX Power ist Ihr unverzichtbares Werkzeug, um die tatsächliche Stärke von Währungen und Gold unter allen Marktbedingungen zu verstehen. Indem Sie starke Währungen kaufen und schwache verkaufen, vereinfacht FX Power Ihre Handelsentscheidungen und deckt Chancen mit hoher Wahrscheinlichkeit auf. Ob Sie Trends folgen oder extreme Delta-Werte nutzen, um Umkehrungen zu prognostizieren, dieses Tool p
Volatility Trend System – ein Handelssystem, das Signale für Einstiege gibt. Das Volatilitätssystem liefert lineare und punktuelle Signale in Richtung des Trends sowie Signale zum Verlassen des Trends, ohne Neuzeichnung und Verzögerungen. Der Trendindikator überwacht die Richtung des mittelfristigen Trends, zeigt die Richtung und deren Änderung an. Der Signalindikator basiert auf Änderungen der Volatilität und zeigt Markteintritte an. Der Indikator ist mit mehreren Arten von Warnungen ausgestat
GoldRush Trend Arrow Signal Der GoldRush Trend Arrow Signal Indikator bietet präzise Echtzeit-Trendanalysen, die speziell auf schnelle, kurzfristige Scalper im XAU/USD zugeschnitten sind. Dieses Tool wurde speziell für den 1-Minuten-Zeitrahmen entwickelt und zeigt Richtungspfeile für klare Einstiegspunkte an, sodass Scalper sich sicher in volatilen Marktbedingungen bewegen können. Der Indikator besteht aus PRIMÄREN und SEKUNDÄREN Warnpfeilen. Die PRIMÄREN Signale sind weiße und schwarze Rich
Bermaui Bands
Muhammad Elbermawi
4.97 (67)
Bermaui Bands (BB) ist ein technisches Analysetool, das dabei hilft, zwischen Bereichs- und Trendkursbewegungen zu filtern. Die Idee hinter diesem Indikator lässt sich in den nächsten Schritten erklären: Berechnen Sie die Standardabweichung als Oszillator, der sich zwischen 0 und 100 bewegt. Ich nenne sie Bermaui-Abweichung in Prozent (BD %). Wenn "BD %" nahe Null ist, ist die Volatilität am höchsten. Außerdem ist die Volatilität sehr gering, wenn "BD %" nahe 100 liegt. Hohe Volatilität bedeutet
IQ Gold Gann Levels a non-repainting, precision tool designed exclusively for XAUUSD/Gold intraday trading. It uses W.D. Gann’s square root method to plot real-time support and resistance levels, helping traders spot high-probability entries with confidence and clarity. William Delbert Gann (W.D. Gann) was an exceptional market analyst, whose trading technique was based on a complex blend of mathematics, geometry, astrology, and ancient mathematics which proved to be extremely accurate. Download
True Direction Oscillator
Muhammad Elbermawi
4.86 (361)
Oder (TDO), ein Index, der die Preisänderungsrate nach dem Prinzip des „ Pure Momentum “ misst. Wenn ein Wertpapierkurs von 10 auf 15 steigt, beträgt die Preisänderungsrate 150%, aber wenn er von 15 auf 10 zurückgeht, beträgt die Preisänderungsrate nur 33,3%. Aus diesem Grund liefern Indikatoren der technischen Analyse wie "Price Rate of Change" (ROC) oder "Momentum" höhere Werte für aufsteigende Kursbewegungen als solche für absteigende. TDO behebt dieses Problem, um Händlern zu helfen, das Mom
Currency Strength Wizard ist ein sehr leistungsstarker Indikator, der Ihnen eine Komplettlösung für erfolgreichen Handel bietet. Der Indikator berechnet die Stärke dieses oder jenes Forex-Paares anhand der Daten aller Währungen in mehreren Zeitrahmen. Diese Daten werden in Form von benutzerfreundlichen Währungsindizes und Währungsstärkelinien dargestellt, anhand derer Sie die Stärke dieser oder jener Währung erkennen können. Sie müssen lediglich den Indikator an das Diagramm anhängen, mit dem Si
Special offer : ALL TOOLS , just $35 each! New tools   will be   $30   for the   first week   or the   first 3 purchases !  Trading Tools Channel on MQL5 : Join my MQL5 channel to update the latest news from me Wir stellen den revolutionären RSI Kernel Optimized with Scanner, ein hochmodernes Tool, das die traditionelle RSI-Analyse durch die Integration des leistungsstarken Kernel-Density-Estimation-Algorithmus (KDE) neu definiert. Dieser fortschrittliche Indikator bietet nicht nur Echtzeiteinb
MetaBands M4
Vahidreza Heidar Gholami
3.4 (5)
MetaBands verwendet leistungsstarke und einzigartige Algorithmen, um Kanäle zu zeichnen und Trends zu erkennen, sodass es Tradern potenzielle Punkte für den Einstieg und Ausstieg aus Trades bieten kann. Es ist ein Kanalindikator sowie ein leistungsstarker Trendindikator. Es umfasst verschiedene Arten von Kanälen, die einfach durch Verwendung der Eingabeparameter zusammengeführt werden können. MetaBands verwendet alle Arten von Warnmeldungen, um Benutzer über Marktereignisse zu informieren. Funkt
Hydra Trend Rider is a non-repainting, multi-timeframe trend indicator that delivers precise buy/sell signals and real-time alerts for high-probability trade setups. With its color-coded trend line, customizable dashboard, and mobile notifications, it's perfect for traders seeking clarity, confidence, and consistency in trend trading. Download the Metatrader 5 Version Read the User Manual here. HURRY!   FLASH SALE is  ON . Price  increasing soon! Read the product description carefully before pur
Automated Trendlines
Georgios Kalomoiropoulos
5 (17)
Trendlinien sind das wichtigste Werkzeug der technischen Analyse im Devisenhandel. Leider zeichnen die meisten Händler sie nicht richtig. Der automatische Trendlinien-Indikator ist ein professionelles Tool für ernsthafte Trader, das Ihnen hilft, die Trendbewegung der Märkte zu visualisieren. Es gibt zwei Arten von Trendlinien Bullische Trendlinien und Bärische Trendlinien. Im Aufwärtstrend wird die Forex-Trendlinie durch die niedrigsten Swing-Punkte der Preisbewegung gezogen. Wenn man mindest
Weitere Produkte dieses Autors
Trend Line Finder MT5
Stephen Reynolds
5 (2)
Der Trend Line Finder projiziert eine Unterstützungs- und Widerstandslinie nach vorne, indem er 2 frühere Hochs für den Widerstand und 2 frühere Tiefs für die Unterstützung verwendet, und signalisiert dem Händler durch einen Alarm, dass eine mögliche gute Bewegung bevorsteht. Es handelt sich hierbei nicht um ein eigenständiges Handelssystem, aber es ist sehr nützlich, um Schlüsselbereiche von Unterstützungs- und Widerstandsniveaus zu finden, an denen der Kurs in der Regel entweder abprallen ode
FREE
ZZ Scalper MT5
Stephen Reynolds
1 (1)
Dieser EA nutzt das unvermeidliche Verhalten von Kursschwankungen und Ausbrüchen aus. Da die Marktpreise immer zu höheren Höchstständen schwanken, bevor sie zu niedrigeren Tiefstständen abklingen, wird es zu Ausbrüchen aus diesen Niveaus kommen. Dieser EA eröffnet einen Handel in der Erwartung, einen Teil der Gewinne aus diesen Ausbruchsbewegungen abzugreifen. Wir verwenden die festen Ausstiegsmethoden Stop Loss, Take Profit und Trailing Stop so, dass wir kleine, aber beständige Gewinne abgreif
FREE
ZZ Scalper
Stephen Reynolds
4 (1)
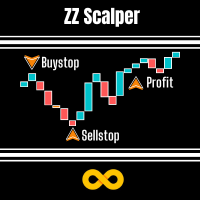
This EA exploits the inevitable behaviour of price fluctuations and breakouts. Because market prices will always fluctuate to higher highs before ebbing down to lower lows, breakouts of these levels will occur.   This EA will open a trade in anticipation of catching some of the profits from these breakout moves. We use the fixed exit methods of Stop Loss, Take Profit and Trailing Stop in such a way so that we will scalp small but consistent profits.  No martingales needed, just a simple but ex
FREE
Break Even Trader MT5
Stephen Reynolds
4.5 (2)
Wenn der Break Even Trader auf Ihrem Chart platziert wird, platziert er automatisch die Stop-Loss- und Take-Profit-Levels, wenn Sie einen Kauf- oder Verkaufsauftrag eröffnen. Und wenn Sie den in den Benutzereinstellungen definierten Gewinn erreicht haben, wird der Stop-Loss automatisch auf dieses Break-Even-Niveau verschoben, wodurch Ihr Handel vor Verlusten geschützt wird. Eigenschaften: Einfacher Handel: Sie müssen nur Ihren Handel eingeben, und das Programm platziert den Stop-Loss und den Ta
FREE
Fractal Scalper
Stephen Reynolds
Diese Handelsmethode ist inspiriert von Linda Bradford Raschkes 3 Little Indians Muster. Vereinfacht ausgedrückt gehen wir davon aus, dass sich der Kurs einer projizierten Linie nähern wird, die auf 2 vorhergehenden Fraktalen basiert. Wenn 2 frühere obere Fraktale auftreten, zeichnen wir eine obere Linie, die nach vorne projiziert wird. Wenn sich der aktuelle Kurs dieser Linie nähert, gehen wir davon aus, dass sich der Kurs weiter auf die Linie zubewegt und diese durchbricht, so dass wir kauf
FREE
Trend Line Finder
Stephen Reynolds
5 (1)
Trend Line Finder will project forward a support and resistance lines using 2 previous highs for resistance and 2 previous lows for support.  It will then signal to the trader by alert making the trader more aware that a possible good move is about to happen.     This is not a stand-alone trading system but is very useful in finding key areas of support resistance levels where price will usually either rebound from or breakthrough. Its down to the trader to decide what to do with use of other s
FREE
Der Bollinger Breakout Trader zeigt dem Händler an, wenn der Markt kurz vor einem Ausbruch aus einer nicht volatilen Phase steht. Nicht-Volatilität bedeutet in der Regel, dass der Markt Dampf für weitere gute Bewegungen in der Zukunft aufbaut. Ein Signal wird gebildet, wenn dieser Wechsel von nicht volatil zu volatil erfolgt. Diese Perioden werden sowohl durch Bollinger Bänder als auch durch Keltner-Kanäle gemessen. Bollinger Bänder messen die Standardabweichung des Preises vom gleitenden Durch
FREE
Der Hi Lo Breakout basiert auf dem Konzept des ZZ Scalper EA, der sich das unvermeidliche Verhalten von Kursschwankungen und Ausbrüchen zunutze macht. Die Tatsache, dass die Marktpreise immer zu höheren Höchstständen schwanken, bevor sie zu niedrigeren Tiefstständen abebben, führt zu Ausbrüchen. Aber hier habe ich ein paar weitere Filter hinzugefügt, die meiner Meinung nach auch als Indikator gut funktionieren. Bereichsanalyse: Wenn sich der Kurs innerhalb einer engen Spanne befindet, kann di
FREE
MA & DSS Oscillator ist ein einfaches System, das alle Marktverwirrungen überwindet, indem es den gleitenden Durchschnitt und den doppelt geglätteten stochastischen Oszillator betrachtet. Ein Signal wird ausgelöst, wenn der Oszillator unter 50 liegt (ein Standardwert) und sich in dieselbe Richtung wie der gleitende Durchschnitt bewegt. Der gleitende Durchschnitt ist wohl das einfachste, aber effektivste Instrument beim Handel mit größeren Zeitrahmen. Wir verwenden diesen und den Double Smoothe
FREE
Elliot's Triangle is taken from 1 of the 13 patterns within the Elliot Wave Theory that says social or crowd behaviour tends to reverse in recognisable patterns and of which they reveal a structural pattern that appears in nature, as well as the mass psychology of trading participants. From this, he has devised various identifiable patterns that appear in market prices. One of these is what I have named Elliot's Triangle. This triangular pattern appears to reflect a balance of forces, causing
FREE
Zig Zag 123
Stephen Reynolds
Zig Zag 123 tells us when a reversal or continuation is more likely by looking at the shift in supply and demand. When this happens a signature pattern appears known as 123 (also known ABC) will often break out in direction of higher low or lower high. Stop loss and take profit levels have been added. There is a panel that shows the overall performance of your trades for if you was to use these stop loss and take profit levels.  We get alerted if a pattern 123 appears and also if the price re
FREE
Der Volume Analysis Trader betrachtet das Volumen anhand eines festen Durchschnittswerts des Volumens. Diese Durchschnittsbildung hilft dabei, zu erkennen, wann das Volumen steigt oder sinkt. Außerdem habe ich Volumenspitzen hinzugefügt, die auftreten, wenn das Volumen plötzlich über dem Durchschnitt liegt. Diese helfen, Marktumkehrungen zu erkennen. Dies hilft einem Händler, beim Handel auf Folgendes zu achten: Steigendes Volumen während einer Rallye zeigt, dass der Trend stark ist. Ein sink
FREE
Break It Down
Stephen Reynolds
4.33 (3)
Break It Down is based on the Directional Movement Index and tells the trader when a market trend probably maxed out and ready to fall back. This pattern is more predictable when we apply this system only when the market is rallying but within a trading range. Because traders Sell off in fear the market often moves faster when declining! When this happens, good moves can occur. As traders are no longer interested in the trend, the volume will decline and the price will usually fall back on itsel
FREE
The Hidden Gap
Stephen Reynolds
Dieser EA basiert auf den Indice Gaps zwischen dem heutigen Eröffnungskurs und dem Schlusskurs vom Vortag. Auf Metatrader werden diese nicht angezeigt, da wir nur einen 24-Stunden-Chart sehen. Wenn wir die Lücke zwischen dem Eröffnungskurs um 16:30 Uhr und dem gestrigen Schlusskurs um 23:30 Uhr beim SP500 wissen wollen, wird dieser EA die Lücke aufdecken. Bei Indizes schließen sich diese Arten von Gaps in etwa 60 % der Fälle noch am selben Tag. Dies wird auf dem Panel angezeigt, das frühere Gap
FREE
Der Midnight Scalper basiert auf einem soliden Handelsprinzip. Er wurde entwickelt, um zu Zeiten zu handeln, in denen der Markt eine geringe Volatilität aufweist. Am besten ist die Zeit von 23:00 bis 00:00 Uhr. Der Midnight Scalper verwendet mehrere Indikatoren für präzise Ein- und Ausstiege mit einem festen Stop-Loss und Take-Profit als Teil seiner Money-Management-Strategie und setzt Ihr Kapital nicht durch Methoden wie Martingale, Grid, Averaging-Positionen oder Handel ohne Stop-Loss einem ho
FREE
Ein System mit stetigem ROI > 10% pro Monat wie ein Uhrwerk! Die Hi-Lo-Breakout-Strategie eröffnet und schließt Trades auf der Grundlage der Tageszeit im Verhältnis zu den Höchst- und Tiefstkursen des gestrigen und heutigen Tages. Diese Preise werden dann unter Verwendung der Handelsmanagementeinstellungen in den Benutzereingaben gehandelt. Für beste Ergebnisse siehe .set-Datei unter Kommentar Nr. 2 . Merkmale: Ein rein mechanisches System. Einfach einstellen und loslegen. Kein Martingal oder
FREE
Triple X Scalper
Stephen Reynolds
Triple X Scalper is based on 3 types of triangular price patterns along with some volume analysis. It also must be traded at the times in day when the market is most active. The method is inspired by some of Linda Bradford Raschke's trading techniques.  The 3 price patterns are as follows :  System 1 Inside Bar = Looks for a volume spike followed by the inside bar formation. Also known as my indicator 3 Bar Break.  System 2 Triangle by Fractal = Looks for when the 2 previous highest and lowes
FREE
Die doppelt geglättete Stochastik ähnelt der Stochastik, mit dem Unterschied, dass wir bei diesem Indikator die sogenannte doppelt exponentielle Glättung verwenden. Dadurch erhält der Händler eine schnellere Reaktion auf Preisänderungen, wodurch die erratischen Bewegungen einer normalen Stochastik geglättet werden. Doppelt geglättete Stochastik-Berechnung ist : DSS = EMA(r) (X - Lxn / Hxn - Lxn) x 100 MIT = EMA(r) (Schluss - Ln / Hn - Ln) x 100 Ln = niedrigster Tiefststand von n Perioden Hn
FREE
Dieser Indikator basiert auf den Indice Gaps zwischen dem heutigen Eröffnungskurs und dem Schlusskurs des Vortages. Im Metatrader werden diese nicht angezeigt, da wir nur einen 24-Stunden-Chart sehen. Wenn wir die Lücke zwischen dem Eröffnungskurs um 16:30 Uhr und dem gestrigen Schlusskurs um 23:30 Uhr beim SP500 wissen wollen, wird dieser EA die Lücke aufzeigen. Bei Indizes schließen sich diese Arten von Gaps in etwa 60 % der Fälle noch am selben Tag. Dies wird auf dem Panel angezeigt, das frü
FREE
The Triangular Breakout looks for when there is a volume spike followed by a 3 bar break. It then draws arrow when price breaks out of the recent high or low of the 3 bar pattern. We also look for triangles that form when price fractals converge. It also will draw arrows when price breaks out of the recent high or low of this triangle pattern. There are alerts set for when either we get a 3 bar break or triangle or when we get an arrow.   According to DOW theory triangles are really moments
FREE
Trendy Trader EA
Stephen Reynolds
In the trading world a golden rule that stuck with me is "hold on to your winners and cut your losers short". This golden rule is how this EA gains a positive advantage.  The EA is based on the indicator Trendy Trader. As stated unlike a standard moving average this unique algorithm will show you a less choppy signal resulting in a smoother and easier trend to follow. Put simply when price moves above the average it signals a bullish trend and when price moves below the average it signals a b
FREE
Three Bar Break basiert auf einer Handelsmethode von Linda Bradford Raschke, die meiner Meinung nach gut geeignet ist, potenzielle künftige Kursschwankungen zu erkennen. Sie sucht nach Situationen, in denen das Hoch des ersten Balkens niedriger als das Hoch des dritten Balkens ist und das Tief des ersten Balkens höher als das Tief des dritten Balkens ist. Dies sagt dann voraus, dass der Markt innerhalb der nächsten 2-3 Balken zu neuen Niveaus ausbrechen könnte. Er sollte hauptsächlich auf dem T
FREE
This trading method is inspired by Linda Bradford Raschkes 3 Little Indians pattern. Put simply we anticipate price will approach a projected line that is based upon 2 previous fractals.    If 2 previous upper fractals occur we draw an upper line projected forward. If current price approaches this line we anticipate price will keep moving towards the line and breakthrough so we buy.    If 2 previous lower fractals occur we draw a lower line projected forward. If current price approaches this
FREE
Bouncing Bollinger tells the trader when the market is about to reverse using 3 candlestick formations as well as the Directional Movement Index Indicator.    When the previous candle has dipped into the upper or lower Bollinger Band and a candle signal appears along with DMI showing un-volatile a signal occurs showing possible reversal ahead.  Features : A practical way of recognising when a new reversal is about to occur. Choose your favourite signal color. Send alerts to either your PC, eM
FREE
The Hi Lo Breakout is taken from the concept of the ZZ Scalper EA which exploits the inevitable behaviour of price fluctuations and breakouts.  The fact that because market prices will always fluctuate to higher highs before ebbing down to lower lows, breakouts will occur. But here I've added a few more filters which I see work well also as an Indicator.    Range Analysis :    When price is within a tight range this Indicator will be able to spot this and only then look for price breaks. You
FREE
Hi Lo Breakout
Stephen Reynolds
2.33 (3)
A system with steady ROI > 10% a month like clockwork!  Hi Lo Breakout strategy opens and closes trades based on the time of day in relation to the highs and lows of both yesturday and today. It will then trade out these prices using the trade management settings within user inputs.    For best results see .set file at comment  no2 . Features : A purely mechanical system. Simply set and leave. No martingale or grid.    Risks are small per trade.   An optional automatic lot adjustment feature th
FREE
The Midnight Scalper
Stephen Reynolds
2 (2)
Midnight Scalper is based on a sound trading principle. It is made to trade during times when the market is at low volatility. From 23:00 to 00:00 is best.  It uses multiple indicators for precise entry and exits with a basic fixed stop loss and take profit as part of its money management strategy.It does not put your funds at high risk with such methods as martingale, grid, averaging positions or no stop loss trading. ECN broker is required with a tight spread and low commission. NOTE :   Afte
FREE
BESCHREIBUNG 3 Bar Break basiert auf einer Handelsmethode von Linda Bradford Raschke, von der ich festgestellt habe, dass sie gut geeignet ist, potenzielle zukünftige Kursschwankungen zu erkennen. Es wird danach gesucht, ob das Hoch des vorherigen Balkens niedriger ist als das Hoch des 3. Balkens und ob das Tief des vorherigen Balkens höher ist als das Tief des 3. Er sagt dann voraus, dass der Markt innerhalb von 2-3 der nächsten Balken zu neuen Niveaus ausbrechen könnte. Muss auch während der
FREE
Divergence Convergence MACD is based on the classical divergence and convergence methods of charting. Divergence is when we get higher highs and lower lows on our uptrend but which are not supported by our indicator which makes lower highs and therefore signals the underlying momentum is failing and so a reversal might occur. Vice versa for downtrend. Convergence is when the higher highs and higher lows of an uptrend are also confirmed by our indicator making lower lows which helps us confirm th
FREE
The Hidden Gap EA
Stephen Reynolds
This EA is based on the Indice gaps between todays open price and yesturdays closing price. On Metatrader these are not shown as we only see a 24hr chart. If we want to know the gap between the open at 16:30 and yesturdays close at 23:30 on the SP500 this EA will reveal the gap. On Indices these types of Gap close approximately 60% of the time within the same day and is demonstrated on the panel which records previous gap closures and provides to the user a statistical proof of gaps closing for
FREE
Auswahl:
Keine Bewertungen
Antwort auf eine Rezension
Version 1.1 2017.07.21
Fixed: Alerts now pop up only when a signal occurs.