Minute and Hour Charts
- Indikatoren
- Version: 1.10
- Aktivierungen: 5

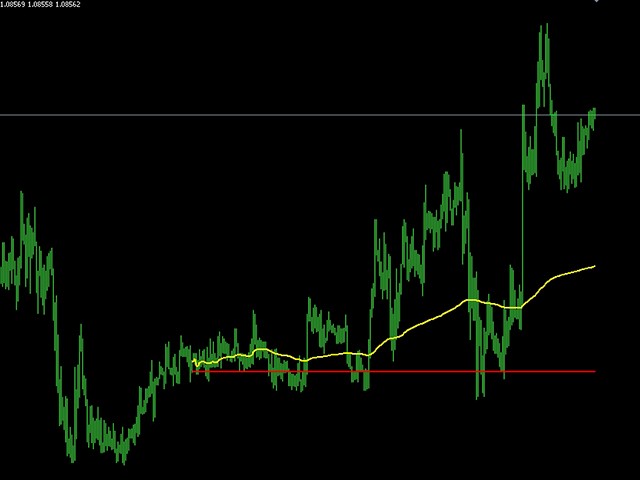
Der Index von 5 Minuten ist das Liniendiagramm sehr nah an der Karte, um die Wirkung und die Zeit zu bekommen
Verwenden Sie die Methode des Index:
1, 5 Minuten K-Linie in ein Liniendiagramm setzen2, ändern Sie die Farbe des weißen Liniendiagramms3, legen Sie die Hintergrundfarbe und das Gitter fest
Gelb für den Durchschnitt .
Rot ist die Nullachse (d.h. der Schlusskurs von gestern) .
Englische Fassung
Forex Hedge EA Standard-Ausgabe
Forex Hedge Pro EA Erweiterte Version
Chinesische Version
Forex Hedge EA cn Standard-Ausgabe
Forex Hedge Pro EA cn Erweiterte Version
QQ:437180359 E-Mail:hl3012@139.com