MetaTrader 4용 무료 기술 지표 - 16

Stochastic with Trend Filter: Precision Signals This is a powerful and easy-to-use indicator designed for traders who want more reliable signals from the classic Stochastic oscillator. How It Works: This indicator improves on the standard Stochastic by adding a powerful trend filter. It uses an Exponential Moving Average (EMA) to determine the overall direction of the market. The indicator will only generate a "buy" signal when both the Stochastic crossover is bullish and the price is above the
FREE

Free informative Indicator-helper. It'll be usefull for traders who trade many symbols or using grid systems (Averaging or Martingale). Indicator counts drawdown as percent and currency separate. It has a number of settings: Count deposite drawdown according equity value and send e-mail or notifications to user if DD more than set; Sending e-mail when max open orders reached; Shows price and remaining pips amount before MarginCall on current chart and Account generally; Display summary trade lot
FREE
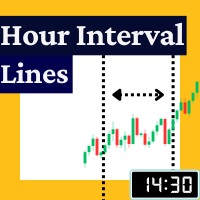
The Rayol Code Hour Interval Lines indicator was designed to assist your trading experience. It draws the range of hours chosen by the user directly on the chart, so that it enables traders to visualize price movements during their preferred trading hours, providing traders a more comprehensive view of price movements and market dynamics. This indicator allows the user to choose not only the Broker's time, but also the Local time. This way, the user no longer needs to calculate local time in re
FREE

Rsi indicator and Stochastic Combined into one indicator , the Supreme StochRsi doesnt repaint / Back-paint / delay. can be used as overbought oversold strategy , or trend following on 50 level cross. if you like this indicator please check my Supreme Trendhisto: here , and my Supreme Diamond indicator : here ========================================================================= Parameters : Stochastic K and D value , Stochastic period Rsi Period Rsi price ====================================
FREE

The Pivot Indicator is a vital tool for technical analysis used by traders in the financial markets. Designed to assist in identifying potential reversal points or trend changes, this indicator provides valuable insights into key levels in the market. Key features of the Pivot Indicator include: Automatic Calculations: The Pivot Indicator automatically calculates Pivot Point, Support, and Resistance levels based on the previous period's high, low, and close prices. This eliminates the complexity
FREE
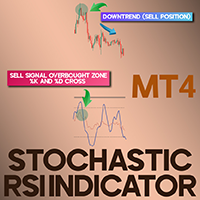
Stochastic-RSI Indicator for MetaTrader 4 The Stochastic RSI (StochRSI) indicator is one of the indicators in MetaTrader 4, which combines two popular indicators: The Relative Strength Index (RSI) and the Stochastic Oscillator. This indicator is designed to identify overbought and oversold points with higher sensitivity than the regular RSI. The StochRSI indicator consists of a blue line representing the RSI and a red dashed line representing the %D line of the Stochastic indicator. Values below
FREE

Balanced Entry by VArmadA A simple yet powerful fractal based Support/Resistance Indicator
Works with timeframes 1H and higher and tested on all major pairs. Pay attention to the signal: An arrow indicating a long or short entry.
How It Works:
Arrows indicate reversed support/resistence. Up arrow means long - down arrown indicates a short trade.
Instructions: - IndicatorLong/IndicatorShort: Choose the colors for the given indicator arrows - Show Resistence Levels: Visualize the resistence l
FREE
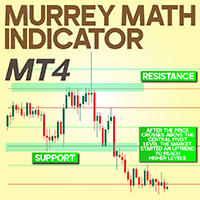
Murrey Math (MM) Indicator MetaTrader 4 The Murrey Math (MM) Indicator displays 13 horizontal support and resistance lines on the MetaTrader 4 (MT4) chart using six different colors, each representing a specific price level and function. At the center lies the blue pivot line—serving as the primary trend reference—with six lines above and six lines below it. When price trades above the pivot line, it suggests an uptrend; trading below the pivot line implies a downtrend. «Indicator Installation &
FREE

The Magic LWMA indicator is of great help in determining trend direction. It can be an excellent addition to your existing strategy or the basis of a new one. We humans can make better decisions when we see better visually. So we designed it to show a different color for rising and falling trends. Everyone can customize this in the way that suits them best. By setting the Trend Period, we can optimize it for longer or shorter trends for our strategy. It is great for all time frames.
IF YOU NEE
FREE

레벨 인디케이터는 전일 데이터를 기준으로 합니다. 수학 공식에 따라 진입 및 청산 레벨이 결정됩니다.
트레이딩 추천. 레벨은 변동성이 나타날 때 유럽 세션이 시작될 때 거래됩니다. 변동성이 충분하지 않은 경우 테이크프로핏의 절반을 사용하여 종료합니다. 가격이 절반 테이크프로핏에서 반전했다면 반전 시 목표가도 절반 테이크프로핏 수준에서 설정합니다. 가격이 진입 가격에서 반등했다면 반대 방향으로 가격이 두 번째 테이크프로핏에 도달할 수 있습니다.
항상 브레이크 아웃에 진입해서는 안됩니다. 재테스트(레벨 돌파 후 반대쪽에서 테스트)를 기다리는 것이 좋습니다. 재테스트는 시장에 최소 거래량 레벨이 여러 개 있는 경우 잘 작동합니다. UPD1 프로필 레벨 표시기를 참조하세요.
입력 매개변수.
Start Hour - 몇 시부터 하루의 시작을 계산합니다. 00 - 기본값.
Visual Button - 버튼 표시(활성화/비활성화). Corner - 버튼 앵커 각도. X indent -
FREE

Basic Theme Builder: 차트 맞춤화를 간편하게 Basic Theme Builder 지표로 거래 경험을 혁신하세요. 이 다용도 도구는 MetaTrader 4 에서 차트의 외관을 간편하게 사용자 맞춤화할 수 있도록 설계된 직관적인 패널을 제공합니다. 다양한 테마와 색상 스킴을 간단히 전환하여 거래 환경의 시각적 매력과 기능성을 향상시킬 수 있습니다. Free MT5 version Basic Theme Builder 지표는 MetaTrader 4 차트를 손쉽게 개인화하려는 거래자에게 최적의 도구입니다. 간단한 패널 인터페이스와 다양한 테마 프리셋을 통해 거래 스타일이나 기분에 맞게 차트의 외관을 빠르게 조정할 수 있습니다. 클래식한 룩부터 현대적인 미학까지, Basic Theme Builder는 시각적 경험을 향상시키고 집중력을 높이는 데 도움이 되는 다양한 옵션을 제공합니다. 오늘 이 실용적이고 사용하기 쉬운 지표로 거래 환경을 최적화하세요. 주요 기능: 간편
FREE
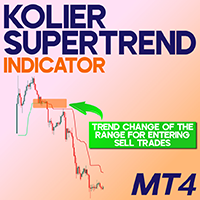
Kolier Supertrend Indicator for MetaTrader 4 The Kolier Supertrend Indicator for MetaTrader 4 serves as a trend-following tool designed to pinpoint directional movements and potential turning points in the market. It utilizes the ATR (Average True Range) value to determine volatility-based trend changes. With this trading utility on the MT4 platform, the indicator’s line shifts to green when an upward trend initiates, and flips to red when bearish momentum takes over. «Indicator Installation & U
FREE

As you know, the price always moves in a certain channel and when the price goes out of the channel, it always tends to return back to the trading channel The Ind Channel Exit indicator will help you not to miss the price going out of the channel It can show an alert or send a message to the terminal on your smartphone that the next bar has closed above or below the channel levels It has a minimum number of settings and the main parameter is the Channel Multiplier , which determines the width o
FREE

[Deviation of each indicator MT4] is a collection of 18 indicators, and one of them can be arbitrarily selected to participate in the calculation. It can calculate the deviation form of each indicator and can prompt an alarm.
Parameter setting description:
[indicators] is to choose one of the 18 indicators to participate in the calculation (this parameter is very important) .
[period] is a common cycle for each indicator.
[Method] is the MA mode of some indicators.
[Apply_to] is the applic
FREE

The tool that will help you calculate the lot accurately for the risk you need, if you want to risk 1% of your account, just enter the entry, target and stop values and you will have the lot size to use and only lose the chosen percentage. You can also choose a fixed value. This tool will help you with consistency, because you can only be consistent if you operate consistently and enter with fixed loss values, it is an INFALLIBLE way to be consistent!!!!
FREE
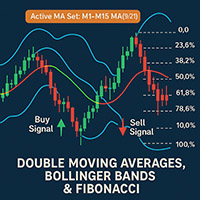
2 Moving Averages with Fibonacci And Bollinger Bands Author: Mir Mostofa Kamal
Version: 1.00
Platform: MetaTrader 4 (MT4) Overview 2 Moving Averages with Fibonacci And Bollinger Bands is a powerful, all-in-one custom indicator designed for traders who want to combine moving average crossover strategies with multi-time frame logic and Fibonacci retracement levels . It intelligently adapts its behavior based on the current chart time frame and adds visual and audible alerts when trading sign
FREE

The Hull Moving Average (HMA), developed by Alan Hull from 2005, one of the most fast-moving Average, reduce lag and easy to use to identify Trend for both Short & Long term. This Indicator is built based on exact formula of Hull Moving Average with 3 phases of calculation: Calculate Weighted Moving Average (WMA_01) with period n/2 & (WMA_02) with period n Calculate RAW-HMA: RAW-HMA = 2 * WMA_01(n/2) - WMA_02(n)
Weighted Moving Average with period sqrt(n) of RAW HMA HMA = WMA (RAW-HMA, sqrt(n)
FREE

Indicator measures strength of each currency in your list.
Main idea: It simply iterates through all combinations of pairs and adds difference between open and close in percent. Parameters: List of currencies - what currencies will be calculated (maximum is 8) Calculation type - from which data will be strength calculated Calculation data input - used as input related to calculation type Symbol suffix - used in case of suffix on symbols, e.g: when your symbols look like EURUSDm, EURUSDmicro etc
FREE

이 제품은 표시기/신호 도구로부터 정보를 수신하고 특정 조건이 충족되면 화살표 또는 알림을 표시합니다.
예를 들어, MA25와 MA50이 교차할 때, SAR이 반전할 때, MACD가 플러스/마이너스를 변경하거나 종가가 볼린저 밴드를 교차할 때 화살표와 알림이 표시됩니다.
구체적인 구성은 샘플 설정 이미지를 참조하세요.
자세한 매뉴얼 및 구성 파일은 다음을 참조하세요.
https://www.mql5.com/en/blogs/post/755082
무료 버전도 다운로드할 수 있습니다.
화살표는 다양한 구성으로 표시될 수 있으며 조합은 상상만큼 무한합니다.
신호 도구 및 표시기에 대한 연결을 설정하는 데 문제가 있는 경우 당사에 문의하여 도움을 받으십시오.
또한 요청 시 스마트폰, 이메일, Slack, Line, Discord 등에 알림을 푸시하고, 최대 8개의 매개변수를 추가하거나 개별 지표에 연결할 수 있습니다. 신호 도구를 보완하거나 이벤트 알림 기능으로 사용할 수
FREE
The presented indicator, based on the volatility readings of a financial instrument plots dynamic S/R levels on the price chart. The indicator determines the trend and points to possible entry points formed by local highs/lows. The indicator allows you to notify the user of its signals by sending messages to the terminal and e-mail. The indicator does not repaint or recalculate. Signals when working with the indicator: The appearance of a red arrow above the price chart is a possible start of a
FREE

LotSize Indicator Discover the appropriate lot size to use in your trades based on the available margin. This indicator provides valuable information for risk management. If the indicator shows a value of 0, it means that your balance or available margin is insufficient for trading. It is important to maintain adequate margin levels for safe trading practices. This indicator is exclusively designed for the MT4 platform, a popular and reliable trading platform in the market. With the LotSize Indi
FREE

RSI Bands is a powerful indicator which displays an upper and lower band corresponding to the RSI overbought and oversold levels. The band shows what price must be reached during that specific candle in order for the RSI overbought/oversold level to be reached. This is an extremely useful tool for spotting when a trend has begun and when a trend is about to end. The indicator provides buffers, allowing you to use it in your own Expert Advisor. Please message me if you have any questions.
CURREN
FREE

This indicator is designed for calculating the value of points for the specified lot sizes. The MT5 version is here https://www.mql5.com/en/market/product/29230 Description by lines Line 1 - deposit currency. Line 2 - lot size (10 input parameters) . All further values are calculated into columns below each lot size. Line 3 - calculation of value for one point. Line 4 - calculation of value for spread. All subsequent lines - calculation of value for points (20 input parameters) . All you need t
FREE
Highly configurable Bollinger Bands indicator. Features: Highly customizable alert functions (at levels, crosses, direction changes via email, push, sound, popup) Multi timeframe ability Color customization (at levels, crosses, direction changes) Linear interpolation option Works on strategy tester in multi timeframe mode (at weekend without ticks also) Parameters:
Bollinger Bands Timeframe: You can set the lower/higher timeframes for Bollinger Bands. Bollinger Bands Bar Shift: Y ou can set
FREE
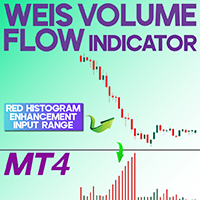
Weis Volume Flow Indicator MetaTrader 4 The Weis Volume Flow Indicator is an essential tool for analyzing trading volumes and understanding market behavior. As a sophisticated analytical tool, it combines volume and price data, enabling traders to detect the smart flow of volume within the market. This integration offers deeper insights into market dynamics and supports better trading decisions. «Indicator Installation & User Guide»
MT4 Indicator Installation | Weis Volume Flow Indicator MT5
FREE

FREE

Advanced Renko & Point & Figure Indicator for EURUSD Win/Loss Pattern Analysis + Smart Trade Timing This powerful indicator combines two proven strategies—Renko and Point & Figure (P&F)—into one comprehensive tool for analyzing EURUSD trends, recognizing patterns, and managing risk. With smart Box Size calculation (Fixed or ATR-based), moving average filters, and win/loss pattern detection, traders can make sharper, data-driven decisions. Key Features Hybrid Renko + P&F System Renko: Noi
FREE

Please refer to full version: https://www.mql5.com/en/market/product/140908
Key Zone Detector Key Level Supply & Demand Zone Detector Overview A sophisticated supply and demand zone detection indicator that identifies and rates key price levels where significant market activity occurs. The indicator uses fractal analysis and multiple validation methods to detect and classify trading zones. Key Features Zone Detection Auto-detects support and resistance zones Uses dual fractal system (fast and
FREE
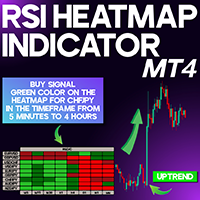
RSI Heatmap Indicator for MetaTrader4 The RSI Heatmap Indicator is a powerful technical tool in MetaTrader 4 that allows traders to assess the relative strength conditions of different currency pairs via a color-coded heatmap. By merging the Relative Strength Index (RSI) with a visual heatmap approach, this indicator simplifies market analysis by displaying strength and directional bias of multiple instruments at a glance. This indicator produces a heatmap based on calculated RSI levels across v
FREE

This simple indicator paints with a darker color on the volume bar when the quantity traded is above the average of select number of periods of the volume itself, highlighting the moments when there was a large volume of deals above the average. It is also possible to use a configuration of four colors where the color tone shows a candle volume strength. The indicator defaults to the simple average of 20 periods, but it is possible to change to other types of averages and periods. If you like t
FREE

This indicator monitors the vital constants of your trading account to keep it healthy and away from excessive risks. It monitors all trades, absolute exposure, account floating point and leverage currently in use, using different color codes for your interpretation. [ Installation Guide | Update Guide | Troubleshooting | FAQ | All Products ] Amazingly easy to understand The indicator is clean and simple It calculates exposure by pairs and currencies Keep your used leverage controlled at all ti
FREE
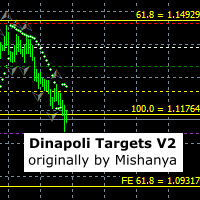
This indicator sets stop, start and target 1, 2 and 3 levels based on detected market swings on multiple timeframes. It was originally written by Mishanya and has been updated by Ramoletane to move with the price and automatically update the levels. A trade can be placed when price has crossed the white start line and stop loss placed on the red stop line. The lot size can be reduced at the green target 1 level, the yellow target 2 level and the position finally closed at target 3. Most of the t
FREE
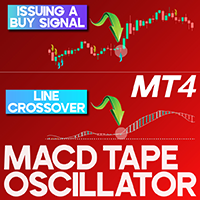
MACD Tape Oscillator for MT4 The MACD Tape Oscillator for MT4 is a refined version of the traditional MACD indicator, offering traders a clearer view of trend momentum and strength. Unlike the standard MACD, this indicator highlights market direction by shifting histogram shades between light/dark blue and orange/red, allowing for easier interpretation of momentum changes. «Indicator Installation & User Guide» MT4 Indicator Installation | MACD Tape Oscillator MT5 | ALL Products By TradingF
FREE

Informative & optimized Zigzag, Accumulated volume, Price change A rewrite of the traditional zigzag tool with new additions. Features:- Optimized code Displays accumulated volume between peaks Displays price change between peaks Usage:- Identify trend swings Identify high volume swings Compare price changes between swings Drawing Fibonacci tool on strong price change or high volume swings
FREE
The presented indicator is an original development based on the idea embedded in the classic technical analysis indicator - Fractals. The Fractals indicator allows you to determine a significant trough or peak for analysis on the price chart of the financial instrument in question. The fractal itself on the price chart consists of candles, the middle of which is either the highest (up fractal) or the lowest (down fractal) of all the candles taken for analysis. The original indicator uses five ca
FREE

The product Divergence Mom Stoch Adx Bears Bulls is designed to find the differences between indicators and price. It allows you to open orders or set trends using these differences. The indicator has 4 different divergence features.
Divergence types Class A Divergence Class B Divergence Class C Divergence Hidden Divergence
Product Features and Rec ommendations There are 5 indicators on the indicator Indicators = Momentum Stochastic Adx Bears Bulls 4 different divergence types are used.
FREE

Stochastic Plus is a visual indicator designed for both beginners and professionals. Developed using Stochastic and Laguerre and the principle of three screen. Stochastic Plus helps: correctly evaluate the current market movement; find optimal entry points; do not rush to close profitable orders and increase profit Stochastic Plus works very well with AmericanDream indicator (see screenshot). May be used with any currency and timeframe.
FREE
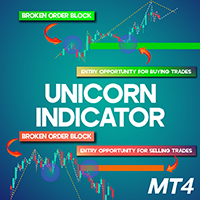
Unicorn Indicator MT4
The Unicorn Indicator is an advanced and versatile tool designed for MetaTrader 4 (MT4) . This indicator detects and marks price gaps along with Breaker Blocks on the chart. A Breaker Block is a former order block that initially fails but later turns into a strong support level once the price revisits it. When a Breaker Block coincides with a Fair Value Gap (FVG) , the result is known as the Unicorn Zone . The indicator visually represents bullish Unicorn zones with a gree
FREE

The indicator displays two Moving Average lines on the chart with parameters specified in the settings. It issues a signal in the form of arrows and a sound at the intersection of these Moving Average. In the indicator settings, you can set the period of fast Moving Average ( Fast MA Period ) and slow Moving Average ( Slow MA Period ). And also Shift, Applied Price, Method and Timeframe for two Moving Averages separately. Important:
The main difference from othe
FREE
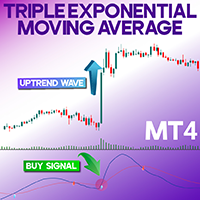
Triple Exponential Moving Average Indicator MetaTrader 4 The Triple Exponential Moving Average (Trix) indicator in MetaTrader 4 effectively filters out minor, insignificant price fluctuations, providing clear visual buy and sell signals. A trade entry signal is generated when the red line (Signal) crosses the green dashed line from below to above, or vice versa. Blue arrows on the oscillator indicate Sell signals , while yellow arrows signify Buy signals . «Indicator Installation &
FREE

The Fisher Transform is a technical indicator created by John F. Ehlers that converts prices into a Gaussian normal distribution. The indicator highlights when prices have moved to an extreme, based on recent prices. This may help in spotting turning points in the price of an asset. It also helps show the trend and isolate the price waves within a trend. The Fisher Transform is a technical indicator that normalizes asset prices, thus making turning points in price clearer. Takeaways Turning poi
FREE
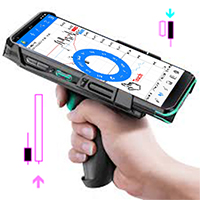
This is an indicator that helps you to scan the whole timeframe then informs you about the last candle position Engulfing Candlestick pattern was formed. The indicator also send alert to your mobile when a new engulfing candle is formed.
For the visual;
1. Green up arrow indicates a bullish engulfing candlestick pattern
2. Red down arrow indicates a bearish engulfing candlestick pattern
FREE

Relative Volume or RVOL is an indicator that averages the volume of X amount of days, making it easy to compare sessions volumes.
The histogram only has 3 colors:
Green - Above average volume
Yellow - Average volume
Red - Below average volume
The default setting is 20 days, which corresponds more or less to a month of trading.
With the data obtained from this indicator you can better gauge the commitment behind a move. For example, you will be better equipped to judge if a breakout of a r
FREE

The volume weighted average price (VWAP) is a trading benchmark used by traders that gives the average price a security has traded at throughout the day, based on both volume and price. VWAP is calculated by adding up the dollars traded for every transaction (price multiplied by the number of shares traded) and then dividing by the total shares traded. You can see more of my publications here: https://www.mql5.com/en/users/joaquinmetayer/seller
FREE
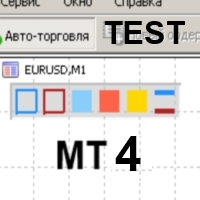
Color Levels - удобный инструмент для тех, кто использует технический анализ с использованием таких инструментов, как Трендовая линия и Прямоугольник. Имеется возможность настройки двух пустых прямоугольников, трех закрашенных и двух трендовых линий. Настройки индикатора крайне просты и делятся на пронумерованные блоки: С цифрами 1 и 2 вначале - настройки пустых прямоугольников (рамок); С цифрами 3, 4 и 5 - настройки закрашенных прямоугольников; С цифрами 6 и 7 - настройки трендовых линий. Объе
FREE

The Hi Lo Breakout is taken from the concept of the ZZ Scalper EA which exploits the inevitable behaviour of price fluctuations and breakouts. The fact that because market prices will always fluctuate to higher highs before ebbing down to lower lows, breakouts will occur.
But here I've added a few more filters which I see work well also as an Indicator.
Range Analysis : When price is within a tight range this Indicator will be able to spot this and only then look for price breaks. You
FREE
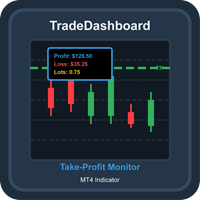
TradeDashboard Comprehensive MT4 Indicator for Trade Visualization and Analysis Overview TradeDashboard is a powerful MetaTrader 4 indicator designed to enhance your trading experience by providing real-time visualization of take-profit levels for all open positions. This advanced tool goes beyond basic TP indicators by displaying comprehensive metrics including potential profits, losses, and total lot sizes, all directly on your chart. Key Features Take-Profit Visualization : Clearly displays h
FREE

Using the indicator you can 1 Identify the trend and follow the large and small trends by drawing lines. When the price leaves the corridor of the lines, then with a high probability the price will go to the next line and reverse on it. 2 Long-line - Lay lines along the centers of fractals, the indicator can detect the fractal of the second point (Number bars analysis). Often the price can approach the line even after a week or a month and you can open a reversal trade. If the wave has passed w
FREE
The purpose of this new version of the MT4 standard indicator provided in your platform is to display in a sub-window multiple timeframes of the same indicator. See the example shown in the picture below. But the display isn’t like a simple MTF indicator. This is the real display of the indicator on its timeframe. Here's the options available in the FFx indicator: Select the timeframes to be displayed (M1 to Monthly) Define the width (number of bars) for each timeframe box Alert pop up/sound/ema
FREE
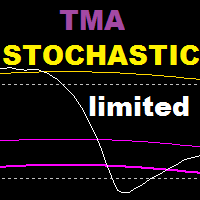
TMA Stochastic is an indicator based on stochastic oscillator and tma bands indicator , this indicator is based on a reversal strategy . Recommended time frame : 15 and above Recommended settings : lower values for scalping , higher values for swing trading WORKS ONLY ON EURUSD , GET THE FULL VERSION : https://www.mql5.com/en/market/product/108378 ======================================================================= Parameters : tma history : how many bars back to show tma bands on stochas
FREE

APriceChannel is a modification of the standard Price_Channel indicator. The EA draws 2 levels - the upper level shows the price High for the specified period of time, the lower level shows the price Low for the same period. In addition to the period, you can set vertical offset in points to widen the channel up and down. This prevents false breakouts of current support/resistance levels.
Inputs Period - time period in bars - the number of bars to calculate the price High/Low. Offset up and dow
FREE

The BB Arrows MTF indicator is based on the Bollinger Bands indicator. Represents input signals in the form of arrows. All signals are generated on the current bar. In 2 modes, Signals are not redrawn (Exception of very sharp jumps)! All signals in MTF mode correspond to signals of the period specified in MTF. It is maximally simplified to use both for trading with only one indicator and for using the indicator as part of your trading systems. A feature of the indicator is that the indicator ti
FREE
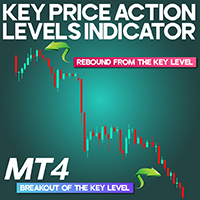
Key Price Action Levels Indicator for MT4
The Key Price Action Levels Indicator for MetaTrader 4 marks important zones on the chart where price has historically reacted. These zones often act as support or resistance, or represent supply and demand areas. The indicator uses a color-coded system to visually display rounded price levels directly on the chart. «Indicator Installation & User Guide»
MT4 Indicator Installation | Key Price Action Levels Indicator MT5 | ALL Products By TradingFind
FREE

TrendPeakValley Scanner v1 – Advanced Reversal Detection Tool
TrendPeakValley Scanner v1 is a powerful custom indicator designed to detect price peaks and valleys based on price action analysis. It visually highlights local tops and bottoms, making it ideal for traders who rely on market structure, support/resistance zones, and reversal patterns.
---
Key Features:
Peak & Valley Detection: Scans historical price action and identifies swing highs/lows based on customizable sensitivi
FREE

팬더 오실레이터는 스캘핑을 위해 설계된 새로운 저자의 지표입니다.
표준 및 독점 도구의 전체 범위의 판독 값을 기반으로 신호를 제공하는 표시기.
팬더 발진기의 주요 특징: 분석 기능
모든 통화 쌍 및 시간 프레임에서 사용할 수 있습니다; 표시기가 다시 그려지지 않습니다; 그것은 다른 지표에 큰 도움이됩니다; 그래픽 기능
차트의 최소 위치 수를 차지합니다; 유연한 팅크; 쉽게 배울 수; 팬더 발진기 구성...
이 표시기는 파란색 선입니다.; 주황색 선은 통합 된 표시기입니다.; 점선은 볼린저 밴드의 경계입니다. 6) 파란색 선은 볼린저 밴드의 중간 선입니다; 팬더 발진기의 주요 특징
필터링을 위한 표시기 집합이 있습니다; 이 시장에 진입 할 필요가있을 때 표시 자체가 표시됩니다;
팬더 발진기의 기본 설정: 이 기간 동안 파란색 선을 설정해야합니다.;
밴드 기간-점선의 조정;
엄마 기간-이동 평균 설정;
밴드 편차-밴드 편차;
밴드 시프트-밴드의 시
FREE

ChannelRSI4 과매수 및 과매도 영역의 동적 수준이 있는 상대 강도 지수(RSI) 표시기.
동적 수준은 지표 및 가격의 현재 변화에 따라 변경 및 조정되며 일종의 채널을 나타냅니다.
표시기 설정 period_RSI - RSI 인덱스를 계산하기 위한 평균 주기. apply_RSI - 적용 가격. PRICE_CLOSE - 종가, PRICE_OPEN - 시가, PRICE_HIGH - 해당 기간의 최고 가격, PRICE_LOW - 해당 기간의 최소 가격, PRICE_MEDIAN - 중간 가격(고가 + 저가) 중 하나일 수 있습니다. / 2, PRICE_TYPICAL - 일반 가격(고가 + 저가 + 종가) / 3, PRICE_WEIGHTED - 가중 평균 가격, (고가 + 저가 + 종가 + 종가) / 4.
period_channel - 과매수 및 과매도 구역의 동적 채널에 대한 계산 기간.
FREE
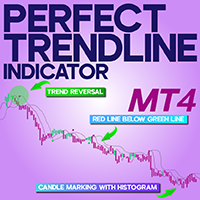
Perfect Trendline Indicator for MT4
The Perfect Trendline Indicator uses two moving averages (MA) with periods of 3 and 7 to display the trend's direction. When the red line (fast moving average) is positioned above the green line (slow moving average) , the trend is considered bullish , with candles marked with green histograms . Conversely, a bearish trend is indicated when the red line is below the green line, and red histograms appear . «Indicator Installation & User Guide»
MT4 Indicator I
FREE

Fibonacci SR Indicator
This indicator creates support and resistance lines. This indicator is based on Fibonacci Retracement and Extension levels. It will consider many combinations of the Fibonacci levels and draw support/resistance lines based on these. This indicator uses tops and bottoms drawn by the ZigZag indicator in its calculations. The ZigZag can also be drawn on the chart, if necessary. The indicator considers many combinations of past reversal points and Fibonacci ratio levels, and w
FREE

Time Range Separator is a useful tool to display a separator period on your platform. You could go in the properties of the indicator, select the desired range and that's ALL. We believe it is a useful and necessary that we wish to share with you for free all our followers.
Input Values: TimeFrame Period Separator GMT_Hour (ex. +1 or -1) to move the lines at Period Time +/- tot hours in input Hide_dates to show or hide the datetime on vertical lines VLine_Color = Vertical Color Line VLine_Style
FREE

The free version of the Hi Low Last Day MT4 indicator . The Hi Low Levels Last Day MT4 indicator shows the high and low of the last trading day . The ability to change the color of the lines is available . Try the full version of the Hi Low Last Day MT4 indicator , in which additional indicator features are available : Displaying the minimum and maximum of the second last day Displaying the minimum and maximum of the previous week Sound alert when crossing max . and min . levels Selecting an arb
FREE
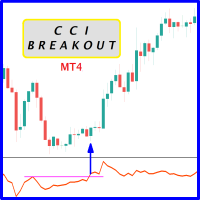
Probability emerges to record higher prices when CCi oscillator breaks out oscillator historical resistance level when exhibit overbought values. Since, oscillator breakout of support and resistance have similar effect as price breaks support and resistance levels, therefore, its highly advised to confirm price breakout with oscillator breakout; certainly, will have the same output in short trades. Concept is based on find swing levels which based on number of bars by each side of peak or trough
FREE
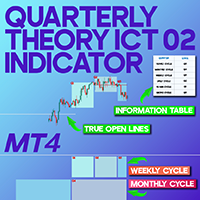
Quarterly Theory ICT 02 Indicator MT4 The Quarterly Theory ICT 02 Indicator MT4 is a specialized analytical tool built upon ICT methodology and fractal time cycles. It segments the market into systematic phases, allowing traders to observe repeating price behaviors over different time horizons. These recurring stages are divided into four quarters (Q1, Q2, Q3, Q4) and can be applied consistently across micro, daily, weekly, and yearly cycles depending on the trader’s preferences. «Indicator Inst
FREE
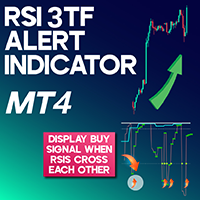
RSI 3TF Alert Indicator for MetaTrader 4 The RSI 3TF Alert Indicator for MetaTrader 4 (MT4) is designed around the RSI indicator utilizing a 2-period configuration. The RSI 3TFA integrates 3 distinct RSI indicators into a single chart view, making market analysis more streamlined for traders. When all 3 RSI indicators move above the 50 threshold, the RSI 3TFA generates a buy signal, and conversely, when they cross below the 50 level, it issues a sell signal. The yellow dots (blue in default conf
FREE
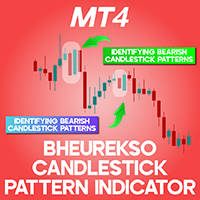
Bheurekso Candlestick Pattern Indicator for MetaTrader 4
The Bheurekso Pattern Indicator , designed for the MetaTrader 4 (MT4) platform, is an advanced tool for identifying candlestick reversal patterns on the chart. This indicator can detect six bullish and six bearish candlestick patterns, displaying them with specific labels on the chart. In addition to pattern identification, it provides signals and alerts to inform traders about the formation of these patterns, enabling timely trade entrie
FREE

The GTAS BSI is an indicator designed to provide the trend direction and buy/sell signals, using combination of momentum indicators. This indicator was created by Bernard Prats Desclaux, proprietary trader and ex-hedge fund manager, founder of E-Winvest.
Description The BSI indicator is represented as a histogram under the price chart. +100 (green) value indicates a bullish trend. -100 (red) value indicates a bearish trend. When the BSI turns to +100 (green), it gives a potential buy signal. Wh
FREE

This indicator plots another symbol on the current chart. A different timeframe can be used for the symbol, with an option to display in multiple timeframe mode (1 overlay candle per several chart candles). Basic indicators are provided. To adjust scaling of prices from different symbols, the overlay prices are scaled to the visible chart price space.
Features symbol and timeframe input MTF display option to vertically invert chart, eg overlay USDJPY, invert to show JPYUSD
data window values; o
FREE

R Var 이동 평균 지표는 완고한 추세 추종자를 위해 설계된 추세 추종 지표입니다.
그것은 주식 거래자뿐만 아니라 상품 거래자 사이에서 꽤 인기있는 외환 거래 지표이며 그 인기는 사용자에게 진정한 돈 버는 신호를 전달하는 능력에서 비롯됩니다.
표시기는 시에나 라인에 배치된 녹색 및 빨간색 점으로 구성됩니다. 녹색 점은 강세 신호를 가리키고 빨간색 점은 약세 신호를 나타냅니다.
기본 거래 신호 매수 신호: 지표의 시에나 선에 있는 점이 녹색으로 바뀌면 매수하세요. 매도 신호: 지표의 시에나 선에 있는 점이 빨간색으로 바뀌면 매도하십시오. 매수 거래 종료: 강세 추세가 진행되는 동안 표시기의 시에나 라인에 빨간색 점이 나타나면 모든 매수 주문을 닫습니다. 매도 거래 종료: 약세 추세가 진행되는 동안 R Var 이동 평균 지표의 시에나 선에 녹색 점이 표시되면 모든 매도 주문을 마감합니다.
팁 R Var 이동 평균 지표를 사용할 때 잘못된 신호를 방지하기 위해 적당한 손절매를
FREE
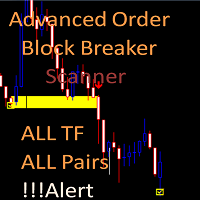
Advanced Order Block Breaker Scanner
This Scanner is free to download but is dependent on you owning the advance order block breaker indicator. Need to purchase the indicator here: https://www.mql5.com/en/market/product/59127
MT5 version: https://www.mql5.com/en/market/product/62769
The Scanner will show you on a single chart all the timeframes (M1 to Monthly) with their own status for the indicator: advance order block breaker Scan all time frame and all symbol: breaker's smart algor
FREE
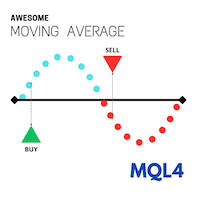
Overview
Discover a powerful yet simple indicator to identify market trends effectively! Awesome Moving Average (AWMA) is designed to detect bullish or bearish trends by analyzing price breakouts beyond the moving average line. Basically, the way this indicator works is similar to the Moving Average indicator available on the MetaTrader platform. As we know, the Moving Average indicator tends to be difficult to use when the market is in a sideways condition because it often gives false breakou
FREE
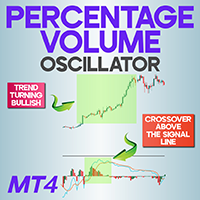
Percentage Volume Oscillator MT4 The Percentage Volume Oscillator MT4 is a specialized volume-based indicator designed for the MetaTrader 4 trading platform. It evaluates the relative shifts in trading volume across financial instruments, allowing traders to pinpoint optimal buy and sell zones and monitor prevailing market trends. This indicator features two volume-based moving averages alongside a histogram, which appears in a dedicated subwindow separate from the price chart. «Indicator Instal
FREE
MetaTrader 플랫폼 어플리케이션 스토어에서 MetaTrader 마켓에서 트레이딩 로봇을 구매하는 방법에 대해 알아 보십시오.
MQL5.community 결제 시스템은 페이팔, 은행 카드 및 인기 결제 시스템을 통한 거래를 지원합니다. 더 나은 고객 경험을 위해 구입하시기 전에 거래 로봇을 테스트하시는 것을 권장합니다.
트레이딩 기회를 놓치고 있어요:
- 무료 트레이딩 앱
- 복사용 8,000 이상의 시그널
- 금융 시장 개척을 위한 경제 뉴스
등록
로그인
계정이 없으시면, 가입하십시오
MQL5.com 웹사이트에 로그인을 하기 위해 쿠키를 허용하십시오.
브라우저에서 필요한 설정을 활성화하시지 않으면, 로그인할 수 없습니다.