Konstenfreie technische Indikatoren für den MetaTrader 4 - 20

Engulfing candlestick patterns are comprised of two bars on a price chart. They are used to indicate a market reversal. The second candlestick will be much larger than the first, so that it completely covers or 'engulfs' the length of the previous bar.
By combining this with the ability to look at trend direction this indicator eliminates a lot of false signals that are normally generated if no overall trend is taken into consideration
FREE
Vertical Lines for Hour - Time-Based Trading Indicator The Vertical Lines for Hour indicator allows you to mark up to 4 vertical lines at specific times on your chart. Simply enter the hour without considering the minutes, and you can also choose the color for each line. This indicator is useful for identifying session ranges or implementing custom trading strategies. It provides a straightforward solution for your trading needs. Key Features: Mark up to 4 vertical lines at specified times. Sele
FREE
One of the basic rules of trading is that the trend is your friend. The presented indicator is one of the best solutions for building your own trading system. Basic rules for its use: Green line - buy trades are allowed; Red line - sell trades are allowed. The indicator displays signals confirming the development of a bullish and bearish trend using the ADX oscillator algorithm. Average directional movement index (ADX) determines a price movement direction comparing its high and low with high an
FREE

Sweep Trend Der Indikator markiert auf dem Chart in Form eines Rechtecks volatile Teile der Kursbewegung gemäß den festgelegten Einstellungen.
Beschreibung der Einstellungen TrendPips - Filterwert in Punkten TrendBars - Filterwert in Anzahl Balken signal_shift - Verschiebung relativ zum aktuellen Balken um eine angegebene Anzahl von Perioden nach hinten, für Signale CountBars - die Anzahl der Balken zur Anzeige des Indikators Color_1 - eine der Farben der abwechselnden Rechtecke Color_2 - di
FREE

CCI Trend Finder indicator with different colors at levels 0, 100 and -100. The cross is a signal for "123 Exit" as presented by MPlay and used in Woodies CCI system. This exit signal is effective especially in short-term breakout trades, because it prevents early exiting at small corrections. This indicator is great for having it as an extra tool for your analysis.
FREE

Description This is an indicator that colors market moods on a linear chart in the window of the main financial instrument. It is useful for determining support and resistance levels. Purpose The indicator can be used for manual or automated trading as part of an Expert Advisor. For automated trading, you can use values of indicator buffers of the double type: rising line - buffer 0, must not be equal to EMPTY_VALUE. falling line - buffer 1, must not be equal to EMPTY_VALUE.
FREE
We offer indicators that will meet your needs more. >> MT Sideway Filter <<
MT Focus Session : It is an indicator used to look at the session time of interest by focusing only on the market opening to closing time only. It is recommended to set Open session LONDON and End session USA, because it was a time graphs tend to have very high volume.
TRADE: Forex
TIME FRAME: M5 M15 M30 H1
SYMBOL PAIR: All Symbol
SETTINGS: FOCUS SESSION Open Session Time: Start time of t
FREE
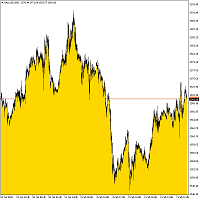
Bottom Background 4 Der Indikator setzt je nach Einstellung den unteren Hintergrund einer bestimmten Farbe auf den aktuellen Preis. Beschreibung der Anzeigeeinstellungen: MODE - drei Anzeigeoptionen für den Indikator: Low - Anzeige des Mindestpreises, Open / Close - Anzeige des Eröffnungs- oder Schlusskurses, je nachdem, welcher Wert niedriger ist, MA - Anzeige des gleitenden Durchschnitts. PeriodMA - Periode des gleitenden Durchschnitts.
FREE

Introducing CCI Jurik—a dynamic indicator designed to elevate your forex trading experience by integrating custom moving averages based on the Commodity Channel Index (CCI) with the MetaTrader 4 indicator, CCI.
Jurik moving averages are renowned for their accuracy and reliability in analyzing price movements in the forex market. They offer traders a smoother representation of price action, reducing noise and providing clearer signals for identifying trends and potential reversals.
The Commo
FREE

The principle of this indicator is very simple: detecting the candlestick pattern in D1 timeframe, then monitoring the return point of graph by using the pullback of High-Low of D1 Candlestick and finally predicting BUY and SELL signal with arrows, alerts and notifications. The parameters are fixed and automatically calculated on each time frame. Example:
If you install indicator on XAUUSD, timeframe D1: the indicator will detect the reversal, pullback, price action on this timeframe (for exa
FREE

'Circle Rising Point' is an indicator based on the cycle theory. No matter whether your trading cycle is short or long, you can use this indicator to find the rise and fall points of different cycles and different bands. Therefore, the signals displayed to you on charts of different cycles are different, and applicable to left side transactions. This indicator is recommended to be used together with the multi cycle window for analysis. Indicator introduction Applicable products This indicato
FREE

Basierend auf einer Kombination von Indikatoren, PS Acid Fulx ist ein ausgezeichneter Indikator für zu wissen, wann zu kaufen oder zu verkaufen auf einem Vermögenswert und Temporäre. Der Indikator selbst habe ich als Werkzeug für meine Analyse beim Handel mit Forex verwendet. Es ist ein nützlicher und leicht verständlicher Trendindikator. Wenn Sie es mit Ihren eigenen Analysen kombinieren, werden Sie sicherlich ein gutes Ergebnis in Ihrer Operation erhalten.
FREE

Follow the trail of the comet to know the development of the trend. This indicator helps you to determine the evolution of the price depending on how these astronomical objects are shown in the chart. When the comet seems to stop, it opens its tails considerably and warns us of a possible change in trend. On the contrary, when it seems to get speed (looks thin because lines of tail are grouped) demonstrates safety and continuity in trend. The head or comet nucleus will show red or green accordin
FREE
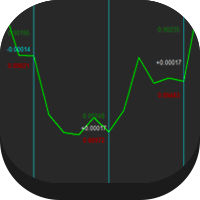
This indicator gives the highest and lowest information of the currency you have selected and the day you selected. It also shows the average. In this way, you can find out the profit / loss probability of your transactions for the same days. Reported: Average points per week Average points per year Lifetime average points Note: It does not provide you with buy / sell signals. Shows average points only
FREE

This indicator shows in a subwindow the trend in M1, M5, H1, D1 timeframes based on MA, MACD, Stochastic This way you could see in once in different timeframes what happening. This is my first free indicator. Please follow I will put here some more. Thank you for you attention. . . . . .
lfknglkslksnlgslgnsflgjrpoesv ,msv lkrjpfjésmdg sd.npo4wsmdglknsp4jwpkeégmfs.lkmp Thank you
FREE

ADR 10 mostra l'intervallo medio di pips di una coppia Forex, misurato su un numero di 10 giorni . I traders possono utilizzarlo per visualizzare la potenziale azione dei prezzi al di fuori del movimento medio giornaliero.
Quando l'ADR è al di sopra della media, significa che la volatilità giornaliera è superiore al normale, il che implica che la coppia di valute potrebbe estendersi oltre la sua norma.
L'ADR è utile anche per il trading di inversioni intraday. Ad esempio, se una coppia di
FREE

Introducing MACD Jurik—an advanced indicator designed to enhance your forex trading strategy by integrating custom moving averages based on the Moving Average Convergence Divergence (MACD) with the MetaTrader 4 indicator, MACD.
Jurik moving averages are renowned for their accuracy and reliability in analyzing price movements in the forex market. They offer traders smoother representations of price action, reducing noise and providing clearer signals for identifying trends and potential revers
FREE
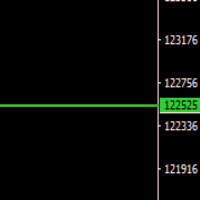
Simple Market Line Price Color
This indicator allows you to see the market's aggregation by buying or selling on the price line.
when it is attacked the sale turns into a color when it is attacked the purchase takes on another color
Indicator Parameters
indicator_colorUP - Color of UP price aggregation indicator_colorDown - Color of Down price aggregation indicator_WIDTH - WIDTH Line in chart
Good Trades
FREE

Description This scanner uses 3LZZ TRO ex4 and scans for Semafors at given “Shift” bar.
Scanner Detailed Settings: https://www.mql5.com/en/blogs/post/747456
Other Settings: Set Periods for Semafor 1,2,3 Set alerts on/off for Semafor 1,2,3 Shift bar (Bar on which semafor is scanned) Refresh After Ticks (Number of ticks when dash is refreshed) This scanner is pretty simplistic version. And a more detailed version with a different strategy is available here: https://www.mql5.com/en/market/produ
FREE

WONNFX create arrow tester. Сonstructor/Tester. Tester for buffer indicators. Converting a buffer indicator into an arrow signal on the chart. Combining two buffer indicators into one arrow signal. Filter by candle color. You can move the arrow signal several bars forward (useful in cases where the indicator gives signals 2-3 bars late
"WONNFX create arrow tester" is a tool designed specifically for traders who use buffer indicators in their trading strategies. This tester converts the buffer
FREE

Trend indicator with oscillator. Displays price area between two moving averages and an oscillator. An uptrend is indicated in red, a downtrend in blue. Settings: Slow MA Period - Slow MA period Fast MA Period - Fast MA period Smoothed Data - Smoothing data Show Area MA - Display MA price areas Show Oscillation - Display MA oscillation Move Oscillation to Slow MA - Display an oscillator on a slow MA Color Up - Uptrend color Color Down - Downtrend color Size Arrow - The size of the oscillator ic
FREE

Binary options tester Trading panel to test your strategies according to the rules of binary options. Scope: Set the percentage of profit from the transaction. Set the expiration time in seconds. Set the bet size Set the Deposit amount. Make several deals in a row. Keep track of the time before expiration. The tick chart with trade levels is duplicated to an additional window for accuracy. It allows you to work both in the testing mode and in the real quotes mode. The program gives an idea of bi
FREE

Our team has finally achieved the expected result.
We have created artificial intelligence for binary options trading. Don't believe? Many users have already rated it positively. The results will surprise you too. This indicator broadcasts signals for a binary option through a telegram channel. All signals are reliable and of high quality.
Read more !!! ATTENTION !!!
You didn't dream !!! HOW TO EARN RIGHT NOW? The most successful signal channel for binary options Students,
FREE
Der ZoomChart-Indikator zeigt Daten aus anderen Zeitrahmen auf dem aktuellen Chart im Unterfenster an und fungiert als Vergrößerungsglas oder umgekehrt, indem er den Chart verkleinert, um größere Zeitrahmen anzuzeigen.
Der ZoomChar-Indikator verfolgt automatisch den aktuell äußersten Balken im Chart und bewegt sich mit dem Chart, wenn dieser sich verschiebt.
Der Indikator kann die Daten eines anderen Finanzinstruments anzeigen und ist nicht auf das Hauptinstrument des Charts beschränkt.
D
FREE
The indicator is a complex of MACD and OsMA, built according to the complex of several popular oscillators. This combination allows you to get the best out of both types of indicators. On the one hand, a quick response to changes in the market environment, on the other hand, effective market following and noise filtering. The indicator values on a fully formed candle are not redrawn.
FREE
This indicator displays the moment when the MFI oscillator crosses its smoothed value. If the MFI oscillator crosses its smoothed value, it is a signal of a trend change. The signal is given after the end of the formation of the candle. The signal is confirmed when the price crosses the high/low of the bar on which the signal was given. The indicator does not redraw.
Custom Parameters: MFI_Period (>1) - MFI indicator period; MA_Period - period for smoothing MFI indicator values; MA_Method - me
FREE

The Candle High Low Exit indicator uses the highest high and the lowest low of a range to draw trailing stop lines (orange under buys, magenta over sells) that advance with the trend until the trend changes direction. Moreover, the trailing stop lines are generated to support the order’s trend direction (long or short): In an upward trend, the long trailing stop line (orange line under buy) appears and advances upward until the close crosses under the line.
In a downward trend, the short tra
FREE
Highly configurable Accumulation and Distribution (AD) indicator. Features: Alert functions. Multi timeframe ability (lower and higher TF also). Color customization. Linear interpolation and histogram mode options. Works on strategy tester in multi timeframe mode (at weekend without ticks also). Adjustable Levels. Parameters:
Ad Timeframe: You can set the lower/higher timeframes for Ad. Bar Shift for Lower Timeframe: Shift left or right the lower timeframe's candle. Stepless (Linear I
FREE

The indicator draws lines the the price highs and lows. Break through the high or low usually indicates trend change (or continuation). Once the price moves through a line, and the candlestick closes, the indicator draws an appropriate arrow (also, you can enable alerts). A deal should be conducted in the breakthrough direction immediately or after a slight rollback. It is best to trade following the trend on a larger timeframe. This indicator is easy to use, but nevertheless, there are many tra
FREE
Fractals Direction ST Patterns MT4 is a modification of Bill Williams' Fractals indicator, which allows you to specify any number of bars for finding a fractal. In the settings, it is also possible to set the number of points for determining the trend direction. The upward direction is determined if the last upper fractal is higher than the penultimate upper fractal. The downward direction is determined if the last lower fractal is lower than the penultimate lower fractal. This simple indicator
FREE
Highly configurable Average True Range (ATR) indicator.
Features: Highly customizable alert functions (at levels, crosses, direction changes via email, push, sound, popup) Multi timeframe ability Color customization (at levels, crosses, direction changes) Linear interpolation and histogram mode options Works on strategy tester in multi timeframe mode (at weekend without ticks also) Adjustable Levels Parameters:
ATR Timeframe: You can set the lower/higher timeframes for ATR. ATR Bar Shift: y
FREE
TIRED OF HAVING TO CALCULATE THE LOTSIZE EVERY TIME?
This indicator will do it for you, WHATEVER ASSET YOU CHOOSE in 10 seconds !!!
INSTRUCTIONS
The things to do in order to activate this indicator will take around 10 seconds once you understand how to use this indicator properly.
Here are the steps to follow:
Place the indicator on the chart of the asset you want to trade on.
Go to " Inputs ".
Enter where you want to set the stop loss .
Choose risk in $ .
You can also
FREE
Binary Options Assistant (BOA) FLAME Signals Indicator provides signals based on the combination of: RSI, MACD & Stochastic Indicators
Stop missing trades, stop jumping from chart to chart looking for trade set-ups and get all the signals on 1 chart! U se any of the BOA Signals Indicator with the Binary Options Assistant (BOA) Multi Currency Dashboard .
All BOA Signal Indicator settings are adjustable to give you more strategy combinations. The signals can be seen visually and heard a
FREE

Der technische Indikator sucht in Echtzeit nach Kerzen, die die in den Einstellungen festgelegte Größe überschreiten und gibt Signale an. In der Regel erscheinen solche ungewöhnlich großen Kerzen entweder am Anfang starker Impulse oder am Ende einer gerichteten Kursbewegung. Am Anfang des Impulses kann das Signal als Grundlage für die Suche nach einem Einstiegspunkt dienen, am Ende der Bewegung ist es ein Zeichen für einen Höhepunkt und kann von einem nahen Ende des Trends sprechen. Die Referenz
FREE

This is an extension of the previous published DollarIndex with the addition of the function for calculating EURO Index under ICE Formula. Note that the broker should provide the following data:
For Dollar Index formula, EURUSD, USDJPY, GBPUSD, USDCAD, USDSEK and USDCHF are needed. For Euro Index formula, EURUSD, EURGBP, EURSEK and EURCHF are needed. Now in this version if the SEK (the most uncommon) is not provided, the formula still works, since it adds 0.0001 to its value, but the index will
FREE
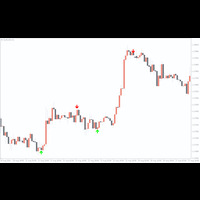
The indicator is a 15-minute signal indicator for all types of traders. Meaning, you could make lots of profits trading two different signals in one indicator.
NOTE: Both indicators are channels for achieving the same result. RED ARROW -- Sell Signal BLUE ARROW -- Buy Signal
Purchase now to be part of our community. We offer standard chart setups for both novice and intermediate traders. Trade with ease!
FREE

Идея индикатора очень проста и скорее всего пригодится тем, кто используют линейный график для технического анализа. Что-бы устранить "неровности" (-: линейного графика и был написан этот индикатор. Линия графика соединяет цены закрытия свечей, как и в классическом линейном графике, но игнорирует цены, которые шли в направлении линии и новый экстремум возникает только тогда, когда цена закрытия последней свечи явно ниже или выше предыдущего значения. Это облегчает визуальное восприятие при поиск
FREE

It's a simple but useful tool for creating a grid based on Envelopes.
Only 2 parameters can be set: 1) "Period" - the period of all visible Envelopes (i.e. 4) and 1 Moving Average (Envelopes axis), 2) "Deviations Distance" - the distance between Envelopes.
Naturally, the colors of all 9 lines can be changed as desired. It works with everything that is available in your Market Watch.
Good luck!
FREE
Unlock the power of precision in your trading strategy with Std Dev Channel, the innovative indicator designed to revolutionize your approach to market analysis. Crafted as an advanced version of the standard deviation indicator, Std Dev Channel empowers traders with enhanced insights into market trends and volatility patterns. With Std Dev Channel, harness the synergy of statistical analysis and technical charting to make informed trading decisions. This cutting-edge tool meticulously calculate
FREE
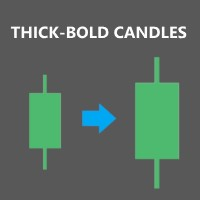
Description: Expand the width of your candles horizontally in MT4 to improve visibility when zooming in or out of the chart. Once attached to the chart, the indicator will automatically double the size of the candles compared to their normal value. Main indicator inputs: Body: size of the candle body Wick: size of the candle wick Additionally, you have the option to change the color of the candle body. We hope you find this free and useful indicator enjoyable!
FREE
What is a tool ? This indicator use for forecast direction of the 28 pairs, Calculates from multiple pairs and timeframes and present by percentage as 70-79% , 80-89% , 90-100% is a little, medium and strong trend. How to use Place the indicator on any pair and any timeframe. Pair : Any Timeframe : Any Input Parameter No Visit my products Target Profit Magic Target Profit All The Profit Tracker Currency Scoring Pair Direction
FREE

The Stochastic Basket Currency Strenght brings the Stochastic indicator to a new level. Expanding the boundaries of TimeFrames and mono-currency analysis, the SBCS take the movements of each currency that composes the cross and confront them in the whole basket of 7 crosses. The indicator works with any combination of AUD, CAD, CHF, EUR, GBP, JPY, NZD, USD pairs and with full automation takes in account every stochastic value (main line) for the selected Time Frame. After that, the indica
FREE

This indicator helps you determine the evolution of the price depending on how these fly objects are shown in the chart. When the gliders opens their wings considerably warns us of a possible change in trend. On the contrary, when seems to get speed (looks thin because lines of wings are grouped) demonstrates safety and continuity in trend. Each wing of a glider is a directrix between the closing price and the high/low prices of the previous bar. The color (green/red) of each glider foresees bet
FREE

Chart Time Indicator is very simple and easy, but it can be very important to control the time before opening any manual trade. This indicator shows the time on the chart between 3 different options.
Input parameters Show Time : Select all the time options that you want to see. Local Time (Personal Computer Time), Server Time (Broker Time) or GMT Time. Recommendations: Use only one Chart Time Indicator for each chart.
FREE

This indicator is one of the variants of the MACD technical indicator. The indicator is the difference between two moving averages with different smoothing periods. Each moving average is additionally smoothed by an adaptive digital filter. In a simplified sense, an adaptive digital filter is a moving average with effective smoothing. Using a digital filter allows you to smooth out sharp fluctuations with minimal signal delay.
Using the indicator: It should be taken into account that the value
FREE
This indicator displays RVI indicator signals on the chart. The main point of Relative Vigor Index Technical Indicator (RVI) is that on the bull market the closing price is, as a rule, higher, than the opening price. It is the other way round on the bear market. So the idea behind Relative Vigor Index is that the vigor, or energy, of the move is thus established by where the prices end up at the close. To normalize the index to the daily trading range, divide the change of price by the maximum r
FREE

Combined indicators, based on moving averages and price momentum, help you to know when to break out your profit timely. It lets you to ride on major trend as long as possible but knowing when to break out smart and timely. The indicator displays major trend, volatile, reversal signals and last lowest and highest price. It's status updated on top right of your chart keeps you informed about pip-changes involved.
Parameters: FAST Period
Period of the fast moving average
SLOW Period
Period
FREE

The indicator displays on a chart trading results. You can configure the color and font of displayed results, as well as filter trades based on the magic number. If multiple trades were closed within one bar of the current timeframe, the result is summed and output in one value.
Utility parameters Plot profit in - the format of output results: wither in deposit currency taking onto account commission and swap, or in points. Start from - start processing data at the specified time. Plot last de
FREE

Candle Counter This product counts the candles and shows the result according to the configuration defined by the user. Professional traders use it to emphasize a specific candlestick.
Settings Position - Choose whether the numbers will be displayed above or below the candle Distance - The distance that the number will have from the candle, referring to the minimum or maximum Font Size - Font Size Color - Font Color
FREE
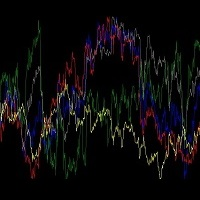
An indicator for analyzing different currency pairs simultaneously Forex is a complex market that requires several currency pairs to be analyzed simultaneously Determine the number of currency pairs yourself Determine the currency pair you want to analyze to analyze 4 of the most important and similar currency pairs at the same time. For direct and simple analysis, some currency pairs have changed (EURUSD>>>USDEUR) Do not doubt that to succeed in this market, you must analyze several currency pa
FREE

This indicator is a histogram showing the trend based on 3 different moving averages. When all averages are set in ascending order, the indicator is green, and when in descending order, it is red. If the averages do not show a trend, the color is yellow. Additionally, each average can have different settings, such as Mode MA and Price MA. You can also set an alert and receive notifications on your phone.
To enable the alert and push notification, you need to activate them first in the MT4 setti
FREE

Der Zeit-Ende-Balken von MMD ist ein einfacher Indikator, der die verbleibenden Sekunden in den drei ausgewählten Intervallen anzeigt. Gemäß der MMD-Methodik ist der Moment wichtig, in dem eine direktionale Preisbewegung auftritt. Dieser Indikator ermöglicht es Ihnen, diese Beziehung beim Forex- und Futures-Handel effektiver zu nutzen.
Beschreibung der Funktionalität:
Zeitrahmen 1 Periode - Definieren des ersten Zeitintervalls Zeitrahmen 1 Farbe – Angabe der Farbe für das erste Zeitinterval
FREE

Property of Vertical Capital Edition: Gugol_Quants About USA INDEXES QUANT_INDICATOR: This is a indicator created by math modulation to be used as a trading tool, which was developed in MQL. (MT4) This indicator is for use only with US500(S&P500), NAS100(Nasdaq Composite) and US30(Dow Jones). Signals are activated on "Open" Candle. It’s based on Intraday/Swing Trades whose main timeframe is H1, H2, H3 and H4. However you can use it with other assets by testing with the appropriate settings. *
FREE
MAS Indicator can be used in all currency pairs and at any timeframe, it is suitable for any trading speed. In addition, it's relatively easy to trade with the MAS Indicator. This indicator produces two signals: BUY Signal: arrow deep sky blue SELL Signal: arrow red
Indicator parameters MA Method – type of moving average MA Shift – shift moving average Fast - fast period moving average Slow – slow period moving average RSI – value rsi Confirm – value confirm Flat – value flat Colors - colors o
FREE

The indicator displays two Moving Average lines on the chart with parameters specified in the settings. It issues a signal in the form of arrows and a sound at the intersection of these Moving Average. In the indicator settings, you can set the period of fast Moving Average ( Fast MA Period ) and slow Moving Average ( Slow MA Period ). And also Shift, Applied Price, Method and Timeframe for two Moving Averages separately. Important:
The main difference from oth
FREE

The indicator works as an extension that recolors the candles and the background in the terminal at the click of a button (Night Theme / Day Theme). The user can also set the display of the watermark of the symbol, and specify its size. The interactive menu allows you to toggle the display of the Ask value. And switch chart scaling from adaptive to fixed with one click.
You can add your favorite color to the settings for switching.
FREE
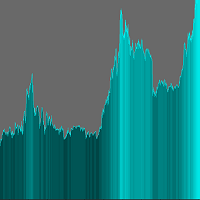
The indicator adds an overlay to the graph to create a histogram.
There are no parameters to set.
On the chart you can choose the color in the upper right corner by clicking on the appropriate brick.
The histogram is shaded depending on the price value.
Remember to set a line chart (shown in the screenshot). ........................... I invite you to purchase.
FREE
The indicator marks control points on the price chart, overcoming which by the price is a signal to open a deal. At the points marked by the indicator, the maximum or minimum price values go beyond the price channel built on the basis of price values for a longer period. After overcoming such points, the price is likely to continue moving in the same direction. The indicator does not redraw and, despite its simplicity, can be quite an effective trading tool.
Adjustable parameters: i_Period
FREE

The indicator shows the current situation on 16 indicators and 10 strategies.
Its values are formed based on the evaluation of the specified criteria for each strategy separately.
As a result, we can observe on the chart the strength of all the indicators included in it, as well as additional logic. Advantages: Signals do not redraw their values. The arrow is drawn after confirmation. All types of alerts. Shows weak zones based on the evaluation results. The passing value of the score is de
FREE

This indicator draws regular bullish and bearish divergences in real-time onto the charts. The algorithm to detect those divergences is based on my 10+ years experience of detecting divergences visually. The divergences are drawn as green and red rectangles on the charts. You can even do forward testing in the visual mode of the strategy tester. This FREE Version is restricted to EURUSD and GBPUSD. The full version without restrictions is here: https://www.mql5.com/en/market/product/42732
Para
FREE

Trend Panel Limited is an indicator that allows you to know the trend of a pair in a given timeframe using 2 moving averages. You can modify the period of the moving averages. Allows you to select which pairs you want to monitor in the input parameters. You also decide in what time period you want to follow up. In short, TrendPanel gives you the possibility of knowing the trend of a pair in a certain period of time without having to change the chart. Version limitations: You can only select 2 pa
FREE
The purpose of this new version of the MT4 standard indicator provided in your platform is to display in a sub-window multiple timeframes of the same indicator. See the example shown in the picture below. But the display isn’t like a simple MTF indicator. This is the real display of the indicator on its timeframe. Here's the options available in the FFx indicator: Select the timeframes to be displayed (M1 to Monthly) Define the width (number of bars) for each timeframe box Alert pop up/sound/ema
FREE

GMMA indicator that looks like a cloud. The GMMA indicator is easy to read, but to make it even more visually pleasing, we made it look like an Ichimoku Chart cloud. Colors have been changed where short-term and long-term overlap.
My other products https://www.mql5.com/ja/users/studiotam/seller
Please reduce the character limit a bit. I have nothing more to write.
FREE

Multi-Asset Forex Scanner
This indicator allows you to scan multiple assets at once, sending you configurable alerts when any asset touches daily pivot levels 1, 2 or 3.
The original code was just modified to send alerts to MT4 Desktop, MT4 Mobile or Email. (Credits for the original code go to Carlos Oliveira)
In order to receive mobile or Email alerts you must configure Notifications and Email sections in the MT4 platform.
In addition to pivots, this indicator also shows ATR, Volume,
FREE
Th3Eng Chart shadow indicator is a tool helps you to display another symbol on the current symbol in candles style or line. You can type the second symbol name in the setting and select the drawing mode { candles or line }. Also, the indicator displays the spread and current price of both pairs on the left top side corner of the chart.
setting: 1- Symbol: Insert The second symbol name. 2- Drawing mode: Choose the draw mode from (Candles or line). 3- Show spreads: true\false to display the pri
FREE

It's a simple but useful tool for creating a grid based on Bollinger Bands .
Only 2 parameters can be set: 1) "Period" - the period of all visible Bollinger Bands (i.e. 4) and 1 Moving Average (axis of all Bollinger Bands), 2) "Deviations Distance" - the distance between Bollinger Bands.
Naturally, the colors of all 9 lines can be changed as desired. It works with everything that is available in your Market Watch.
Good luck!
FREE

SuperTrend AM is an indicator that allows you to open a position at the very beginning of a significant price movement. The second most important quality of the indicator is the ability to follow the trend as long as possible in order to obtain all potential profits while minimizing potential losses. This indicator does not repaint or not recalculate. A version of this indicator with advanced settings and signal notifications is SuperTrend 3 AM .
Signal of the indicator: red arrow appearing a
FREE
The indicator displays the signals of the RSX oscillator on the price chart. (To display these signals in a separate window, along with the oscillator, another indicator is used - RSX Osc 4 AM ). It is optimal to use the indicator signals as signals to open a trade when the price overcomes the maximum or minimum of the bar at which the signal was given. An opposite signal cancels the previous signal.
Settings: Data period for indicator calculation - data period for indicator calculation; Dat
FREE
The purpose of this new version of the MT4 standard indicator provided in your platform is to display in a sub-window multiple timeframes of the same indicator. See the example shown in the picture below. But the display isn’t like a simple MTF indicator. This is the real display of the indicator on its timeframe. Here's the options available in the FFx indicator: Select the timeframes to be displayed (M1 to Monthly) Define the width (number of bars) for each timeframe box Alert pop up/sound/ema
FREE
Introduction and Description The commodity channel index (CCI) is an oscillator originally introduced by Donald Lambert in 1980. Since its introduction, the indicator has grown in popularity and is now a very common tool for traders in identifying cyclical trends not only in commodities but also equities and currencies. The CCI can be adjusted to the timeframe of the market traded on by changing the averaging period. CCI indicator with different colors at levels 0, 100 and -100. The cross is a
FREE
MetaTrader Market - der einzige Shop, in dem man Handelsroboter als Demoversion herunterladen und testen sowie anhand historischer Daten optimieren kann.
Lesen Sie die Beschreibung und Bewertungen anderer Kunden über das gewünschte Produkt, laden Sie es direkt ins Terminal herunter und erfahren Sie, wie man einen Handelsroboter vor dem Kauf testet. Nur bei uns können Sie ein Programm testen, ohne dafür zu bezahlen.
Sie verpassen Handelsmöglichkeiten:
- Freie Handelsapplikationen
- Über 8.000 Signale zum Kopieren
- Wirtschaftsnachrichten für die Lage an den Finanzmärkte
Registrierung
Einloggen
Wenn Sie kein Benutzerkonto haben, registrieren Sie sich
Erlauben Sie die Verwendung von Cookies, um sich auf der Website MQL5.com anzumelden.
Bitte aktivieren Sie die notwendige Einstellung in Ihrem Browser, da Sie sich sonst nicht einloggen können.