 MetaTrader 5
 Expert Advisors
 Indikatoren
 Skripte
 Bibliotheken
 Speicher
Schau, wie man Roboter kostenlos herunterladen kann
Finden Sie uns auf Twitter!
und werden Sie Mitglied unserer Fangruppe
und werden Sie Mitglied unserer Fangruppe
Interessantes Skript?
Veröffentliche einen Link auf das Skript, damit die anderen ihn auch nutzen können
Veröffentliche einen Link auf das Skript, damit die anderen ihn auch nutzen können
Hat Ihnen das Skript gefallen?
Bewerten Sie es im Terminal MetaTrader 5
Bewerten Sie es im Terminal MetaTrader 5

- Ansichten:
- 46066
- Rating:
- Veröffentlicht:
- Aktualisiert:
-
 Sie verpassen Handelsmöglichkeiten:
- Freie Handelsapplikationen
- Über 8.000 Signale zum Kopieren
- Wirtschaftsnachrichten für die Lage an den Finanzmärkte
Registrierung EinloggenSie stimmen der Website-Richtlinie und den Nutzungsbedingungen zu.
Wenn Sie kein Benutzerkonto haben, registrieren Sie sich -
 Benötigen Sie einen Roboter oder Indikator, der auf diesem Code basiert? Bestellen Sie ihn im Freelance-Bereich
Zum Freelance
Description:
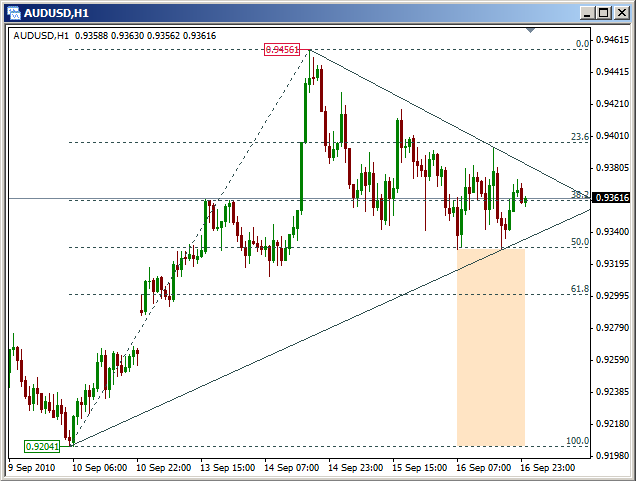
This indicator keeps a fibonacci study automatically updated to encompass the lowest low and the highest high in the currently visible portion of your chart. For those of you price action traders who always have fibs drawn and are constantly updating them to take into account new highs and lows, this indicator can save you some time.
Also plotted are two lines, one from the highest high to the high that creates the trend-line with the highest slope. Opposite for the support line.
Finally, a rectangle showing the amount of the move not yet retraced (since price made the most recent highest high or lowest low) is plotted above or below current price. This is useful if you have only the right-most portion of your chart visible from underneath other charts or due to being dragged off the left side of your monitor: you can see how much of the retracement has actually occurred without needing to see the candles that far back. This can be toggled off by setting the external variable DrawRetracementBlocks to false.
This indicator is intended to give you an overall feel for recent price action of the pair you have it plotted on.
Notes:
- When price starts making a new high or low, the indicator waits until the bar closes before updating the fibs or trend lines. For trend-line breaks it actually waits two bars. This gives you time to see a breakout in action, and is useful for spotting trend line breakout-pullback entries as they occur.
- The indicator is updated "lazily"; the objects are deleted and redrawn for each tick. This could be made more efficient if absolutely needed but the resource drain on your computer as the indicator is currently coded is so little as to be not worth the time to update it.
- Tip: If you don't already have the chart shift toggled on, give it a try for a few weeks. Click the icon with the small red left-pointed arrow. Having the extra margin to the right helps you visualize price action in the future and gives your mind's eye a bit of comfortable room to work out the potential movements.
 Flat_001a
EA works at the "slow" time (OpenHour_1 = 0) - North American Eastern Standard Time. EURUSD, H1
 EndOfBar
This script gives You information about time left to end of the bar.
MaEnv_02B
Indicator MaEnv_02B will be helpful to BUY, SELL or stay out of the market.
Optimize single Moving average trading
Optimize trading with a single moving average. This indcator tests each moving average and automatically finds the moving average which fits best to the current market