Schau, wie man Roboter kostenlos herunterladen kann
Finden Sie uns auf Facebook!
und werden Sie Mitglied unserer Fangruppe
und werden Sie Mitglied unserer Fangruppe
Interessantes Skript?
Veröffentliche einen Link auf das Skript, damit die anderen ihn auch nutzen können
Veröffentliche einen Link auf das Skript, damit die anderen ihn auch nutzen können
Hat Ihnen das Skript gefallen?
Bewerten Sie es im Terminal MetaTrader 5
Bewerten Sie es im Terminal MetaTrader 5
- Ansichten:
- 80833
- Rating:
- Veröffentlicht:
- Aktualisiert:
-
Benötigen Sie einen Roboter oder Indikator, der auf diesem Code basiert? Bestellen Sie ihn im Freelance-Bereich Zum Freelance
The Market Profile was developed by Peter Steidlmayer. He discovered a natural show of the market (the volume) and represented it in such a way (a bell-shaped curve) that the objective information generated by the market can be read.
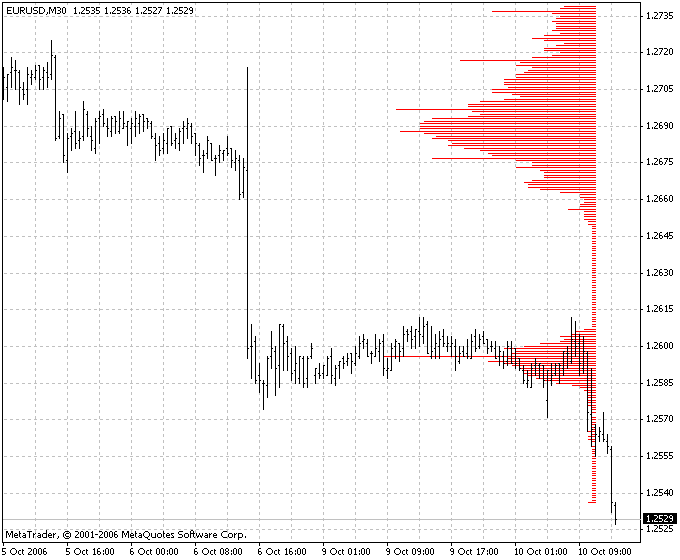
The Market Profile uses alternative presentation of information about both horizontal and vertical market moves, which produces a fully different set of models. The equilibrium market shown in the chart using the market profile tends to forming a bell-like curve turned by 90 degrees due to the diagram orientation.
Instead of drawing each time segment as a bar, each segment is located in a special way. The figure below shows how a 30-minute bar chart can be transformed into a market profile (on the right).
A long profile shows that the price remain the same for a long time. This happens when the market is relatively equilibrium since with the time, on the specified price, there were more possibilities. A short profile speaks for fast move to a new level, which happens when the market is disequilibrium. The profile outline shows the ratio between vertical and horizontal movements and is a key to understanding of what the traders do. The Market Profile can show both when the market is going to move from equilibrium to disequilibrium and how large this movement can be.
Parameters
STEP - vertical step in points.

 Three Line Break
Three Line Break - a raw of vertical rectangle, the height of which is determined by the value of price changes.
 Renko Charts
The Renko charting method is thought to have acquired its name from "renga" which is the Japanese word for bricks.
 PerkyAsctrend1
Indicator PerkyAsctrend1, as well as all other ASCTrend indicators is based on Laryy williams' oscillator %R, or WPR (Williams’ Percent Range).
 WPRfast
WPRfast is an indicator based on Larry Williams' oscillator %R, or WPR (Williams’ Percent Range). It shows a short-term market tone.