 MetaTrader 5
 Expert Advisors
 Indikatoren
 Skripte
 Bibliotheken
 Speicher
Schau, wie man Roboter kostenlos herunterladen kann
Finden Sie uns auf Telegram!
und werden Sie Mitglied unserer Fangruppe
und werden Sie Mitglied unserer Fangruppe
Interessantes Skript?
Veröffentliche einen Link auf das Skript, damit die anderen ihn auch nutzen können
Veröffentliche einen Link auf das Skript, damit die anderen ihn auch nutzen können
Hat Ihnen das Skript gefallen?
Bewerten Sie es im Terminal MetaTrader 5
Bewerten Sie es im Terminal MetaTrader 5

Heat Map - Indikator für den MetaTrader 4
Haroun Boutamani

Hello,
I have made several contributions to this community, feel free to check them out.
Now I am trading, on just manual.
I have made several contributions to this community, feel free to check them out.
Now I am trading, on just manual.
- Ansichten:
- 37150
- Rating:
- Veröffentlicht:
- Aktualisiert:
-
 Sie verpassen Handelsmöglichkeiten:
- Freie Handelsapplikationen
- Über 8.000 Signale zum Kopieren
- Wirtschaftsnachrichten für die Lage an den Finanzmärkte
Registrierung EinloggenSie stimmen der Website-Richtlinie und den Nutzungsbedingungen zu.
Wenn Sie kein Benutzerkonto haben, registrieren Sie sich -
 Benötigen Sie einen Roboter oder Indikator, der auf diesem Code basiert? Bestellen Sie ihn im Freelance-Bereich
Zum Freelance
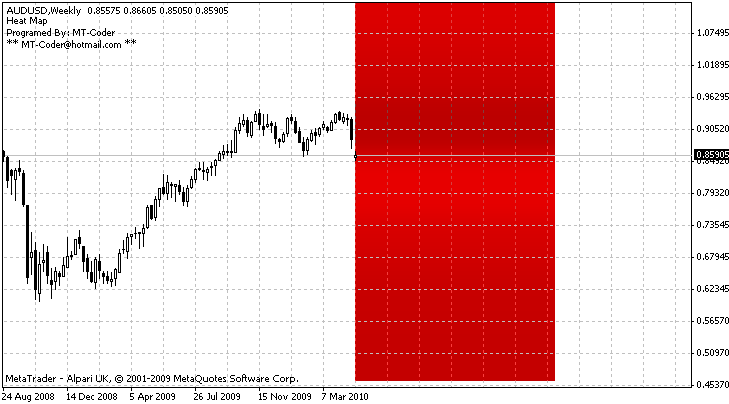
The purpose of this indicator is to highlight the price zones that had the most activity : the hotest zones.
The indicator shows a gradiant of zones colored in red.
It goes from bright Red 'coldest' to Dark Red 'hottest'. THE DARKER THE HOTTER
** ** ** * ** * *** SETTINGS ** ** **** ** * **
HMPeriod : the number of bars included in the count
Scale : the size of each zone.
NbZone : the number of zones (rectangles) to create.
If all you get is a blue rectangle then check the availibility of history data for the period you've set, or just change the period.
Update :
- Major bug fixed. If you downloaded this indicator before July 24 2010 then please redownload it.
- Now it should work with all timeframes
- Initialization fixed.
 OsMaSter_V0
The Expert Adviser uses the indicator OsMA.
Universal Ranger
Shows low high from the last bar from other timeframe. Timeframe can be changed
AutoMagiCal
Auto Magic Nr. Calc The Magic Nr. per ASC II Code from Symbols
Simple Trend Detector
Simple Trend Detector. Use the same as RSI and DeM.