• 概述
  • 评论
  • 评论

MACD Spectra

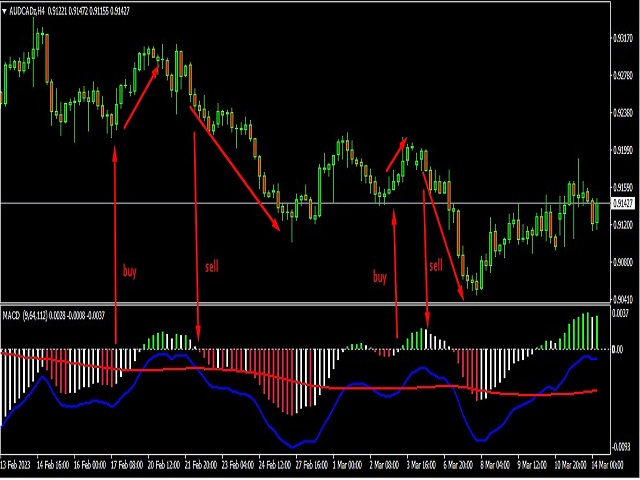
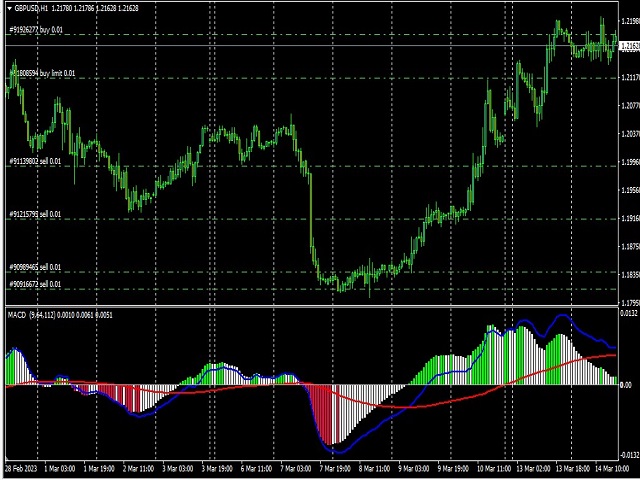
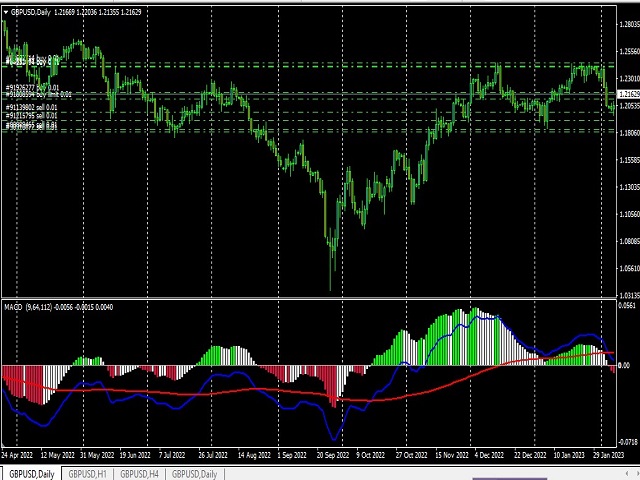
MACD Spectra,一个简单但赚钱的交易指标!该指标可用于所有时间框架和所有货币对。准确率超过90%,非常适合寻找最佳指标以协助其交易活动的新手和专业交易者。只需按照直方图的颜色、直方图的位置以及Signal和MACD线的位置即可轻松进出市场。不要再等待,让我们一起使用MACD Spectral获得稳定的利润。

阅读指标以进出市场非常容易:

  1. 如果蓝线穿过红线且交叉点在零线以下,而且第2个条的直方图是红色,则为强烈的卖出进入信号,当白色直方图出现时退出。
  2. 如果蓝线穿过红线且交叉点在零线以上,而且第2个条的直方图是绿色,则为强烈的买入进入信号,当白色直方图出现时退出。
  3. 在红色直方图低于0后出现白色直方图时,采取买入头寸,作为第2个条柱状图上的买入进入确认,当白色直方图出现在0以上时退出。
  4. 在绿色直方图高于0后出现白色直方图时,采取卖出头寸,作为第2个条柱状图上的卖出进入确认,当白色直方图出现在0以下时退出。


推荐产品
The indicator detects and displays Shark harmonic pattern (see the screenshot). The pattern is plotted by the extreme values of the ZigZag indicator (included in the resources, no need to install). After detecting the pattern, the indicator notifies of that by a pop-up window, a mobile notification and an email. The indicator highlights the process of the pattern formation and not just the complete pattern. In the former case, it is displayed in the contour triangles. After the pattern is comple
RSI TrendLine Divergency Message is an indicator for the MetaTrader 4 trading platform. Unlike the original indicator, this three in one version has a system of alerts that inform on market situation changes. It consists of the following signals: when the Main line crosses the levels of extreme zones and 50% level; when the Main line crosses the Trend line in the indicator window; divergence on the last bar. Parameters of levels of extremum, 50-level and divergence are adjustable. Parameters L
This indicator is based on the Bollinger Bands on one or more timeframes and on any Currency Cross Pair. The indicator generates an alert message when it detects a buy or sell signal. It also draws a vertical bar on the price chart: green for buy or red for sell, white if flat. Alert messages and Vertical bars for BUY or SELL, are generated when the Bollinger Bands is consistent for all chosen timeframes else a FLAT signal is generated. In addition, the Multi TimeFrames Bollinger Bands Signals i
Download the free version   here. Divergence Divergence refers to when the price of a currency pair moves in one direction while the trend indicator is moving in the opposite direction. With divergence, there can be positive and negative signals. Divergences in Forex trading are quite common signals of technical analysis. These are basic early Forex signals indicating the trend reversal and filter false signals. Application of this indicator It is usually not easy to detect divergences by the t
Introducing the Consecutive Green/Red Candle Alert Indicator for MT4 - Your Trend Spotting Companion! Are you ready to take your trading to the next level? We present the Consecutive Green/Red Candle Alert Indicator, a powerful tool designed to help you spot trends and potential reversals with ease. Whether you're a new trader looking for clarity in the market or an experienced pro seeking additional confirmation, this indicator is your trusted companion. Key Features of the Consecutive Green/Re
FREE
BE auto
Muhammad Ridzuan Mohd Radzali
5 (2)
Indicator automatically draw bullish and bearish engulfing without any rules. Bearish and Bullish engulf is well known area for supply and demand area marking. This indicator can be used in any strategy that required supply demand zone. Show Last Engulf : Enable this option to show unfresh engulfing  Candle to calculate : set 0 will load all history bar and can use up more memory Bearish Engulfing Colour : Pick any colour that suit Bearish Engulfing Colour  : Pick any colour that suit -Use thi
FREE
Wise Men Indicator demo
Bohdan Kasyanenko
3.67 (3)
The indicator displays signals according to the strategy of Bill Williams on the chart. Demo version of the indicator has the same features as the paid, except that it can work only on a demo account . Signal "First Wise Man" is formed when there is a divergent bar with angulation.  Bullish divergent bar - with lower minimum and closing price in the upper half. Bearish divergent bar - higher maximum and the closing price at the bottom half. Angulation is formed when all three lines of Alligat
FREE
Trend Map
Maryna Shulzhenko
The Trend Map indicator is designed to detect trends in price movement and allows you to quickly determine not only the direction of the trend, but also to understand the levels of interaction between buyers and sellers. It has no settings and therefore can be perceived as it signals. It contains only three lines, each of which is designed to unambiguously perceive the present moment. Line # 2 characterizes the global direction of the price movement. If we see that the other two lines are above
PZ Trend Trading
PZ TRADING SLU
4.75 (4)
许多盈利交易者不仅知道如何识别市场趋势,而且也能把握趋势建立后的交易机会。 Pz 趋势交易 指标设计用来在趋势行情中尽可能的赚取利润。 已建立的趋势提供了一揽子交易机会,但大多数趋势交易指标完全忽视了它们,让交易者在趋势行情时完全不知道该如何做!一般趋势指标只通知有关的趋势变化,但根本不足以得到卓越的回报. Pz 趋势交易 指标比一般趋势指标显示多达 20 倍的交易 , 因为它注重所谓的市场时机。它不仅显示当前的市场趋势,也有回调,内柱线的突破和调整。它令您在趋势回调之后介入,安全的柱线内突破金字塔加仓,以及发现潜在的反转,和已知的调整。 趋势改变 一个趋势改变在市场方向变化时发生。趋势变化在图表上用带数字的彩色圆圈显示。蓝色 (1) 信号为上涨开始, 而红色 (1) 信号为下跌开始。趋势变化并非评估当前价格动作的结果, 它意味着交易设置是不定时地。如果您正确使用本指标, 在趋势变化时, 您将将已经入场 (参看下面的调整)。 回调 但凡趋势在运动中,行情上下抖动,盈利者收割利润,且其它参与者入场。趋势回调代表好的买入机会,通常是由主力获利离场导致。如果行情在回调后回归上行, 指
PZ The Zone
PZ TRADING SLU
4.25 (4)
This indicator displays buy or sell signals according to Bill Williams' definition of the Trading Zone. [ Installation Guide | Update Guide | Troubleshooting | FAQ | All Products ] Easy to use and understand Avoid trading flat markets Deterministic indicator with clear rules The indicator is non-repainting It implements alerts of all kinds It has straightforward trading implications. A blue arrow is a buy signal A red arrow is a sell signal According to Bill Williams trading in the zone helps to
FREE
This is a combination of multiple oscillators into a single divergence system that creates the impression of a more reliable divergence indicator. It is multi-currency based and works best on 15 minutes timeframe and above. Every time a signal is generated, it shows an alert to the user. It is more ideal if combined with other price action indicators or trading systems.
Trend PA
Mikhail Nazarenko
5 (3)
The Trend PA indicator uses   Price Action   and its own filtering algorithm to determine the trend. This approach helps to accurately determine entry points and the current trend on any timeframe. The indicator uses its own algorithm for analyzing price changes and Price Action. Which gives you the advantage of recognizing, without delay, a new nascent trend with fewer false positives. Trend filtering conditions can be selected in the settings individually for your trading style. The indicator
基于具有标准参数的MACD指标波 在最后两个MACD波上分别对正面和负面交易斐波纳契水平, 如果负波浪在MACD指标上结束,则颜色为绿色, 如果正波在MACD指标上结束,那么颜色为红色。 Wave的终止标准是两个滴答,MACD的符号不同。 在最近四次MACD波浪中绘制趋势线。 与专家合作很好  Figures MACD   https://www.mql5.com/ru/market/product/42031 更多截图: https://www.mql5.com/ru/charts/10581596/audusd-h1-alpari-international https://www.mql5.com/ru/charts/10631979/usdjpy-m1-alpari-international https://www.mql5.com/ru/charts/10628704/gbpusd-m15-alpari-international
Fractals AM
Andriy Matviyevs'kyy
Classic indicator. The Fractals indicator analyzes the price patterns that form on the candlestick chart and display the reversal points of the market trend. The indicator consists of candles, the middle of which is either the highest (up fractal) or the lowest (down fractal). Highs and lows, indicated by the indicator on the chart, are recommended to be taken as points that form support and resistance lines. Unlike the original indicator, where fractals are formed by five candles (high/low in t
FREE
TrendInChannel
Andriy Sydoruk
This indicator is the undisputed leader among the indicators. And for this statement there is a good reason. The indicator builds a very high quality channel in which it generates signals to enter! What is the ideal strategy for the trader, since the trader always hesitates when choosing a strategy for the job. That is, this indicator will allow you to solve the dilemma of choosing a job by trend or to the channel, since it combines these two basic concepts. Working with the indicator is very
History Pattern Search
Yevhenii Levchenko
该指标建立当前报价,可以与历史报价进行比较,并在此基础上进行价格走势预测。指示器有一个文本字段,用于快速导航到所需日期。 选项: 符号 - 选择指标将显示的符号; SymbolPeriod - 选择指标从中获取数据的时段; IndicatorColor - 指示器颜色; HorisontalShift - 由指标绘制的报价移动指定的柱数; Inverse - true 反转引号,false - 原始视图; ChartVerticalShiftStep - 图表垂直移动(键盘上的向上/向下箭头); 接下来是文本字段的设置,您可以在其中输入日期,您可以通过按“回车”立即跳转到该日期。 接下来是文本字段的设置,您可以在其中输入日期,您可以通过按“回车”立即跳转到该日期。
With this easy to set up indicator you can display and set alerts for the following candlestick formations: Bull Breakout, Bear Breakout, Hammer, Pin, Bullish Engulfing, Bearish Engulfing. I'd appreciate if you would review the indicator Input parameters: ShortArrowColor: The color of the Arrows, displaying a Bearish candle formation LongArrowColor: The color of the Arrows displaying a Bullish candle formation BullishEngulfing: Disabled/Enabled/EnabledwithAlert BearishEngulfing:   Disabled/Ena
FREE
PZ Super Trend
PZ TRADING SLU
4.26 (43)
A top-quality implementation of the famous Super Trend indicator, which needs no introduction. It is completely loyal to the original algorithm, and implements many other useful features such as a multi-timeframe dashboard.  [ Installation Guide | Update Guide | Troubleshooting | FAQ | All Products ] Easy to trade It implements alerts of all kinds It implements a multi-timeframe dashboard It is non-repainting and non-backpainting Input Parameters ATR Period - This is the average true range peri
FREE
Magician Of Custom Index separate window 前言   “只有当股价的运动得到了两个平均指数运动的确认时,才有考虑它的价值”。 —————查尔斯·亨利·道   背景   道氏理论与道琼斯工业平均指数的主要创始人查尔斯·亨利·道所说,指数在市场决策中具有非常重要地位”任何脱离指数的行动最终可能都是错误的“。然而,通常在外汇市场中现成的指数很少,只有在股票市场中才有很多现成的指数 。 幸运的是,现在有了这个指标你也可以象亨利 · 道那样去编制指数,而且你完全可以轻而易举的完成任何你需要的指数。它甚至完全可以是你的专属,比如:纽元指数、加元指数、澳元指数、直盘指数、交叉盘指数、非美元的指数、欧元指数、日元指数、英镑指数、黄金指数……,总之有了这个指标任何你需要的指数操作都将变得简单。 当然,是否购买的权利始终是只掌握在你的手中的。 亨利· 道先生曾给过我们这样的忠告:“他们应该是许多投资者用来做商业决定的一种工具。” 在此,真心的祝愿这个指标能在你的决策中能发挥好的作用让你从此走在更赚钱的道路上! 基本功能使用方法及特点 的确, 这是一个基于道氏理论的指标
Convergence is when the higher highs and higher lows of an uptrend are also confirmed by our indicator making lower lows which helps us confirm that momentum is increasing and so the trend is likely to continue. Vice versa for a downtrend. Divergence is when we get higher highs on an uptrend but which are not supported by our indicator which makes lower highs and therefore signals the underlying momentum is failing and so a reversal might occur. Vice versa for downtrend. I have combined these me
VR Cub
Vladimir Pastushak
VR Cub 这是获得高质量切入点的指标。该指标的开发是为了促进数学计算并简化对仓位入场点的搜索。多年来,该指标所针对的交易策略已被证明其有效性。交易策略的简单性是其巨大的优势,即使是新手交易者也能成功进行交易。 VR Cub 计算开仓点以及获利和止损目标水平,这显着提高了效率和易用性。查看使用以下策略进行交易的屏幕截图,了解简单的交易规则。 设置、设置文件、演示版本、说明、问题解决,可以从以下位置获取 [博客] 您可以在以下位置阅读或撰写评论 [关联] 版本为 [MetaTrader 5] 计算入场点的规则 开仓 要计算入场点,您需要将 VR Cub 工具从最后一个高点拉伸到最后一个低点。 如果第一个点在时间上早于第二个点,交易者等待柱线收于中线上方。 如果第一个点在时间上晚于第二个点,交易者等待柱线收于中线下方。 根据上述条件,严格在 柱线收盘 后建仓。 换句话说,如果我们在小时图上进行交易,那么从最高点到最低点的时间距离必须超过24小时,最高点和最低点之间的点数必须大于或等于平均价格变动每天。 维持和改变市场地位 可以有多个未平仓头寸;每个头寸都可以单独修改。 VR Cu
前言   “只有当股价的运动得到了两个平均指数运动的确认时,才有考虑它的价值”。 —————查尔斯·亨利·道   背景   道氏理论与道琼斯工业平均指数的主要创始人查尔斯·亨利·道所说,指数在市场决策中具有非常重要地位”任何脱离指数的行动最终可能都是错误的“。然而,通常在外汇市场中现成的指数很少,只有在股票市场中才有很多现成的指数 。 幸运的是,现在有了这个指标你也可以象亨利 · 道那样去编制指数,而且你完全可以轻而易举的完成任何你需要的指数。它甚至完全可以是你的专属,比如:纽元指数、加元指数、澳元指数、直盘指数、交叉盘指数、非美元的指数、欧元指数、日元指数、英镑指数、黄金指数……,总之有了这个指标任何你需要的指数操作都将变得简单。 当然,是否购买的权利始终是只掌握在你的手中的。 亨利· 道先生曾给过我们这样的忠告:“他们应该是许多投资者用来做商业决定的一种工具。” 在此,真心的祝愿这个指标能在你的决策中能发挥好的作用让你从此走在更赚钱的道路上! 基本功能使用方法及特点 的确, 这是一个基于道氏理论的指标。它可在 MT4上 帮你制作几乎任何类型指数的指标。 更重要的是,如今我们 除了计
The indicator displays the data of the Stochastic oscillator from a higher timeframe on the chart. The main and signal lines are displayed in a separate window. The stepped response is not smoothed. The indicator is useful for practicing "manual" forex trading strategies, which use the data from several screens with different timeframes of a single symbol. The indicator uses the settings that are identical to the standard ones, and a drop-down list for selecting the timeframe. Indicator Parame
一个专业的交易工具是RSI和价格之间的背离指标,它允许您及时收到关于趋势反转的信号或捕捉价格回调走势(取决于设置)。 指标设置允许您根据RSI峰值的角度和价格的百分比变化来调整发散的强度,这使得微调信号强度成为可能。 指标代码经过优化,并作为Ea交易的一部分进行了非常快速的测试。  指标不重绘,交易方向的箭头正好位于信号出现的位置--在柱的开口处。 PeriodRSI_P     = 14 ;   //Period IndentFrom50_P  = 20.0 ; //Indent +- from 50 [0...50] LeftBars_P      = 1 ;     //LeftBars RightBars_P     = 1 ;     //RightBars IndDivForce_P   = 55.0 ; //Divergences force of indicator PriceDivForce_P = 0.01 ; //Divergences force of price Price_P         = PRICE_CLOSE ; //Price type
FREE
RSI Divergence F MT4
Andrey Dik
4.67 (3)
一个专业的交易工具是RSI和价格之间的背离指标,它允许您及时收到关于趋势反转的信号或捕捉价格回调走势(取决于设置)。 指标设置允许您根据RSI峰值的角度和价格的百分比变化来调整发散的强度,这使得微调信号强度成为可能。 指标代码经过优化,并作为Ea交易的一部分进行了非常快速的测试。  指标不重绘,交易方向的箭头正好位于信号出现的位置--在柱的开口处。 Fractal True PeriodRSI_P     = 14 ;   //Period IndentFrom50_P  = 20.0 ; //Indent +- from 50 [0...50] LeftBars_P      = 1 ;     //LeftBars RightBars_P     = 1 ;     //RightBars IndDivForce_P   = 55.0 ; //Divergences force of indicator (not for the Lite version) PriceDivForce_P = 0.01 ; //Divergences force of price (not f
FREE
This product is a part of  ON Trade Waves Patterns Harmonic Elliot Wolfe you can test free version on EURJPY from this link  Wolf Waves Indicator 探索 Wolf Waves - 您的终极交易工具! 您是否正在寻找一种强大的工具,能够轻松地在任何时间框架上识别 Wolf Waves?不用再找了!我们的 Wolf Waves 指标可以轻松完成这项任务。以下是为您呈现它的理由: 主要特点: 自动检测: 我们的 Wolf Waves 指标使用复杂的算法自动查找关键点并在您的图表上绘制相应的线条。不再需要手动搜索模式。 用户友好: 无论您是专业交易员还是对 Wolf Waves 还不熟悉,我们的指标都非常易于使用。 精准性: 它非常精确,降低了虚假信号的数量,提高了您的信心。 信息丰富: 该指标不仅限于模式检测。它还提供入场点、止损水平和利润目标等重要交易信息,帮助您做出明智的交易决策。 适用于 EA: 如果您进行自动化交易,此指标可以无缝集成
Hull Signal AM
Andriy Matviyevs'kyy
The presented indicator marks signals on the price chart with arrows in accordance with the data of the Hull Momentum AM indicator. The indicator gives a signal and sends a notification to the mobile terminal and email. The indicator is part of a series of indicators -  Hull Line AM, Hull Momentum AM, Hull Candles AM, Hull Signal AM . For a better understanding of the operation of each of the indicators, it is recommended to start working with them by using them together on one chart. The Hull M
FREE
UPD1 Rsi Dots Dashboard
Vitaliy Kuznetsov
5 (1)
指标在图表上显示基于终端RSI振荡器的信号。 从而能够滤除重复信号。 这里振荡器用于搜索反向信号。 建议将其作为波段策略和水平交易的切入点。 多币种仪表板可用。 有了它,您可以轻松地在图表之间切换。 在产品讨论中,您可以建议一种可以在其中嵌入仪表板的算法。 输入参数 。 主要设置 。 Bars Count – 指标将工作的历史柱的数量 。 RSI Period – 振荡器周期 。 RSI Level – 振荡器的电平。 振荡器在0到100之间。 如果选择10,信号将高于10,低于90 。 RSI Applied Price 。 Repeat Signal - 重复信号 。 Enable – 所有重复的信号将与箭头/图标 。 No Signal – 所有重复的将被忽略 。 视觉箭头 。 Sell Code – Sell rsi图标的代码编号 。 Sell Color – 出售RSI图标的颜色 。 Buy Code – 购买RSI图标的代码编号 。 Buy Color – 购买RSI图标的颜色 。 Indent Coeff – 由波动系数从阴影缩进 。 Siz
FREE
TrueChannel
Aleksey Ivanov
5 (7)
The TrueChannel   indicator shows us the true price movement channels. This indicator resembles Donchian Channel   in its appearance, but is built on the basis of completely different principles and gives (in comparison with Donchian Channel , which is better just to use to assess volatility) more adequate trading signals.              As shown in the article , the price actually moves in channels parallel to the time axis and jumps abruptly from the previous channels to the subsequ
FREE
该产品的买家也购买
Gann Made Easy
Oleg Rodin
4.92 (59)
Gann Made Easy 是一个专业且易于使用的外汇交易系统,它基于使用先生理论的最佳交易原则。 W.D.江恩。该指标提供准确的买入和卖出信号,包括止损和获利水平。您甚至可以使用推送通知在旅途中进行交易。 购买后请联系我!我将免费与您分享我的交易技巧和丰厚的红利指标! 您可能已经多次听说过江恩交易方法。通常 Gann 的理论不仅对于新手交易者而且对于那些已经有一定交易经验的人来说都是非常复杂的东西。这是因为江恩的交易方法在理论上并不那么容易应用。我花了几年时间来完善这些知识,并将最好的原则应用到我的外汇指标中。 该指标非常易于应用。您所需要的只是将其附加到您的图表并遵循简单的交易建议。该指标不断进行市场分析工作并寻找交易机会。当它检测到一个好的入口点时,它会为您提供一个箭头信号。该指标还显示止损和获利水平。 换句话说,当您像先生一样进行交易时,该指标会为您提供最佳江恩建议。江恩亲自告诉你此时此刻该做什么。但最好的部分是您不需要了解任何有关江恩交易原则的知识,因为该指标会为您完成整个市场分析工作。
使用我们的自定义MT4指标发现成功外汇交易的秘诀! 您是否曾经想过如何在外汇市场上取得成功,一贯赚取利润,同时降低风险? 这是您一直在寻找的答案! 允许我们介绍我们的专有MT4指标,该指标将彻底改变您的交易方法。 独特的多功能性 我们的指标专为喜欢Renko和Rangebar Candle编队的用户而设计。 我们了解到,这些图表类型受到许多经验丰富的交易者的青睐,这就是为什么我们的指标与它们无缝集成,从而提供无与伦比的市场分析。 清晰的趋势信号 忘记复杂的分析! 我们的指标利用鲜艳的色彩和清晰的点结构来明确指示市场趋势。 红色和蓝色的点毫无疑问地对价格变动的方向留下了疑问,从而可以在您的交易中快速决策。 与HH/HL HL/LL策略对齐 如果您正在寻求一个指标,该指标无缝地与基于HH/HL和HL/LL结构的策略无缝合作,则不需要更多。 我们的工具不仅确定了这些形式,而且还促进了它们在投资过程中的有效利用。 绝对的清晰度和简单性 我们的首要任务是为您提供一种不仅有效而且易于使用的工具。 我们的指标是为了清晰而设计的,使您可以专注于做出投资决策,而不是
Atomic Analyst
Issam Kassas
5 (3)
首先值得强调的是,该交易指标是非重绘、非延迟的指标,这使其成为手动和机器人交易的理想选择。 用户手册:设置、输入和策略。 Atomic Analyst是一种PA价格行动指标,利用价格的力量和动量来寻找市场上更好的机会。配备了高级过滤器,可帮助去除噪音和假信号,并提高交易潜力。使用多层复杂的指标,Atomic Analyst扫描图表,并将复杂的数学计算转化为任何初学者都能理解并用来做出一致交易决策的简单信号和颜色。 “Atomic Analyst”是专为新手和经验丰富的交易者量身定制的综合交易解决方案。它将高级指标和一流功能融合为一体的交易策略,使其成为所有类型交易者的多功能选择。 日内交易和剥头皮策略:专为快速准确的日内交易和短期交易而设计。 日内和摆动交易策略:可用作追求价格大幅波动的日内和摆动交易者的可靠工具。 多货币和市场:凭借其可靠的精度,在不同的工具和市场上运作。 多个时间框架:可在多个时间框架上使用,性能良好。 稳定性:所有指标均不重绘、不重绘和不滞后,确保可靠的信号。 信号清晰度:提供箭头信号,用于清晰的入场和出场点。 实时警报:通过交易入场、SL和TP警报通知交
Advanced Currency Strength28 Indicator
Bernhard Schweigert
4.9 (663)
目前26%的折扣 任何新手或专家交易者的最佳解决方案! 这个指标是一个独特的、高质量的、可负担得起的交易工具,因为我们纳入了一些专有的功能和一个新的公式。只需一个图表,你就可以读出28个外汇对的货币强度!想象一下,你的交易将如何得到改善,因为你的交易是在你的手中进行的。想象一下,你的交易将如何改善,因为你能够准确地确定新趋势或剥头皮机会的触发点? 用户手册:点击这里  https://www.mql5.com/en/blogs/post/697384 这是第一本,原版的! 不要买一个毫无价值的崇拜者的克隆品。 特别的 子窗口中的箭头显示强劲的货币势头GAP将指导你的交易! 当基础货币或报价货币处于超卖/超买区域(外盘斐波那契水平)时,在个人图表的主窗口中出现警告信号。 当货币力量从外围区间回落时,回撤/反转警报。 十字星模式的特别警报 可选择多个时间框架,以快速查看趋势! 货币强度线在所有的时间框架中都非常平稳,当使用较高的时间框架来识别总体趋势,然后使用较短的时间框架来确定精确的入口时,效果非常好。你可以根据自己的意愿选择任何时间框架。每个时间框架都由其自身进
Advanced Supply Demand
Bernhard Schweigert
4.92 (310)
现在优惠 33%! 任何新手或专业交易者的最佳解决方案! 该指标是一款独特、高质量、且价格合理的交易工具,因为我们已经整合了许多专有功能和新公式。 依据此更新,您将能够显示双重时间帧区域。 您不仅可以显示一个较高的时间帧,还可以同时显示图表时间帧,加上更高的时间帧:显示嵌套时区。 供需双方所有交易者都会喜欢它。 :) 重要信息披露 高级供需的最大潜力,请访问 https://www.mql5.com/zh/blogs/post/720245   想象您的交易如何得以改善,是因为您能够精准定位入场或目标位吗? 构建于新的底层算法,它可以更轻松地识别出买卖双方之间的潜在失衡。 这是因为它以图形方式展示供需最强劲区域,及其过去的表现(显示旧区域)。 这些功能旨在帮助您更轻松地发现最佳入场区域和价位。 现在您可以针对您的交易品种和时间帧来优化和编辑区域强度! 高级供需指标适用于所有产品和时间帧。 它是一个新的公式,非常新的功能是两个区域强度函数可由用户输入进行调整! 这在交易中是一大优势。 当您学习如何使用专有功能,例如带有价格游离最小 X 因子的区域强度时,您能够判断该区域强劲与否。 供
TPSpro RFI Levels
Roman Podpora
5 (13)
A key element in trading is zones or levels from which decisions to buy or sell a trading instrument are made. Despite attempts by major players to conceal their presence in the market, they inevitably leave traces. Our task was to learn how to identify these traces and interpret them correctly. Reversal First Impulse levels (RFI)   -  Version MT5                INSTRUCTIONS                 RUS                 ENG                                       R ecommended to use with an indicator   -  
Break and Retest
Mohamed Hassan
4.56 (9)
‍You can visually backtest Break & Retest to see how it behaved in the past!     Manual guide:   Click here $65  for only 1  copy left! Next price is $120 .  This Indicator only places quality trades when the market is really in your favor with a clear break and retest. Patience is key with this price action strategy! Recommended timeframes: M1 for Scalpers.  M15 for Intraday traders. H1 & H4 for Day traders. Other timeframes are also excellent! After many months of hard w
ON Trade Optuma Astro
Abdullah Alrai
5 (4)
当然可以!以下是您提供的文本的中文翻译: 引入 MT4 天文指标:您的终极天体交易伙伴 您准备好将交易体验提升到天文高度了吗?不用再寻找,就在我们的革命性 MT4 天文指标中。这个创新工具超越了传统的交易指标,利用复杂的算法提供无与伦比的天文洞察力和精确计算。 指尖上的宇宙信息: 瞻仰一个详尽的面板,展示了一宝藏般的天文数据。了解行星的地理/太阳心坐标,太阳/地球距离,亮度,伸长度,星座,黄道和赤道坐标,甚至是水平坐标——每个细节都经过精心计算并呈现得美轮美奂。指标生成的垂直线对应于时间值,为您的交易旅程提供了宇宙的视角。 行星线条与关系: 在您的图表上欣赏行星线条的魔力,具有可自定义的比例和角度。通过直观的控制面板轻松切换每个行星线条的可见性。通过连结、六分、四分、三分、对冲和逆行等指标,发现行星关系的艺术。在您选择的时间范围内探索这些宇宙构造,使您能够识别重要的交易机会。 揭示甘恩的智慧: 通过受甘恩启发的平方垂直线揭示潜在的反转时机。这种创新修改将甘恩历经考验的原则带入现实,帮助您提前了解市场的转向和趋势。 月亮引导: 在您的图表上优雅地导航月相,因为新月和满月点缀其间。月亮周期
Quantum Trend Sniper Indicator MT4
Bogdan Ion Puscasu
4.59 (39)
介绍   量子趋势狙击指标 ,突破性的 MQL5 指标,正在改变您识别和交易趋势反转的方式!由拥有超过13年交易经验的资深交易员团队开发,     量子趋势狙击指标   旨在通过其创新的方式以极高的准确度识别趋势反转,将您的交易之旅推向新的高度。 ***购买量子趋势狙击指标,即可免费获得量子突破指标!*** 当量子突破指标识别出趋势反转时,它会向您发出警报和信号箭头,并建议您三个止盈水平。 它既适合新手交易者,也适合专业交易者。 量子 EA 通道:       点击这里 MT5版本:       点击这里 建议: 时间范围:  所有时间范围。为了获得最佳结果,我们建议在 M15、M30 和 H1 时间范围内使用它。 货币对:欧元兑美元、英镑兑美元、澳元兑美元、欧元兑英镑, EURAUD, XAUUSD 账户类型:ECN、Raw 或 Razor,点差极低 经纪时间:任意 经纪商:IC Markets、Pepperstone with Raw 和 Razor 的点差最低 建议止损:50 点 建议止盈水平:20 点、50 点和 1
首先,值得强调的是,这个交易工具是非重绘、非重画和非滞后的指标,非常适合专业交易。 在线课程,用户手册和演示。 智能价格行动概念指标是一个非常强大的工具,既适用于新手,也适用于经验丰富的交易者。它将超过20个有用的指标合并到一个指标中,结合了高级交易思想,如内圈交易员分析和智能资金概念交易策略。该指标侧重于智能资金概念,提供有关大型机构交易方式的见解,帮助预测它们的动向。 它在流动性分析方面尤其擅长,有助于理解机构的交易方式。它擅长预测市场趋势,并仔细分析价格波动。通过将您的交易与机构策略对齐,您可以更准确地预测市场走向。该指标多才多艺,擅长分析市场结构,识别重要的订单区块,并识别各种模式。 它擅长识别BOS和CHoCH等模式,理解动量的转变,并突出显示供需强劲的关键区域。它还擅长发现强大的不平衡,并分析价格创造更高高点或更低低点的模式。如果您使用斐波那契回撤工具,该指标可以满足您的需求。它还可以识别相等的高点和低点,分析不同的时间框架,并通过仪表板显示数据。 对于使用更高级策略的交易者,该指标提供了工具,如公平价值差指标和优惠和折扣区域的识别。它特别关注高时间框架订单
on free demo press zoom out button to see back.. cnt number is bar numbers.you can change up to 3000 related to chart bars numbers. minimum value is 500. there is g value set to 10000. sometimes need to lower or increase. and if they need can make small change on it. this indicator almost grail,no repaint and all pairs ,all timeframe indicator. there is red and blue histograms. if gold x sign comes on red histogram that is sell signal. if blue x sign comes on blue histogram that is buy signal.
介绍 ON Trade Waves Patterns Harmonic Elliot Wolfe,这是一款高级指标,旨在使用手动和自动方法检测各种市场模式。以下是它的工作原理: 谐波模式: 该指标可以识别出现在您图表上的谐波模式。这些模式对于练习谐波交易理论的交易者非常重要,正如Scott Carney的书《谐波交易第1卷和第2卷》所描述的那样。无论您是手动绘制它们还是依赖自动检测,ON Trade Waves Patterns都可以胜任。 控制面板: 我们配备了一个用户友好的控制面板,它会保存您的图表和时间帧设置,使您可以轻松切换不同配置。您甚至可以最小化它以最大化图表空间。如果您更喜欢使用其他分析工具,只需单击关闭按钮即可隐藏所有指标数据。 模板保存: 当您自定义设置或添加其他指标,如移动平均线或布林带时,该指标会自动保存您的模板。这意味着您可以随时轻松加载您喜欢的设置。 优化显示: 对于Windows 10用户,我们建议调整您的DPI设置以获得高清设备上的最佳屏幕体验。右键单击MetaTrader图标,选择“兼容性”,然后选择“更改高DPI设置”,将其设置为“系统(增强)”。
TPSproTREND PrO
Roman Podpora
5 (15)
TPSpro TRENDPRO  - is a trend indicator that automatically analyzes the market and provides information about the trend and each of its changes, as well as giving signals for entering trades without redrawing! The indicator uses each candle, analyzing them separately. referring to different impulses - up or down impulse. Exact entry points into transactions for currencies, crypto, metals, stocks, indices!  -  Version MT5               DETAILED DESCRIPTION        /       TRADING SETUPS           
Scalper Vault
Oleg Rodin
5 (28)
Scalper Vault 是一个专业的剥头皮系统,为您提供成功剥头皮所需的一切。该指标是一个完整的交易系统,可供外汇和二元期权交易者使用。推荐的时间范围是 M5。 该系统为您提供趋势方向的准确箭头信号。它还为您提供顶部和底部信号以及江恩市场水平。无论您拥有何种交易经验,该系统都易于使用。您只需要遵循简单的规则并每天重复该过程。 建议将此系统用于主要货币对。感谢您的关注! 请注意,该指标在策略测试器中可能无法正常工作。因此,我建议仅在模拟或真实账户的真实交易条件下使用该系统。 指示器提供所有类型的警报,包括推送通知。 购买指标后请与我联系。我将免费与您分享我的个人交易建议和出色的奖励指标! 祝您交易愉快,盈利!
Advanced Currency IMPULSE with ALERT
Bernhard Schweigert
4.91 (494)
目前31%的折扣!! 对任何新手或专家交易者来说都是最好的解决方案! 这个指标是一个独特的、高质量的、负担得起的交易工具,因为我们已经纳入了一些专有的功能和一个秘密的公式。只需一张图表,它就能给出所有28种货币对的警报。想象一下,你的交易将如何改善,因为你能够准确地确定新趋势或剥头皮机会的触发点 建立在新的基础算法上,它使识别和确认潜在交易变得更加容易。这是因为它以图形方式显示了一种货币的强势或弱势是否正在加速,并测量了这种加速的速度--把它想象成你汽车中的速度表。当你加速时,事情显然会发生得更快,这在外汇市场上也是一样的,即如果你配对的货币正在向相反的方向加速,你就会发现一个潜在的有利可图的交易。 货币动量的垂直线和箭头将指导你的交易! 动态的市场斐波那契23水平被用作警报触发器,将适应市场活动。如果冲动触及黄色触发线,您将在MetaTrader或您的电子邮件或推送警报中收到警报。然后你就知道作为一个交易员应该做什么。货币对和方向已经给出。只要点击警报按钮,就可以切换到该货币对或打开一个新的图表,以便进一步分析。警报级别可以通过用户输入来改变,可以选择3个敏感度级别
Currency Strength Wizard
Oleg Rodin
4.91 (44)
货币强度向导是一个非常强大的指标,为您提供成功交易的一体化解决方案。该指标使用多个时间范围内所有货币的数据来计算这个或那个外汇对的力量。此数据以易于使用的货币指数和货币电力线的形式表示,您可以使用它们来查看这种或那种货币的力量。 您所需要的只是将指标附加到您要交易的图表上,该指标将向您显示您交易的货币的真实强度。该指标还向您显示买卖量压力的极值,您可以在顺势交易时利用这些压力。该指标还显示了基于斐波那契的可能目标。该指标可用于各种交易时间范围。该指标支持各种货币对的交易。 该指标为您提供所有类型的警报,包括推送通知。 购买后请联系我。我将与您分享我的交易技巧,并免费为您提供丰厚的红利指标! 祝您交易愉快,获利丰厚!
The BB Reversal Arrows technical trading system has been developed to predict reverse points for making retail decisions. The current market situation is analyzed by the indicator and structured for several criteria: the expectation of reversal moments, potential turning points, purchase and sale signals. The indicator does not contain excess information, has a visual understandable interface, allowing traders to make reasonable decisions. All arrows appear to close the candle, without redr
Up down v6T
Guner Koca
5 (1)
Thise indicator is up down v6  comes with tradingwiev pinescript. purchased people, after installed on terminal ,contact me on mql5  to get BONUS  TradingView pinescript. up-down indicator is no repaint and works all pairs and lower than weekly time frames charts. it is suitable also 1 m charts for all pairs. and hold long way to signal. dont gives too many signals. when red histogram cross trigger line that is up signal.and price probably will down when blue histogram cross trigger line that
Entry Points Pro
Yury Orlov
4.7 (225)
这是一款 MT4 的趋势指标,可提供准确的入场交易信号,且无重绘或延迟。 它可应用在任何金融资产:外汇、加密货币、贵金属、股票、指数。 最好的结果出现在 M15+ 的时间帧内。 指标的 MT5 版本 重要! 购买后请联系我,以便获取详细指南和奖励。 视频 (6:22) - 一个信号赢取的利润等于指标价格的三倍。 视频 (4:44) - 它如何在测试器中工作,我的提示和技巧。 视频 (1:44) - 有关它如何处理加密货币和指数的几句话。 大多数交易者在 Entry Points Pro 指标的帮助下,在第一个交易周内就改善了他们的交易结果。 Entry Points Pro 指标的益处 入场信号无重绘或延迟 如果信号出现,并得到确认(如果信号所在烛条已收盘),则它不会再消失;不像是重绘指标,它会导致重大的财产损失,因为它们可以在显示信号后再将其删除。 无差错开仓 指标算法可令您找到入场交易(买入或卖出资产)的理想时机,从而提高每位交易者的成功率。 Entry Points Pro 可操作任何资产 它允许您在 MT4 平台上交易任何经纪商提供的加密货币、股票、
目前八折优惠! 对任何新手或专家交易者来说都是最好的解决方案! 这个仪表板软件适用于28种货币对。它基于我们的两个主要指标(高级货币强度28和高级货币冲动)。它对整个外汇市场提供了一个伟大的概述。它显示高级货币强度值,货币运动速度和28个外汇对在所有(9)时间段的信号。想象一下,当你可以使用图表上的单一指标观察整个市场,以确定趋势和或剥头皮的机会时,你的交易将得到改善 我们已经在这个指标中建立了一些功能,使你更容易识别强势和弱势货币,同时识别和确认潜在的交易。该指标以图形方式显示货币的强势或弱势是增加还是减少,以及它在所有时间段的表现。 增加的新功能是动态市场斐波那契水平,它适应当前的市场条件变化,这是一个已经在我们的高级货币强度28和高级货币冲动指标中使用的成熟的加分项。 在交易时,总是将弱势货币和强势货币配对,这个新指标将帮助你做到这一点。 用户手册:点击这里  https://www.mql5.com/en/blogs/post/708783 特点  显示每个时间段的ACS28和GAP-speed(冲动)的货币强度值。 列:颜色代码以7种颜色
Symbols must be separated by commas (,) and entered into the parameters exactly as displayed by your broker to ensure they are recognized in the dashboard. These symbols will be used for analysis by the indicator. With one click open any pair any timeframe directly from dashboard The MA Speedometer Dashboard is a highly functional MetaTrader 4 (MT4) indicator designed to enhance trading strategies through dynamic market analysis. It offers robust features for identifying market trends, trading
TrendMaestro
Stefano Frisetti
5 (2)
note: this indicator is for METATRADER4, if you want the version for METATRADER5 this is the link:  https://www.mql5.com/it/market/product/108106 TRENDMAESTRO ver 2.4 TRENDMAESTRO recognizes a new TREND in the bud, he never makes mistakes. The certainty of identifying a new TREND is priceless. DESCRIPTION TRENDMAESTRO identifies a new TREND in the bud, this indicator examines the volatility, volumes and momentum to identify the moment in which there is an explosion of one or more of these data a
FX Power MT4 NG
Daniel Stein
5 (9)
通过 mql5 和 Telegram 上 的晨间简报获取每日市场更新,包括详细信息和屏幕截图 ! FX Power MT4 NG 是我们长期以来非常受欢迎的货币强度计算器 FX Power 的下一代产品。 这款下一代强度计算器能提供什么?您所喜爱的原版 FX Power 的所有功能 附加功能 黄金/XAU 强度分析 更精确的计算结果 可单独配置的分析周期 可自定义计算限制,以获得更好的性能 为希望查看更多信息的用户提供特殊的多实例设置 无尽的图形设置,可在每个图表中设置您最喜欢的颜色 无数的通知选项,让您再也不会错过任何重要信息 采用 Windows 11 和 macOS 风格的全新圆角设计 神奇的移动指标面板 FX Power 主要功能 所有主要货币的完整强势历史 所有时间框架内的货币强弱历史 所有经纪商和图表的计算结果完全相同 100% 可靠的实时计算 -> 无重绘 可通过下拉列表选择分析时段 通过自定义模式单独配置分析时段 可在一个图表中使用多个实例 可移动 FX Power 显示屏(通过拖放) 适用于高分辨率 QHD、UHD 和 4K 显示器 自动终端配置 针对平板电脑
IX Power MT4
Daniel Stein
5 (5)
IX Power 终于将 FX Power 的无与伦比的精确性带到了非外汇交易符号中。 它能准确判断您喜爱的指数、股票、商品、ETF 甚至加密货币的短期、中期和长期趋势强度。 您可以 分析 终端提供的 一切 。试试吧,体验一下您在交易时如何把握 时机 。 IX Power 主要功能 100% 精确的非重绘计算结果 - 适用于您终端中的所有交易符号 下拉式选择预配置以及可单独配置的强度分析周期 通过电子邮件、消息和手机通知的无数种通知选项 可访问的 EA 请求缓冲区 可自定义计算限制,以获得更好的性能 为希望查看更多信息的用户提供特殊的多实例设置 无尽的图形设置,让您在每个图表中都能找到最喜欢的颜色 采用 Windows 11 和 macOS 风格的圆角新面板设计 神奇的移动指标面板,可在子窗口和主图表之间无缝移动 适用于高分辨率 QHD、UHD 和 4K 显示器,并针对平板电脑和触摸屏进行了优化 IX Power 参数 最重要的参数不言自明,但我们很快会在另一篇文章中为您提供所有 IX Power 参数的完整说明。 使用别名 "参数可为技术交易
77% discount for the next 10 buyers (original price $605): 1 left 3 Indicators in 1 indicator Strategy based on price action Made specifically for the best forex currency pairs Can be used in the best time frame of the market at a very reasonable price This indicator is basically 3 different indicatos . But we have combined these 3 indicators in 1 indicator so that you can use 3 indicators at the lowest price. All three strategies are based on price action. But based on different trends.
Quantum Breakout Indicator PRO
Bogdan Ion Puscasu
4.96 (26)
介绍     Quantum Breakout PRO   ,突破性的 MQL5 指标,正在改变您交易突破区域的方式!   Quantum Breakout PRO 由拥有超过 13 年交易经验的经验丰富的交易者团队开发,旨在通过其创新和动态的突破区域策略将您的交易之旅推向新的高度。 量子突破指标将为您提供带有 5 个利润目标区域的突破区域的信号箭头,以及基于突破框的止损建议。 它既适合新手交易者,也适合专业交易者。 量子 EA 通道:       点击这里 MT5版本:   点击这里 重要的!购买后请私信我领取安装手册。 建议: 时间范围:M15 货币对:GBPJPY、EURJPY、USDJPY、NZDUSD、XAUUSD 账户类型:ECN、Raw 或 Razor,点差极低 经纪商时间:GMT +3 经纪商:IC Markets、Pepperstone with Raw 和 Razor 的点差最低 规格: 不重漆! 最多 5 个建议利润目标区域 建议止损水平 可定制的盒子。您可以设置自己的 Box Time Start 和 Box Time E
Scalper Inside PRO
Alexey Minkov
4.75 (57)
An exclusive indicator that utilizes an innovative algorithm to swiftly and accurately determine the market trend. The indicator automatically calculates opening, closing, and profit levels, providing detailed trading statistics. With these features, you can choose the most appropriate trading instrument for the current market conditions. Additionally, you can easily integrate your own arrow indicators into Scalper Inside Pro to quickly evaluate their statistics and profitability. Scalper Inside
PRO Renko System
Oleg Rodin
5 (25)
PRO Renko Arrow Based System for trading renko charts.  准确的信号交易任何外汇工具. 另外,我将免费提供系统的附加模块! PRO Renko系统是RENKO图表上高度准确的交易系统。该系统是通用的。 该交易系统可应用于各种交易工具。 该系统有效地中和了所谓的市场噪音,打开了获得准确反转信号的通道。 该指标易于使用,只有一个参数负责产生信号。 您可以很容易地使算法适应您感兴趣的交易工具和renko酒吧的大小。 我很乐意通过提供任何咨询支持来帮助所有客户有效地使用该指标。 祝您交易成功!购买后,立即写信给我! 我将与您分享我的建议和我的renko发电机。 另外,我将免费提供系统的附加模块!
TrendDecoder Premium
Christophe, Pa Trouillas
5 (3)
确定范围和下一步可能的走势   |  获得早期信号和趋势强度   |  在反转之前获得明确的退出   |  了解价格将测试哪些斐波水平 非重绘、非延迟指标 - 手动和自动交易的理想选择 - 适用于所有资产和所有时间单位 限时优惠 >>   50% OFF 购买后,  请联系我的频道  获取推荐设置 MT5   版本: 点击此处 使用   BladeSCALPER   和   PowerZONES   获取我们的完整方法 它是什么? TrendDECODER 集多种创新于一身,使趋势监测变得简单易行。 投射趋势线(Projective TrendLine)--快速参考即将到来的趋势 实时趋势线(RealTime TrendLine)与投射趋势线(Projective TrendLine)的对比 - 与之前的同方向走势相比,市场是加速还是放缓? 实时趋势线交叉 - 趋势正在偏离轨道 使用 GreyBox - 市场不再是趋势并进入新的过渡序列 使用 DecoderSignals 和 Blue/Orange Clouds - 利用作为动态支撑/阻力的 Blue/Orange
Quantum Heiken Ashi PRO MT4
Bogdan Ion Puscasu
4.43 (7)
介绍     Quantum Heiken Ashi PRO 图表 Heiken Ashi 蜡烛旨在提供对市场趋势的清晰洞察,以其过滤噪音和消除虚假信号的能力而闻名。告别令人困惑的价格波动,迎接更流畅、更可靠的图表表示。 Quantum Heiken Ashi PRO 的真正独特之处在于其创新公式,它将传统烛台数据转换为易于阅读的彩色条。红色和绿色条分别优雅地突出了看跌和看涨趋势,让您能够以非凡的精度发现潜在的进入和退出点。 量子 EA 通道:       点击这里 MT5版本:       点击这里 这一卓越的指标具有以下几个关键优势: 增强清晰度:通过平滑价格波动,Heiken Ashi 金条可以更清晰地反映市场趋势,使您更容易识别有利的交易机会。 减少噪音:告别经常导致错误信号的不稳定价格变动。 Quantum Heiken Ashi 指标可过滤噪音,使您能够做出更明智的交易决策 无缝集成:Heiken Ashi 指标专为 MetaTrader 开发,可无缝集成到您的交易平台中。它用户友好、高度可定制,并且与您的其他交易指标和过滤器兼容 无论您是寻求新优势的经验
作者的更多信息
SmartTradePanel
Muhammad Faisal Sagala
SmartTradePanel 是一种交易工具,可让交易者快速高效地执行订单。 凭借所提供的高级功能,SmartTradePanel 真正帮助交易者管理未结订单并优化其交易的利润潜力。 在本文中,我们将详细讨论 SmartTradePanel 的功能和优势。 SmartTradePanel 的主要功能之一是能够快速执行未结订单。 只需点击几下,交易者就可以快速高效地开立交易头寸。 这在快速变化的市场条件下尤其有用,因为执行速度可能是获利的决定性因素。 除此之外,SmartTradePanel 还允许交易者下达锁定订单。 锁定订单是一种交易策略,其目的是锁定亏损头寸,希望该头寸在未来反转并产生利润。 借助 SmartTradePanel,交易者只需点击几下即可轻松下达锁定订单。 除了订单执行和锁定订单外,SmartTradePanel 还允许交易者关闭任何类型的订单并关闭所有未平仓订单。 这在交易者希望通过快速平仓部分或全部头寸来获利或减少损失的情况下特别有用。 手数设置也可以从输入参数中更改。 在外汇交易中,手数是交易头寸的大小。 通过启用手数设置,SmartTrad
TradingPanelPlusCopier
Muhammad Faisal Sagala
与类似的交易面板相比,该交易面板具有许多优势,包括: 1. 立即(市场)开立订单并以所需价格挂单。 2. TakeProfit (TP), StopLoss(SL), 以及TrailingStop(TS) 设置,可以在pip 或point 模式下设置。 3. 您可以只关闭市价订单,或只关闭挂单,或所有市价订单和挂单。 4. 还配备了 CopyTrade,作为主控打开的订单可以作为客户端复制到面板,其中可以从客户端设置手数比例值。 立即拥有此 TradingPanelPlusCopier 以促进您的交易活动。 TradingPanelPlusCopier的使用方法和demo可以在说明中的视频demo中看到。 问候利润! 与类似的交易面板相比,该交易面板具有许多优势,包括: 1. 立即(市场)开立订单并以所需价格挂单。 2. TakeProfit (TP), StopLoss(SL), 以及TrailingStop(TS) 设置,可以在pip 或point 模式下设置。 3. 您可以只关闭市价订单,或只关闭挂单,或所有市价订单和挂单。 4. 还配备了 CopyTrade,作为
SmartFastTrade AI
Muhammad Faisal Sagala
Transform Your Trading with SmartFastTrade AI: Speed and Ease at Your Fingertips! Introduction Are you a trader struggling with slow order execution? Do you want a tool that can assist you in making quick and accurate trading decisions? If yes, then SmartFastTrade AI is the answer to all your trading needs. With its unique combination of speed, user-friendliness, and advanced features, SmartFastTrade AI will help you unlock your full trading potential. Let's delve deeper into why this innovativ
RtcSpectra5
Muhammad Faisal Sagala
Attention :   Please send a message to us if you still don't understand and are expected to follow the recommended capital size, lots size value, and one of the brokers whose portfolio we display. " For those of you who buy RTC Spectra products by ignoring our recommendations, you don't need to provide bad testimonials for your own mistakes!".  The Expert Advisor (EA) named "RTC Spectra" is designed for the long term with good and consistent results. This EA has been proven to perform very well
RtcDERIV
Muhammad Faisal Sagala
您想在 Deriv.com 上安全、快速、有效地进行交易吗? 您是否尝试过各种策略但没有找到合适的策略? 别担心,我们有办法! RtcDERIV 是专为 Deriv.com 设计的最新智能交易系统,它结合了剥头皮和 mar 策略,在过去一年中成功获得了超过 10,000% 的利润。 RtcDERIV 的优势之一是它在 Volatility Index 上的使用,尤其是 Volatility Index 25,目前确实非常好。 在 Deriv 上交易还具有 7x24 无休假的优势,因此您可以随时最大化利润。 RtcDERIV 已在 Metatrader 5 Deriv 平台上运行,默认设置为 0.5 手,足以以 500 美元开始交易。 但是,为了您的安全,我们建议您从 1000 美元开始。 回撤率低至 1.75% 左右,您可以在交易中感到更安全。 我们对 RtcDERIV 进行了一年多的回测,结果令人印象深刻。 一年之内,我们仅用500美元的资金就取得了超过10,000%的利润! 这证明了我们的策略是多么有效。 查看我们所做的回测组合,您也可以在提供的演示试用版中进行。
筛选:
无评论
回复评论