• 概要
  • レビュー
  • コメント

MACD Spectra

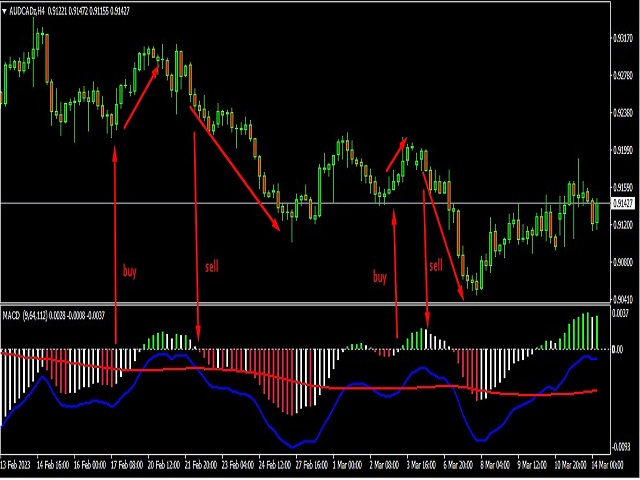
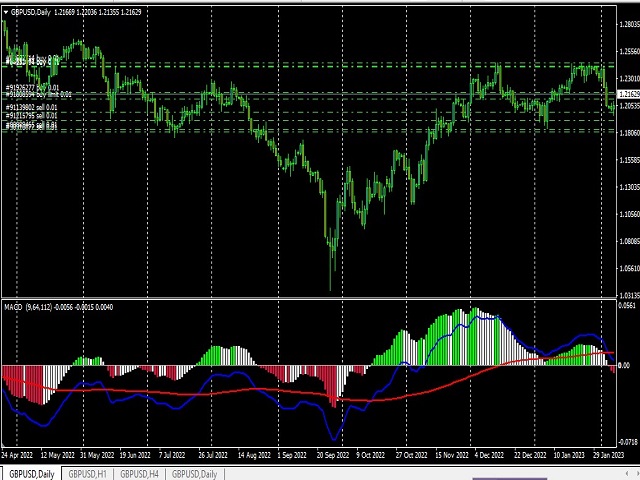
MACD Spectra、シンプルだが収益性の高い取引指標! このインジケーターは、すべての時間枠とすべての通貨ペアで使用できます。 90% を超える精度で、このインジケーターは、取引活動を支援するための最良のインジケーターを探している初心者とプロのトレーダーの両方に最適です。 ヒストグラムの色、ヒストグラムの位置、シグナルと MACD ラインの位置に従うだけで、簡単に市場に出入りできます。 これ以上待たずに、MACD Spectral と一緒に安定した利益を獲得しましょう。

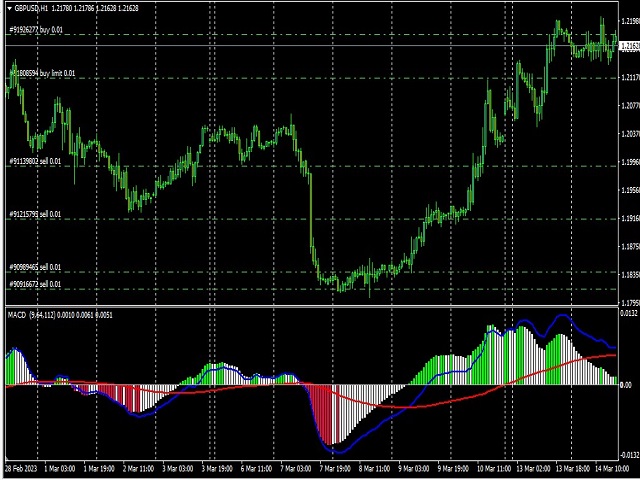
エントリーとエグジットの場合、インジケーターの読み取りは非常に簡単です。

  1. 青色の線が赤色の線と交差し、交点がゼロ ラインより下にあり、表示されるヒストグラムがバー 2 で赤色の場合、白いヒストグラムが表示されたときに売りエントリーと終了の強いシグナルです。
  2. 青色の線が赤色の線と交差し、交点がゼロ ラインの上にあり、表示されるヒストグラムがバー 2 で緑色の場合、白いヒストグラムが表示されたときに、買いエントリーとエグジットの強いシグナルです。
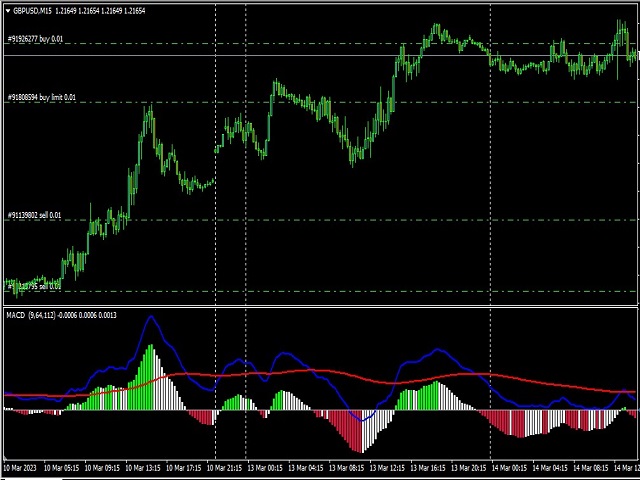
  3. 0 以下の赤のヒストグラムの後に白のヒストグラムが表示されたら、買いポジションを取り、バー 2 のヒストグラムでの確認として、白のヒストグラムが 0 の上に表示されたら、買いエントリーと決済を行います。
  4. 0 を超える緑のヒストグラムの後に白のヒストグラムが表示されたら売りポジションを取り、売りエントリーのバー 2 のヒストグラムの確認として、白のヒストグラムが 0 より下に表示されたら終了します。


おすすめのプロダクト
The indicator detects and displays Shark harmonic pattern (see the screenshot). The pattern is plotted by the extreme values of the ZigZag indicator (included in the resources, no need to install). After detecting the pattern, the indicator notifies of that by a pop-up window, a mobile notification and an email. The indicator highlights the process of the pattern formation and not just the complete pattern. In the former case, it is displayed in the contour triangles. After the pattern is comple
30 USD
RSI TrendLine Divergency Message is an indicator for the MetaTrader 4 trading platform. Unlike the original indicator, this three in one version has a system of alerts that inform on market situation changes. It consists of the following signals: when the Main line crosses the levels of extreme zones and 50% level; when the Main line crosses the Trend line in the indicator window; divergence on the last bar. Parameters of levels of extremum, 50-level and divergence are adjustable. Parameters L
30 USD
This indicator is based on the Bollinger Bands on one or more timeframes and on any Currency Cross Pair. The indicator generates an alert message when it detects a buy or sell signal. It also draws a vertical bar on the price chart: green for buy or red for sell, white if flat. Alert messages and Vertical bars for BUY or SELL, are generated when the Bollinger Bands is consistent for all chosen timeframes else a FLAT signal is generated. In addition, the Multi TimeFrames Bollinger Bands Signals i
50 USD
無限からの通貨の強さを測定するためのこの革新的な指標は、長い間取引されているダフ屋やトレーダーにとって不可欠な助手です。 通貨の強さ/弱さを分析するためのシステムは、世界の主要なトレーダーによって市場で長い間知られており、使用されてきました。 任意の裁定取引は、この分析なしでは完全ではありません。 私たちの指標は、互いに関連して基本通貨の強さを簡単に決定します。 これは、インスタント分析を可能にし、最強のエントリポイントを検索し、すべてまたは現在の通貨ペアの折れ線グラフが表示されます。 インジケータは直感的で、すぐに見つけて任意のペアに切り替えることができ、地下室とメインチャートの両方に配置できるモバイルパネルがあります。 通貨の強さの変化の通知のタイマーモードは、トレーダーに電話で通知を受け取る機会を与えます。  通貨パワーメーターインフィニティ指標を使用するためのいくつかの戦略: 1. 通貨の強さの線形表示のチャートを使用して、交差点を新興トレンドの信号として検索します 2. トレンド反転信号が表示された後、強い通貨の方向に頭皮 3. 通貨の強さの発散分析を使用して、
49 USD
Introducing the Consecutive Green/Red Candle Alert Indicator for MT4 - Your Trend Spotting Companion! Are you ready to take your trading to the next level? We present the Consecutive Green/Red Candle Alert Indicator, a powerful tool designed to help you spot trends and potential reversals with ease. Whether you're a new trader looking for clarity in the market or an experienced pro seeking additional confirmation, this indicator is your trusted companion. Key Features of the Consecutive Green/Re
FREE
BE auto
Muhammad Ridzuan Mohd Radzali
5 (2)
Indicator automatically draw bullish and bearish engulfing without any rules. Bearish and Bullish engulf is well known area for supply and demand area marking. This indicator can be used in any strategy that required supply demand zone. Show Last Engulf : Enable this option to show unfresh engulfing  Candle to calculate : set 0 will load all history bar and can use up more memory Bearish Engulfing Colour : Pick any colour that suit Bearish Engulfing Colour  : Pick any colour that suit -Use thi
FREE
The indicator displays signals according to the strategy of Bill Williams on the chart. Demo version of the indicator has the same features as the paid, except that it can work only on a demo account . Signal "First Wise Man" is formed when there is a divergent bar with angulation.  Bullish divergent bar - with lower minimum and closing price in the upper half. Bearish divergent bar - higher maximum and the closing price at the bottom half. Angulation is formed when all three lines of Alligat
FREE
The Trend Map indicator is designed to detect trends in price movement and allows you to quickly determine not only the direction of the trend, but also to understand the levels of interaction between buyers and sellers. It has no settings and therefore can be perceived as it signals. It contains only three lines, each of which is designed to unambiguously perceive the present moment. Line # 2 characterizes the global direction of the price movement. If we see that the other two lines are above
45 USD
トレンドトレーディング は、タイミングのプルバックとブレイクアウトにより、市場で起こっているトレンドから可能な限り利益を得るように設計された指標です。確立されたトレンドの中で価格が何をしているかを分析することにより、取引の機会を見つけます。 [ インストールガイド | 更新ガイド | トラブルシューティング | よくある質問 | すべての製品 ] 自信を持って効率的に金融市場を取引する むち打ちにならずに確立されたトレンドから利益を得る 収益性の高いプルバック、ブレイクアウト、早期の逆転を認識する この指標は、独自の品質とパフォーマンスを分析します 複数時間枠のダッシュボードを実装します インジケーターは再描画されていません 電子メール/音声/視覚アラートを実装します 確立されたトレンドは多くの取引機会を提供しますが、ほとんどのトレンド指標はそれらを完全に無視しています。インジケーターの解釈はかなり簡単です: (1) トレンドの変化 (2) トレンドの方向への後退 (3) トレンドの方向へのブレイクアウト 赤いダッシュ は下降トレンド中の修正です 青いダッシュ は上昇ト
249 USD
PZ The Zone
PZ TRADING SLU
4.25 (4)
This indicator displays buy or sell signals according to Bill Williams' definition of the Trading Zone. [ Installation Guide | Update Guide | Troubleshooting | FAQ | All Products ] Easy to use and understand Avoid trading flat markets Deterministic indicator with clear rules The indicator is non-repainting It implements alerts of all kinds It has straightforward trading implications. A blue arrow is a buy signal A red arrow is a sell signal According to Bill Williams trading in the zone helps to
FREE
This is a combination of multiple oscillators into a single divergence system that creates the impression of a more reliable divergence indicator. It is multi-currency based and works best on 15 minutes timeframe and above. Every time a signal is generated, it shows an alert to the user. It is more ideal if combined with other price action indicators or trading systems.
50 USD
Trend PA
Mikhail Nazarenko
5 (3)
The Trend PA indicator uses   Price Action   and its own filtering algorithm to determine the trend. This approach helps to accurately determine entry points and the current trend on any timeframe. The indicator uses its own algorithm for analyzing price changes and Price Action. Which gives you the advantage of recognizing, without delay, a new nascent trend with fewer false positives. Trend filtering conditions can be selected in the settings individually for your trading style. The indicator
55 USD
標準パラメーターを使用したMACDインジケーター波に基づく 最後と最後の2つのMACDウェーブで、それぞれ正と負のフィボナッチレベルを扱います。 現時点でMACDインジケーターで負の波が終了している場合、色は緑です。 現時点でMACDインジケーターの正の波が終了している場合、色は赤です。 Waveの終了基準は、MACDの符号が異なる2ティックです。 最後の4つのMACDウェーブのトレンドラインをプロットします。 専門家とうまく働く  その他のスクリーンショット: Figures MACD   https://www.mql5.com/ru/market/product/42031 https://www.mql5.com/en/charts/10581596/audusd-h1-alpari-international https://www.mql5.com/en/charts/10631979/usdjpy-m1-alpari-international https://www.mql5.com/en/charts/10628704/gbpusd-
30 USD
Classic indicator. The Fractals indicator analyzes the price patterns that form on the candlestick chart and display the reversal points of the market trend. The indicator consists of candles, the middle of which is either the highest (up fractal) or the lowest (down fractal). Highs and lows, indicated by the indicator on the chart, are recommended to be taken as points that form support and resistance lines. Unlike the original indicator, where fractals are formed by five candles (high/low in t
FREE
This indicator is the undisputed leader among the indicators. And for this statement there is a good reason. The indicator builds a very high quality channel in which it generates signals to enter! What is the ideal strategy for the trader, since the trader always hesitates when choosing a strategy for the job. That is, this indicator will allow you to solve the dilemma of choosing a job by trend or to the channel, since it combines these two basic concepts. Working with the indicator is very
79 USD
インディケータは現在のクオートを作成し、これを過去のものと比較して、これに基づいて価格変動予測を行います。インジケータには、目的の日付にすばやく移動するためのテキスト フィールドがあります。 オプション: シンボル - インジケーターが表示するシンボルの選択; SymbolPeriod - 指標がデータを取る期間の選択; IndicatorColor - インジケータの色; HorisontalShift - 指定されたバー数だけインディケータによって描画されたクオートのシフト; Inverse - true は引用符を逆にします。false - 元のビュー。 ChartVerticalShiftStep - チャートを垂直方向にシフトします (キーボードの上下矢印)。 次は日付を入力できるテキストフィールドの設定で、「Enter」を押すとすぐにジャンプできます。
55 USD
PZ Super Trend
PZ TRADING SLU
4.24 (42)
A top-quality implementation of the famous Super Trend indicator, which needs no introduction. It is completely loyal to the original algorithm, and implements many other useful features such as a multi-timeframe dashboard.  [ Installation Guide | Update Guide | Troubleshooting | FAQ | All Products ] Easy to trade It implements alerts of all kinds It implements a multi-timeframe dashboard It is non-repainting and non-backpainting Input Parameters ATR Period - This is the average true range peri
FREE
Charles Henry Dow felt that if the industrial average and the railroad average both moved in the same direction, it meant that a meaningful economic shift was occurring. In brief, this indicator bases on the Dow's theory. It can create an index of market symbols, almost anythings index. For example: Index of the Euro, Index of the Great Britain Pound, Index of the Japanese Yen, Index of the Swiss Franc, Index of the Gold, Index of the New Zealand Dollar, Index of the Australian Dollar, Index of
30 USD
Convergence is when the higher highs and higher lows of an uptrend are also confirmed by our indicator making lower lows which helps us confirm that momentum is increasing and so the trend is likely to continue. Vice versa for a downtrend. Divergence is when we get higher highs on an uptrend but which are not supported by our indicator which makes lower highs and therefore signals the underlying momentum is failing and so a reversal might occur. Vice versa for downtrend. I have combined these me
30 USD
Charles Henry Dow felt that if the industrial average and the railroad average both moved in the same direction, it meant that a meaningful economic shift was occurring. In brief, this indicator bases on the Dow's theory. It can create an index of market symbols, almost anythings index. For example: Index of the Euro, Index of the Great Britain Pound, Index of the Japanese Yen, Index of the Swiss Franc, Index of the Gold, Index of the New Zealand Dollar, Index of the Australian Dollar, Index of
30 USD
The indicator displays the data of the Stochastic oscillator from a higher timeframe on the chart. The main and signal lines are displayed in a separate window. The stepped response is not smoothed. The indicator is useful for practicing "manual" forex trading strategies, which use the data from several screens with different timeframes of a single symbol. The indicator uses the settings that are identical to the standard ones, and a drop-down list for selecting the timeframe. Indicator Parame
30 USD
A professional tool for trading - the divergence indicator between the RSI and the price, which allows you to receive a signal about a trend reversal in a timely manner or catch price pullback movements (depending on the settings). The indicator settings allow you to adjust the strength of the divergence due to the angle of the RSI peaks and the percentage change in price, which makes it possible to fine-tune the signal strength. The indicator code is optimized and is tested very quickly as par
FREE
This product is a part of  ON Trade Waves Patterns Harmonic Elliot Wolfe you can test free version on EURJPY from this link  Wolf Waves Indicator ウルフウェーブを発見しよう - あなたの究極の取引ツール! どんな時間軸でも簡単にウルフウェーブを見つけるための強力なツールを探していますか?もう探す必要はありません!私たちのウルフウェーブインジケーターは、その仕事を簡単にこなします。なぜこのインジケーターがあなたにぴったりか、以下でご紹介します。 主な特徴: 自動検出: ウルフウェーブインジケーターは、複雑なアルゴリズムを使用して、チャート上のキーポイントを自動的に見つけ、対応するラインを描画します。手動でパターンを探す手間が不要です。 使いやすさ: このインジケーターはシンプルなデザインで、経験豊富なトレーダーからウルフウェーブ初心者まで、誰でも簡単に利用できます。 高精度: 数多くのウルフウェーブインジケーターの中で、当社のものは完璧
38.20 USD
The indicator displays the signals of the RSX oscillator on the price chart. (To display these signals in a separate window, along with the oscillator, another indicator is used -  RSX Osc 4 AM ). It is optimal to use the indicator signals as signals to open a trade when the price overcomes the maximum or minimum of the bar at which the signal was given. An opposite signal cancels the previous signal. Settings: Data period for indicator calculation - data period for indicator calculation; Data
FREE
MACD Trend EA
Lachezar Krastev
4 (1)
MACD Trend EA is based on the popular forex indicator MACD (Moving Average Convergence Divergence). It is fully automated trading expert advisor and completely FREE!  As the name suggests, this expert advisor uses a trend-following strategy and uses the MACD indicator to detect the beginning of uptrends and downtrends. MACD Trend EA Top Features - Trend Following Strategy - Money Management - Advanced Exit System + TP and SL  - Trailing Stop System - Broker protection System - Custom Magic
FREE
インジケータは、チャート上の端子RSI発振器に基づく信号を示しています。 繰り返し信号をフィルタリングすることができます。 ここでは、発振器は逆信号を検索するために使用されます。 これは、レベルからスイング戦略や取引のエントリポイントとして推奨されます。 マルチ通貨ダッシュボードが利用可能です。 それを使用すると、簡単にチャートを切り替えることができます。 製品のディスカッションでは、ダッシュボードを埋め込むことができるアルゴリズムを提案できます。 入力パラメータ 主な設定 Bars Count – インジケータが動作する履歴バーの数 RSI Period – オシレーター周期 RSI Level – オシレータのレベル。 発振器は0と100の間に行きます。 10を選択すると、信号は10以上90以下になります RSI Applied Price Repeat Signal - 繰り返し信号 Enable – すべての繰り返し信号は、矢印/アイコンで表示されます No Signal – 繰り返されるものはすべて無視されます 視覚的な矢印 Sell Code – Se
FREE
The TrueChannel   indicator shows us the true price movement channels. This indicator resembles Donchian Channel   in its appearance, but is built on the basis of completely different principles and gives (in comparison with Donchian Channel , which is better just to use to assess volatility) more adequate trading signals.              As shown in the article , the price actually moves in channels parallel to the time axis and jumps abruptly from the previous channels to the subsequ
FREE
Italo Trend Indicator
Italo Santana Gomes
4.76 (34)
BUY INDICATOR AND GET EA FOR FREE AS A BONUS + SOME OTHER GIFTS! ITALO TREND INDICATOR  is the best trend indicator on the market, the Indicator works on all time-frames and assets, indicator built after 7 years of experience on forex and many other markets. You know many trend indicators around the internet are not complete, does not help, and it's difficult to trade, but the Italo Trend Indicator is different , the Italo Trend Indicator shows the signal to buy or sell, to confirm the signal t
65 USD
このプロダクトを購入した人は以下も購入しています
現在26%オフ 初心者やエキスパートトレーダーに最適なソリューション! このインジケーターは、独自の機能と新しい計算式を取り入れた、ユニークで高品質、かつ手頃な価格のトレーディングツールです。たった1枚のチャートで28の為替ペアの通貨強度を読み取ることができます。新しいトレンドやスキャルピングチャンスの引き金となるポイントを正確に特定することができるので、あなたのトレードがどのように改善されるか想像してみてください。 ユーザーマニュアルはこちら  https://www.mql5.com/en/blogs/post/697384 これが最初の1本、オリジナルだ! 価値のないクローンを買わないでください。 特別な サブウィンドウの矢印で強い通貨の勢いを表示 GAPがあなたのトレードを導く! 基準通貨や気配値が売られすぎ・買われすぎのゾーン(外相フィボナッチレベル)にあるとき、個別チャートのメインウィンドウに警告表示。 通貨がレンジの外側から反落した場合、プルバック/リバーサルのアラート。 クロスパターンの特別なアラート 複数の時間枠を選択可能で、トレンドを素早く
148 USD
Advanced Supply Demand
Bernhard Schweigert
4.91 (304)
現在33%オフ 初心者にもエキスパートトレーダーにも最適なソリューション このインジケーターは独自の機能と新しい公式を多数内蔵しており、ユニークで高品質かつ手頃な取引ツールです。このアップデートでは、2つの時間枠ゾーンを表示できるようになります。より長いTFだけでなく、チャートTFとより長いTF(ネストゾーンを表示)の両方を表示できます。すべてのSupply Demandトレーダーの皆さんのお気に召すはずです。:) 重要情報の公開 Advanced Supply Demandの可能性を最大化するには、 https://www.mql5.com/ja/blogs/post/720245 にアクセスしてください。   エントリーまたはターゲットの正確なトリガーポイントを正確に特定できれば取引がどのように改善されるか想像してみてください。新しい基盤となるアルゴリズムに基づいて構築されているため、買い手と売り手の間の潜在的な不均衡をさらに簡単に特定できます。これは、最も強い需要と供給のゾーンと、過去のパフォーマンス(古いゾーンを表示)がグラフィカルに表現されるためです。これらの機能は、最適
148 USD
ご紹介     Quantum Breakout PRO は 、ブレイクアウト ゾーンの取引方法を変革する画期的な MQL5 インジケーターです。 13年以上の取引経験を持つ経験豊富なトレーダーのチームによって開発された Quantum Breakout PROは 、革新的でダイナミックなブレイクアウトゾーン戦略により、あなたの取引の旅を新たな高みに押し上げるように設計されています。 クォンタム ブレイクアウト インジケーターは、5 つの利益ターゲット ゾーンを備えたブレイクアウト ゾーン上のシグナル矢印と、ブレイクアウト ボックスに基づいたストップロスの提案を提供します。 初心者トレーダーにもプロのトレーダーにも適しています。 量子EAチャネル:       ここをクリック MT5バージョン:   ここをクリック 推奨事項: 時間枠: M15 通貨ペア: GBPJPY、EURJPY、USDJPY、NZDUSD、XAUUSD アカウントの種類: ECN、Raw、またはスプレッドが非常に低い Razor ブローカー時間: GMT +3 ブローカー : IC
99.99 USD
mql5と Telegramの モーニング・ブリーフィングで、詳細とスクリーンショットを含む毎日のマーケット・アップデートをご覧 ください! FX Power MT4 NGは 、長年の人気を誇る通貨強度計FX Powerの次世代モデルです。 この次世代ストレングスメーターは何を提供するのでしょうか?初代FXパワーの魅力すべて プラス GOLD/XAUの強さ分析 より正確な計算結果 個別に設定可能な分析期間 カスタマイズ可能な計算上限値により、さらに優れたパフォーマンスを実現 もっと見たい人のための特別なマルチインスタンス設定 すべてのチャートでお好みの色を無限に設定可能 数え切れないほどの通知オプションにより、重要なことを見逃すことはありません。 Windows 11とmacOSのスタイルで角を丸くした新しいデザイン 魔法のように動くインジケーターパネル FXパワーの主な機能 すべての主要通貨の強さの完全な履歴 すべての時間枠における通貨の強さの履歴 すべてのブローカーとチャートで同一の計算結果 100%信頼できるリアルタイム計算 -> リペイントなし ドロップダウン・リストから
169 USD
現在31%オフ! 初心者やエキスパートトレーダーに最適なソリューション! このインジケータは、独自の機能と秘密の数式を組み込んだ、ユニークで高品質かつ手頃な価格のトレーディングツールです。たった1枚のチャートで28の通貨ペアのアラートを表示します。新しいトレンドやスキャルピングチャンスの引き金となるポイントを正確に把握することができるので、あなたのトレードがどのように改善されるか想像してみてください! 新しい基本的なアルゴリズムに基づいて構築されているため、潜在的な取引の特定と確認がより簡単になります。これは、通貨の強さや弱さが加速しているかどうかをグラフィカルに表示し、その加速のスピードを測定するためです。加速すると物事は明らかに速く進みますが、これはFX市場でも同じです。つまり、反対方向に加速している通貨をペアにすれば、利益を生む可能性のある取引を特定することができるのです。 通貨の勢いを示す縦の線と矢印は、あなたの取引の指針となるでしょう。 ダイナミックマーケットフィボナッチ23レベルはアラートトリガーとして使用され、市場の動きに適応します。もしインパルスが黄色
88 USD
TrendMaestro
Stefano Frisetti
5 (1)
note: this indicator is for METATRADER4, if you want the version for METATRADER5 this is the link: TRENDMAESTRO recognizes a new TREND in the bud, he never makes mistakes. The certainty of identifying a new TREND is priceless. DESCRIPTION TRENDMAESTRO identifies a new TREND in the bud, this indicator examines the volatility, volumes and momentum to identify the moment in which there is an explosion of one or more of these data and therefore the moment in which prices have strong probability of f
397 USD
IX Powerは 、FX Powerの無敵の精度をついにFX以外のシンボルにも提供します。 お気に入りの指数、株式、コモディティ、ETF、さらには暗号通貨の短期、中期、長期のトレンドの強さを正確に判断します。 お使いの端末が提供する すべてを分析する ことができます。ぜひお試しいただき、取引 タイミングが大幅に改善 されることをご体験ください。 IXパワーの主な特徴 100%正確で再描画されない計算結果 - ターミナルで利用可能なすべての取引シンボルに対して 予め設定され、さらに個別に設定可能な強度分析期間のドロップダウン選択 Eメール、メッセージ、モバイル通知による無数の通知オプション EAリクエストのためのアクセス可能なバッファ カスタマイズ可能な計算制限により、さらに優れたパフォーマンスを実現 もっと見たい人のための特別なマルチインスタンス設定 すべてのチャートでお好みの色を無限に設定可能 Windows 11とmacOSのスタイルで角を丸くした新しいパネルデザイン サブ・ウィンドウとメイン・チャートの間をシームレスに移動する、魔法のように動く
99 USD
TPSpro TRENDPRO  - is a trend indicator that automatically analyzes the market and provides information about the trend and each of its changes, as well as giving signals for entering trades without redrawing! The indicator uses each candle, analyzing them separately. referring to different impulses - up or down impulse. Exact entry points into transactions for currencies, crypto, metals, stocks, indices!  -  To maximize the potential and learn how to trade using this indicator, read the full d
135 USD
今、147ドル(いくつかの更新後に499ドルに増加します) - 無制限のアカウント(PCSまたはMac) RelicusRoad ユーザー マニュアル + トレーニング ビデオ + プライベート Discord グループへのアクセス + VIP ステータス 市場の新しい見方 RelicusRoad は、外国為替、先物、暗号通貨、株式、および指数の世界で最も強力な取引インジケーターであり、トレーダーに収益を維持するために必要なすべての情報とツールを提供します。初心者から上級者まで、すべてのトレーダーが成功するためのテクニカル分析と取引計画を提供します。これは、将来の市場を予測するのに十分な情報を提供する重要な取引指標です。意味をなさないチャート上のいくつかの異なる指標ではなく、完全な解決策を信じています.これは、信号、矢印 + 価格アクション情報を表示するオールインワンのインジケーターで、他に類を見ない非常に正確です。 強力な AI に基づいて、RelicusRoad は不足している情報とツールを提供して、あなたを教育し、トレーディングのプロ、成功したトレーダーにします。
147 USD
現在20%OFF! 初心者やエキスパートトレーダーのためのベストソリューション! このダッシュボードソフトウェアは、28の通貨ペアで動作しています。それは私達の主要な指標(高度な通貨の強さ28と高度な通貨インパルス)の2に基づいています。それは全体の外国為替市場の大きい概観を与えます。それは、すべての(9)時間枠で28の外国為替ペアのための高度な通貨の強さの値、通貨の動きの速度と信号を示しています。チャート上で1つのインディケータを使用して市場全体を観察し、トレンドやスキャルピングの機会をピンポイントで見つけることができたら、あなたのトレードがどのように改善されるか想像してみてください。 このインディケータには、強い通貨と弱い通貨の識別、潜在的な取引の識別と確認がより簡単になるような機能が搭載されています。このインディケータは、通貨の強さや弱さが増加しているか減少しているか、また、すべての時間枠でどのように機能しているかをグラフィカルに表示します。 新機能として、現在の市場環境の変化に適応するダイナミックなマーケットフィボナッチレベルが追加され、すでに当社のAdvan
199 USD
ご紹介   クォンタム トレンド スナイパー インジケーターは 、トレンド反転を特定して取引する方法を変革する画期的な MQL5 インジケーターです。 13年以上の取引経験を持つ経験豊富なトレーダーのチームによって開発されました。     クォンタムトレンドスナイパーインジケーター   は、非常に高い精度でトレンドの反転を識別する革新的な方法で、あなたのトレーディングの旅を新たな高みに押し上げるように設計されています。 ***Quantum Trend Sniper Indicatorを購入すると、Quantum Breakout Indicatorを無料で入手できます!*** クォンタム ブレイクアウト インジケーターは、トレンドの反転を特定するとアラートを発し、矢印を示し、3 つのテイクプロフィットレベルを提案します。 初心者トレーダーにもプロのトレーダーにも適しています。 量子EAチャネル:       ここをクリック MT5のバージョン:       ここをクリック 推奨事項: 期間: すべての時間枠。最良の結果を得るには、
99.99 USD
の紹介     Quantum平均足PRO チャート 市場のトレンドに対する明確な洞察を提供するように設計された平均足キャンドルは、ノイズを除去し、誤ったシグナルを排除する能力で知られています。混乱を招く価格変動に別れを告げ、よりスムーズで信頼性の高いチャート表現を導入しましょう。 Quantum Heiken Ashi PRO を真にユニークなものにしているのは、従来のローソク足データを読みやすい色のバーに変換する革新的なフォーミュラです。赤と緑のバーはそれぞれ弱気トレンドと強気トレンドをエレガントに強調し、潜在的なエントリーポイントとエグジットポイントを驚くほど正確に見つけることができます。 量子EAチャネル:       ここをクリック MT5のバージョン:       ここをクリック この注目すべき指標には、いくつかの重要な利点があります。 明確性の向上: 価格変動を平滑化することで、平均足バーは市場トレンドをより明確に表現し、有利な取引機会を特定しやすくします。 ノイズの削減: 誤ったシグナルを引き起こすことが多い不安定な価格変動に別れを告げます。 Quan
99.99 USD
Gann Made Easy は、ミスター・ギャンの理論を使用した取引の最良の原則に基づいた、プロフェッショナルで使いやすい外国為替取引システムです。 W・D・ガン。このインジケーターは、ストップロスとテイクプロフィットレベルを含む正確な買いと売りのシグナルを提供します。 PUSH通知を利用して外出先でも取引可能です。 購入後はご連絡ください!私の取引のヒントと素晴らしいボーナスインジケーターを無料で共有します! おそらく、ギャンの取引手法についてはすでに何度も聞いたことがあるでしょう。通常、ギャンの理論は初心者のトレーダーだけでなく、すでにある程度の取引経験がある人にとっても非常に複雑なものです。なぜなら、ギャンの取引手法は理論的にはそれほど簡単に適用できるものではないからです。私はその知識を磨き、最良の原則を私の外国為替インジケーターに組み込むために数年を費やしました。 このインジケーターは非常に簡単に適用できます。必要なのは、それをチャートに添付し、簡単な取引推奨事項に従うだけです。このインジケーターは常に市場分析の仕事を行い、取引の機会を探します。適切なエントリーポイントを検出
55 USD
Description: First of all Its worth emphasizing here that this Trading Tool is Non-Repainting, Non-Redrawing and Non-Lagging Indicator, Which makes it ideal for professional trading and expert advisers. For limited time only 40% OFF,  Now 60$ only. 4 purchases left & the price increases to 100$ Attention, the application might not work in the strategy tester,  Try Demo here before you buy:  here . The Smart Price Action Concepts Indicator is a very powerful tool for both new and experienced tr
60 USD
Owl smart levels
Sergey Ermolov
4.76 (41)
MT5版  |  インストールする方法?   |   FAQ Owl Smart Levels Indicator   は、 Bill Williams   の高度なフラクタル、市場の正しい波構造を構築する Valable ZigZag、エントリの正確なレベルをマークする Fibonacci レベルなどの一般的な市場分析ツールを含む 1 つのインジケーター内の完全な取引システムです。 利益を得るために市場と場所に。 戦略の詳細な説明 インジケータを操作するための指示 顧問-取引助手 プライベートユーザーチャット ->購入後に私に書いて、私はプライベートチャットにあなたを追加し、あなたはそこにすべてのボーナスをダウンロードすることができます 力はシンプルさにあります! Owl Smart Levels   取引システムは非常に使いやすいので、専門家にも、市場を勉強し始めて自分で取引戦略を選択し始めたばかりの人にも適しています。 戦略と指標に秘密の数式や計算方法が隠されているわけではなく、すべての戦略指標は公開されています。 Owl Smart Levels を使用すると、取引を開始す
97 USD
このインディケータは、当社の2つの製品 Advanced Currency IMPULSE with ALERT  +   Currency Strength Exotics . のスーパーコンビネーションです。 このインジケーターは全ての時間枠で作動し、8つの主要通貨と1つのシンボルの強弱のインパルスをグラフで表示します。 このインジケータは、金、エキゾチックペア、商品、インデックス、先物など、あらゆるシンボルの通貨強度の加速度を表示することに特化されています。金、銀、原油、DAX、US30、MXN、TRY、CNHなどの通貨強度の加速度(インパルスまたは速度)を表示するために、任意のシンボルを9行目に追加できる、この種の最初のものです。 新しいアルゴリズムに基づいて構築され、潜在的な取引の特定と確認がさらに容易になりました。これは、通貨の強さや弱さが加速しているかどうかをグラフィカルに表示し、その加速の速度を測定するためです。加速すると物事は明らかに速く進みますが、これはFX市場でも同じです。つまり、反対方向に加速している通貨をペアリングすれば、潜在的に利益を生む取
149 USD
BUY INDICATOR AND GET EA FOR FREE AS A BONUS + SOME OTHER GIFTS! ITALO TRIANGLE INDICATOR  is the best triangle indicator ever created, and why is that? Using Geometry and Fibonacci the Indicator works on all time-frames and assets, indicator built after 7 years of experience on forex and many other markets. You know many triangle indicators around the internet are not complete, does not help, and it's difficult to trade, but the   Italo Triangle Indicator is different , the Italo Triangle Indi
65 USD
Cycle Sniper
Elmira Memish
4.41 (34)
NEW YEAR SALE PRICE FOR LIMITED TIME!!! Please contact us after your purchase and we will send you the complimentary indicators to complete the system . Cycle Sniper is not a holy grail but when you use it in a system which is explained in the videos, you will feel the difference. If you are not willing to focus on the charts designed with Cycle Sniper and other free tools we provide, we recommend not buying this indicator. We recommend watching the videos about the indiactor and system befor
199 USD
Weis Wave with Alert
Trade The Volume Waves Single Member P.C.
4.78 (18)
Rental/Lifetime Package Options and Privileges' * For optimum results the yearly or lifetime package is suggested due to live training and Discord  channel trading with the  creator! Rent Monthly Six Months   Yearly/Lifetime Weis Wave with Speed with Alert+Speed Index x x x Manual  x x x Quick Set up Video x x x Blog x x x Lifetime Updates x x x Setup and Training Material x x Free Rectangle Break Alert Tool      x Discord Access Channel "The SI traders" x 2-hour live methodology traini
599 USD
通貨強さウィザードは、取引を成功させるためのオールインワン ソリューションを提供する非常に強力な指標です。このインジケーターは、複数の時間枠のすべての通貨のデータを使用して、このまたはその外国為替ペアのパワーを計算します。このデータは、使いやすい通貨インデックスと通貨パワーラインの形式で表され、特定の通貨のパワーを確認するために使用できます。 必要なのは、取引したいチャートにインジケーターを接続することだけです。インジケーターは、取引する通貨の実際の強さを示します。このインジケーターは、トレンドに合わせて取引するときに有利に利用できる売買高の圧力の極値も示します。このインジケーターには、フィボナッチに基づく可能なターゲットも表示されます。 このインジケーターは、PUSH 通知を含むあらゆるタイプのアラートを提供します。 購入後ご連絡下さい。私の取引のヒントをあなたと共有し、素晴らしいボーナスインジケーターを無料で提供します! 幸せで有益な取引をお祈りします。
65 USD
PRO Renko Systemは、特別にRENKOチャートを取引するために設計された高精度の取引システムです。 これは、様々な取引商品に適用することができる普遍的なシステムです。 システムは効果的に正確な逆転信号へのアクセスを与えるいわゆる市場の騒音を中和する。 表示器は非常に使いやすく、信号の生成に責任がある1つの変数だけがあります。 あなたは簡単にお好みの任意の取引ツールとレンコバーのサイズにツールを適応させることができます。 私はいつもあなたが私のソフトウェアで収益性の高い取引を支援するために余分なサポートを提供する準備ができています! 私はあなたに幸せで収益性の高い取引をしたいです! ご購入後にご連絡ください! 私はあなたに私のレンコチャートジェネレータを送信します。 私はまた、私の個人的な推奨事項やシステムの他のモジュールを無料で共有します!
75 USD
GET 10% OFF NOW! An exclusive indicator that utilizes an innovative algorithm to swiftly and accurately determine the market trend. The indicator automatically calculates opening, closing, and profit levels, providing detailed trading statistics. With these features, you can choose the most appropriate trading instrument for the current market conditions. Additionally, you can easily integrate your own arrow indicators into Scalper Inside Pro to quickly evaluate their statistics and profitabilit
119 USD
TPA True Price Action indicator reveals the true price action of the market makers through 100% non-repainting signals (except early signals mode) strictly at the close of a candle! TPA shows entries and re-entries, every time the bulls are definitely stronger than the bears and vice versa. Not to confuse with red/green candles. The shift of power gets confirmed at the earliest stage and is ONE exit strategy of several. There are available now two free parts of the TPA User Guide for our custo
168 USD
TakePropips Donchian Trend Pro
Eric John Pajarillaga Aldana
4.8 (15)
TakePropips Donchian Trend Pro   (MT4) は、ドンチャン チャネルを使用してトレンドの方向を自動的に検出し、エントリーとエグジットの取引シグナルを提供する強力で効果的なツールです! この多機能インジケーターには、トレンド スキャナー、取引シグナル、統計パネル、スクリーナー、取引セッション、およびアラート履歴ダッシュボードが含まれます。取引シグナルを提供し、チャートを分析する時間を節約するように設計されています! ユーザー マニュアルとインストール ガイドは、ブログ投稿 (   https://www.mql5.com/en/blogs/post/751368   ) からダウンロードできます。 今日は 50% オフ! 98ドルから49ドルに値下げ! このインジケーターは、ストラテジー テスターでテストできます (ビジュアル モードを有効にします)。ライブ チャートでテストしたい場合は、7 日間の試用版を入手するようにメッセージを送ることもできます。 詳細については、説明の下にあるビデオ チュートリアルも利用できます。 ご不明な点やサポートが必
99 USD
AW Trend Predictor
AW Trading Software Limited
4.72 (36)
1 つのシステムでのトレンド レベルとブレイクダウン レベルの組み合わせ。高度なインジケーター アルゴリズムは、市場のノイズをフィルター処理し、トレンド、エントリー ポイント、および可能なエグジット レベルを決定します。インジケーターシグナルは統計モジュールに記録されるため、最適なツールを選択してシグナル履歴の有効性を示すことができます。この指標は、テイクプロフィットとストップロスのマークを計算します。 マニュアル・説明書→   こちら / MT5版→   こちら インジケーターで取引する方法: Trend Predictor での取引は、たった 3 つの簡単なステップです。 ステップ 1 - ポジションを開く 70% 以上の成功率で買いシグナルが受信されました ステップ 2 - ストップロスの決定 逆信号でトランクを選択 ステップ 3 - テイクプロフィット戦略の定義 戦略 1: TP1 に到達したらポジション全体をクローズする 戦略 2: TP1 に達した時点でポジションの 50% をクローズし、TP2 に達した時点で残りの 50% をクローズします。 戦略 3: トレンドの反転で
55 USD
ICT, SMC, SMART MONEY CONCEPTS, SMART MONEY, Smart Money Concept, Support and Resistance, Trend Analysis, Price Action, Market Structure, Order Blocks, BOS/CHoCH,   Breaker Blocks ,  Momentum Shift,   Supply&Demand Zone/Order Blocks , Strong Imbalance, HH/LL/HL/LH,    Fair Value Gap, FVG,  Premium  &   Discount   Zones, Fibonacci Retracement, OTE, Buy Side Liquidity, Sell Side Liquidity, BSL/SSL Taken, Equal Highs & Lows, MTF Dashboard, Multiple Time Frame, BigBar, HTF OB, HTF Market Structure, 
65 USD
FX Volume
Daniel Stein
4.59 (34)
mql5と Telegramの モーニング・ブリーフィングで、詳細とスクリーンショットを含む毎日のマーケット・アップデートをご覧 ください! FX Volumeは、ブローカーの視点から市場のセンチメントをリアルに洞察する、最初で唯一の出来高インジケーターです。 ブローカーのような機関投資家が外国為替市場でどのようなポジションをとっているか、COTレポートよりもはるかに速く、素晴らしい洞察を提供します。 この情報をチャート上で直接見ることは、あなたの取引にとって真のゲームチェンジャーであり、画期的なソリューションです。 以下のようなユニークなマーケットデータ洞察から利益を得てください。 比率は 、通貨のロングポジションとショートポジションの比率をパーセントで表示します。 比率の変化は 、選択した期間内のロング比率とその変化率を表示します。 Volumes Totalは 、通貨の取引量(ロングとショート)の合計をロット単位で表示します。 Volumes Long :全通貨のロングポジションの取引量を表示します。 Volumes(ショート )は、全通貨のショートポジションの取引量を表示
249 USD
現在20%OFF! このダッシュボードは、複数のシンボルと最大9つのタイムフレームで動作するソフトウェアの非常に強力な部分です。 このソフトは、弊社のメインインジケーター(ベストレビュー:Advanced Supply Demand)をベースにしています。    Advanced Supply Demand ダッシュボードは、素晴らしい概要を提供します。それは示しています。  ゾーン強度評価を含むフィルタリングされた需給値。 ゾーン内/ゾーンへのPips距離。 ネストされたゾーンがハイライトされます。 選択されたシンボルの4種類のアラートを全ての(9)時間枠で提供します。 それはあなたの個人的なニーズに合わせて高度に設定可能です。 あなたの利益! すべてのトレーダーにとって最も重要な質問です。 市場に参入するのに最適なレベルはどこか? 成功のチャンスとリスク/リターンを得るために、強力な供給/需要ゾーン内またはその近くで取引を開始します。 損切りの最適な位置はどこですか? 最も安全なのは、強力な供給/需要ゾーンの下/上にストップを置くことで
199 USD
MTF Supply Demand Zones
Georgios Kalomoiropoulos
4.83 (23)
次世代の自動化された需要と供給のゾーン。どのチャートでも機能する新しい革新的なアルゴリズム。すべてのゾーンは、市場の価格行動に従って動的に作成されています。 2種類のアラート --> 1) 価格がゾーンに達したとき 2) 新しいゾーンが形成されたとき もう 1 つの役に立たない指標はありません。実績のある完全な取引戦略を手に入れることができます。     新機能:     価格が需給ゾーンに達したときにアラートを出す     新しい需給ゾーンが作成されたときにアラートを発します     プッシュ通知アラート     ピップ単位のゾーン幅ラベル     MTF のもう 1 つのタイムフレーム。したがって、現在より 2 時間足高いのではなく、現在より 3 時間足し上に見えるようになります。     アラート/ゾーン/MTF 機能を有効/無効にするボタン あなたが得る利点:     取引から感情を取り除きます。     取引エントリをオブジェクト化します。     確率の高いセットアップで利益
149 USD
Flag Pattern pro is a   Price Action (PA)   analytical tool that scans the   continuation patterns   known as   "Flag and Pennant Patterns"   . Flag and Pennant patterns are continuation patterns characterized by a move in a previous trend direction after a shallow retracement usually below 50% of the original move . Deep retracements can however be sometimes found at the 61.8 % levels. The original move is know as the   flag pole   and the   retracement   is called the flag.   Indicator Fun
89.99 USD
作者のその他のプロダクト
RtcSpectra
Muhammad Faisal Sagala
1 (1)
Attention :   Please send a message to us if you still don't understand and are expected to follow the recommended capital size, lots size value, and one of the brokers whose portfolio we display. " For those of you who buy RTC Spectra products by ignoring our recommendations, you don't need to provide bad testimonials for your own mistakes!".  The Expert Advisor (EA) named "RTC Spectra" is designed for the long term with good and consistent results. This EA has been proven to perform very well
432 USD
SmartTradePanel は、トレーダーが注文を迅速かつ効率的に実行できるようにする取引ツールです。 提供される高度な機能により、SmartTradePanel は、トレーダーがオープン注文を管理し、取引の潜在的な利益を最適化するのに本当に役立ちます。 この記事では、SmartTradePanel の機能と利点について詳しく説明します。 SmartTradePanel の主な機能の 1 つは、オープン注文の高速実行機能です。 数回クリックするだけで、トレーダーは迅速かつ効率的に取引ポジションを開くことができます。 これは、約定速度が利益を決定する要因となる可能性がある急速に変化する市況で特に役立ちます。 それとは別に、SmartTradePanel では、トレーダーがロック注文を出すこともできます。 ロッキングオーダーは、ポジションが逆転して将来的に利益を生み出すことを期待して、負けたポジションをロックすることを目的とする取引戦略です。 SmartTradePanel を使用すると、トレーダーは数回クリックするだけで簡単にロック注文を出すことができます。 注文の実行
50 USD
このTradingPanelには、同様の取引パネルと比較して、次のような多くの利点があります。 1. 即座に注文を開始 (市場) し、希望の価格で保留中です。 2. ピップまたはポイント モードで設定できるテイクプロフィット (TP)、ストップロス (SL)、およびトレーリングストップ (TS) 設定。 3. 成行注文のみ、未決注文のみ、または成行注文と未決注文のすべての注文を閉じることができます。 4. マスターとして開いた注文をクライアントとしてパネルにコピーできる CopyTrade も装備し、クライアントからロットスケール値を設定できます。 取引活動を容易にするために、今すぐこの TradingPanelPlusCopier を入手してください。 TradingPanelPlusCopier の使用方法と使用のデモは、説明のビデオ デモで見ることができます。 こんにちは利益!
70 USD
Transform Your Trading with SmartFastTrade AI: Speed and Ease at Your Fingertips! Introduction Are you a trader struggling with slow order execution? Do you want a tool that can assist you in making quick and accurate trading decisions? If yes, then SmartFastTrade AI is the answer to all your trading needs. With its unique combination of speed, user-friendliness, and advanced features, SmartFastTrade AI will help you unlock your full trading potential. Let's delve deeper into why this innovativ
50 USD
RtcSpectra5
Muhammad Faisal Sagala
Attention :   Please send a message to us if you still don't understand and are expected to follow the recommended capital size, lots size value, and one of the brokers whose portfolio we display. " For those of you who buy RTC Spectra products by ignoring our recommendations, you don't need to provide bad testimonials for your own mistakes!".  The Expert Advisor (EA) named "RTC Spectra" is designed for the long term with good and consistent results. This EA has been proven to perform very well
432 USD
RtcDERIV
Muhammad Faisal Sagala
Deriv.comで安全、迅速かつ効果的に取引したいですか? さまざまな戦略を試しましたが、適切な戦略が見つかりませんでしたか? ご心配なく。解決策があります。 Deriv.com専用の最新のExpert AdvisorであるRtcDERIVには、スキャルピングとマーチンゲール戦略の組み合わせが付属しており、過去1年間で10,000%以上の利益を記録しています。 RtcDERIV の利点の 1 つは、ボラティリティ インデックス、特にボラティリティ インデックス 25 での使用であり、現時点では非常に優れています。 Deriv での取引には、24 時間 365 日休みがないという利点もあるため、いつでも利益を最大化できます。 RtcDERIV は Metatrader 5 Deriv プラットフォームでデフォルト設定の 0.5 ロットで実行されており、500 ドルで取引を開始するには十分です。 ただし、安全のために、1000 ドルから始めることをお勧めします。 約 1.75% の低いドローダウンで、より安全に取引を行うことができます。 私たちは RtcDERIV を 1
432 USD
フィルタ:
レビューなし
レビューに返信