Trend Stop

Trend Stop  

Introduction

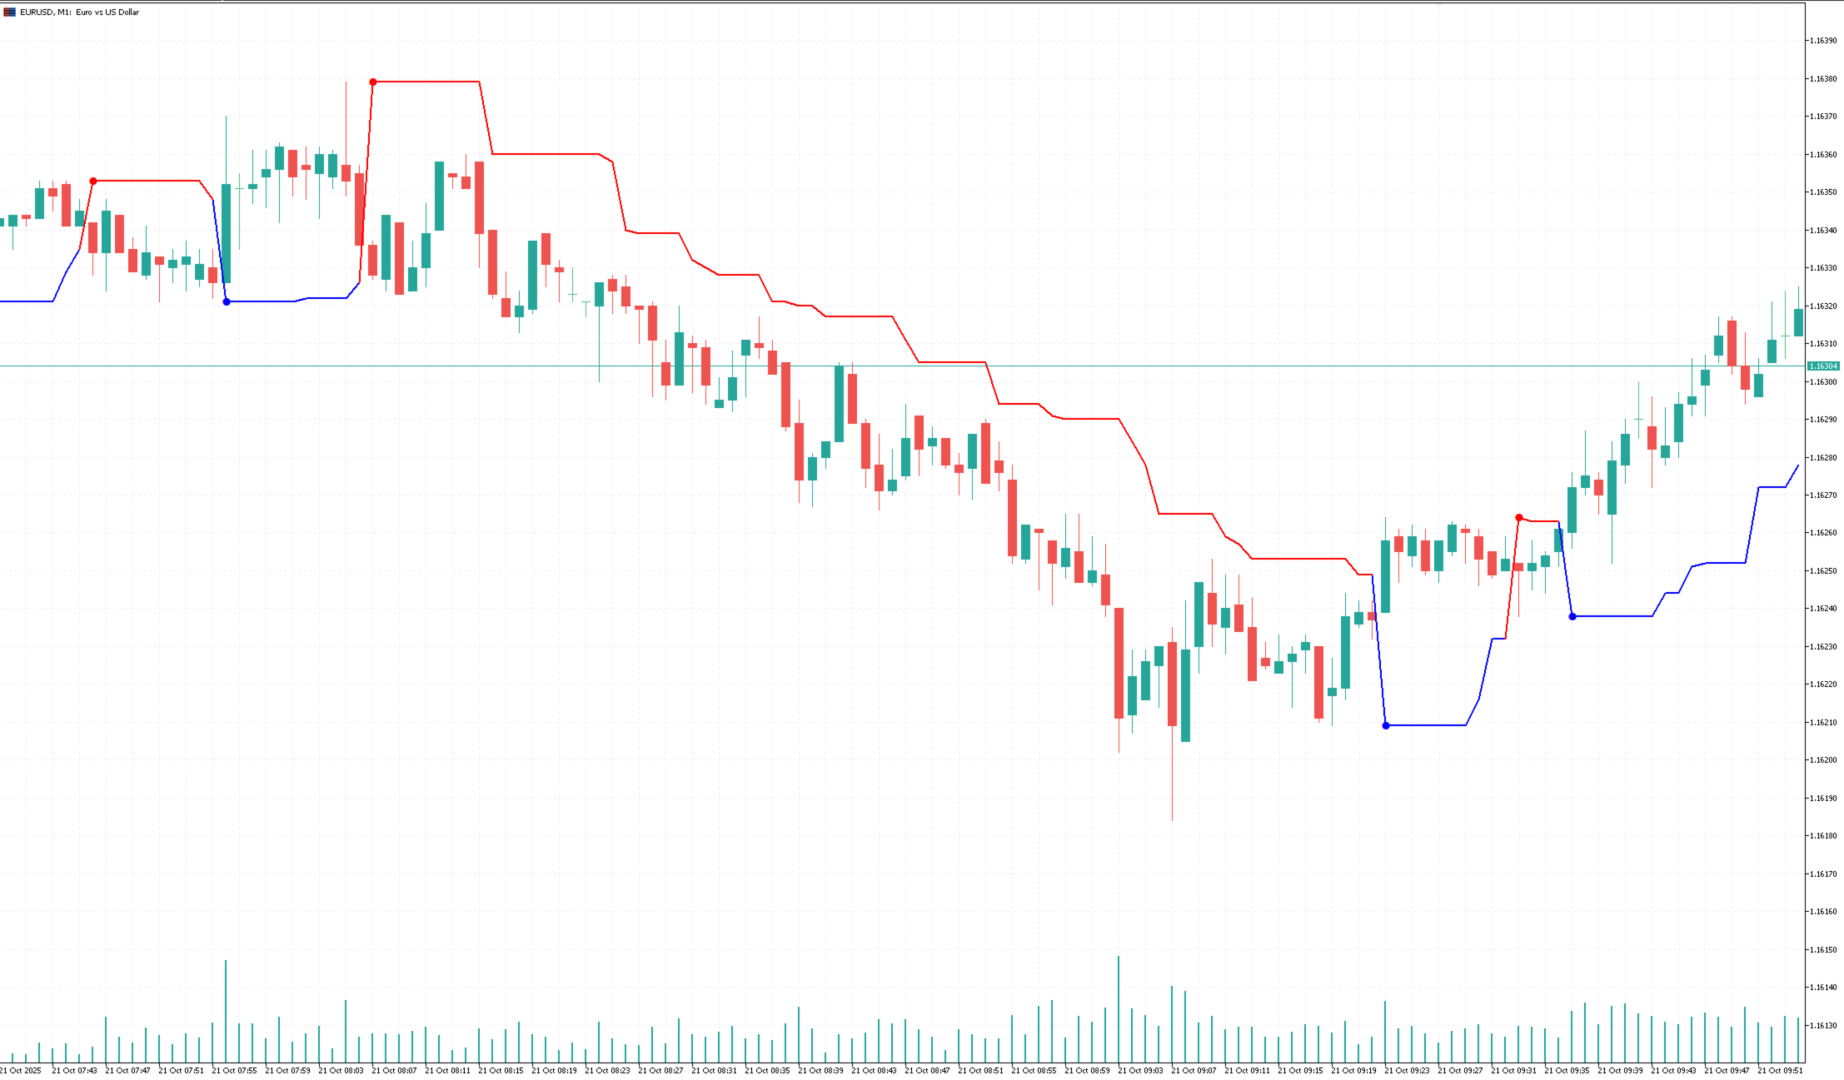
Trend Stop is a simple yet powerful trend-following and stop-placement tool for MetaTrader 4.
It calculates the highest high or lowest low of the last N periods and plots a dynamic line that reacts instantly to trend changes.

The result is a clean, reliable trend filter and a practical guide for placing optimal stop levels — without unnecessary noise or lag.

Whether you’re a trend trader, swing trader, or scalper, Trend Stop helps you stay on the right side of the market and manage risk with precision.

What Trend Stop Does

Trend Stop continuously tracks the market’s structure over the last N candles and draws:

  • Lower-band line in an uptrend

  • Upper-band line in a downtrend

This creates a dynamic trailing structure that adapts to price movement in real time.

Trend Direction Detection

Trend Stop makes identifying trend changes extremely easy:

Uptrend

Occurs when price crosses above the Trend Stop line.
This indicates buyers have taken control and momentum is shifting upward.

Downtrend

Occurs when price crosses below the Trend Stop line.
This signals sellers are dominating and momentum is moving downward.

You no longer need to guess trend direction — the indicator gives you a clean, rule-based confirmation.
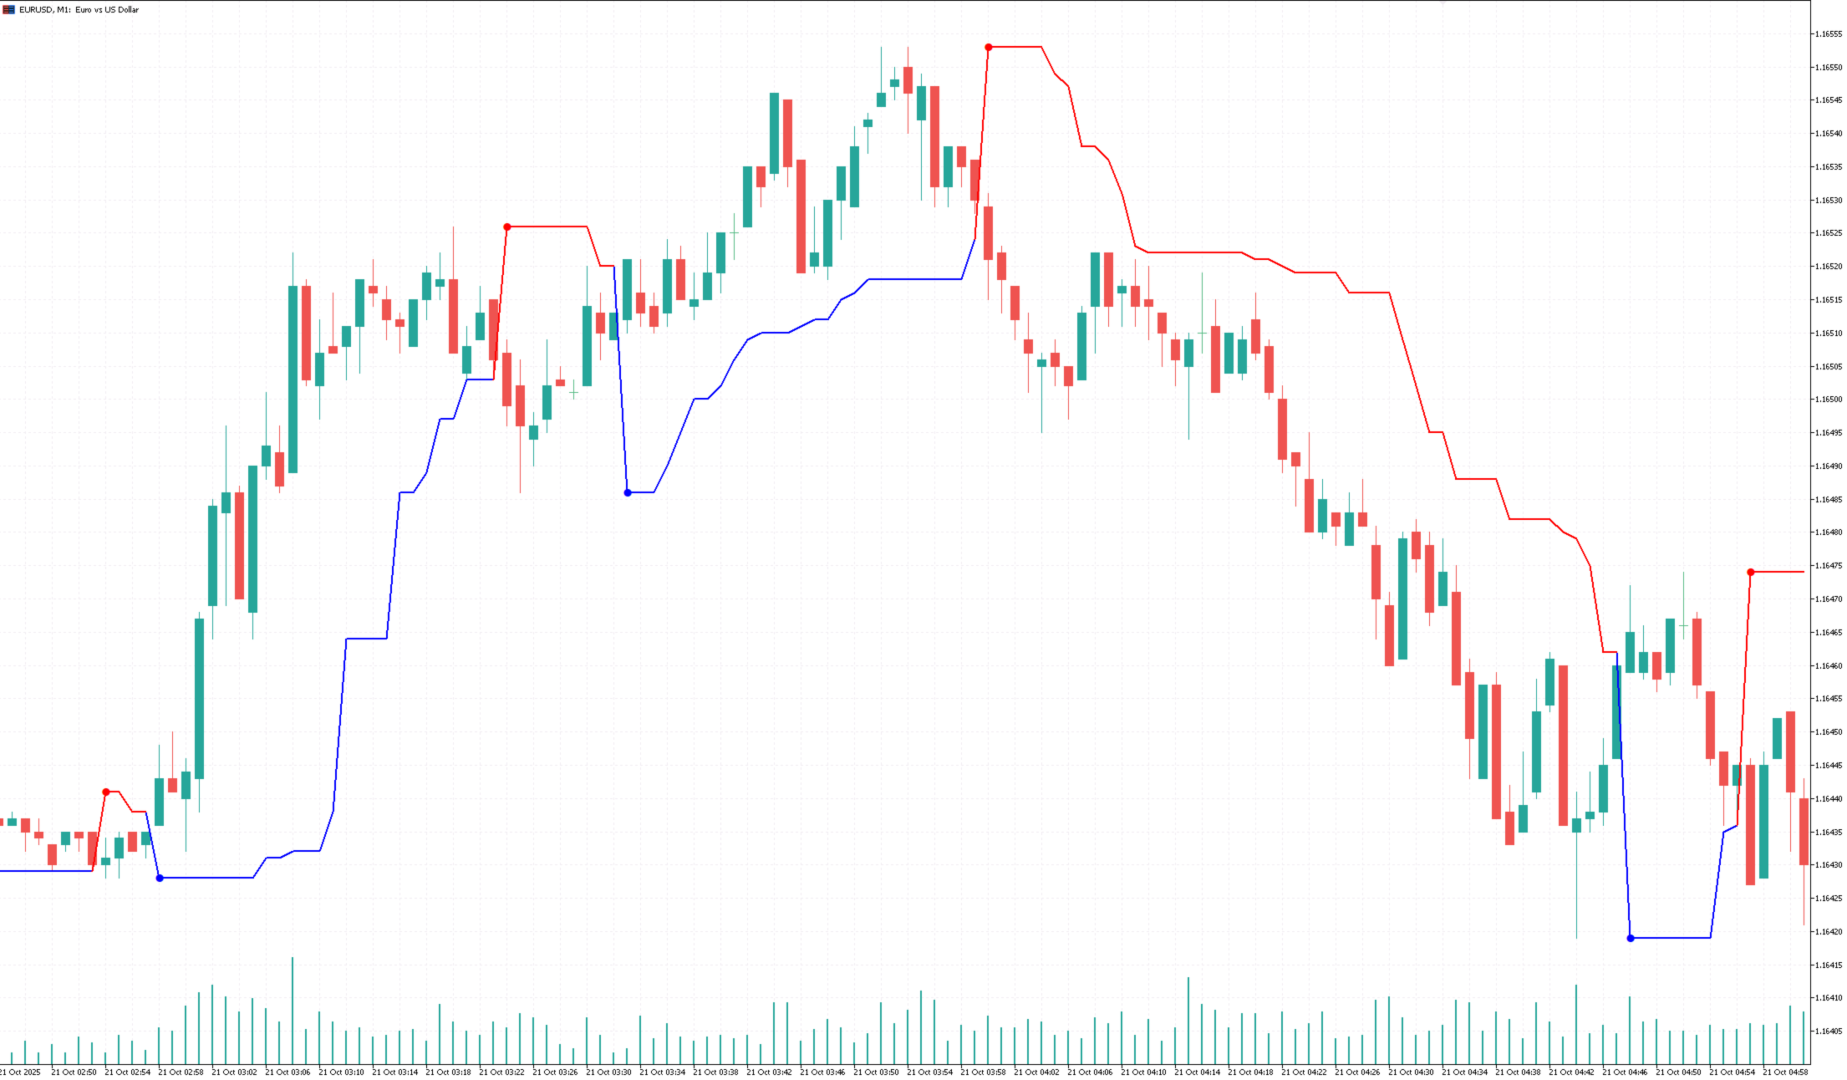
Optimal Stop Placement

Trend Stop is also a highly effective tool for stop-loss placement.

In an Uptrend

Place your stops below the Trend Stop line.
This keeps your stop tight while avoiding premature exits.

In a Downtrend

Place your stops above the Trend Stop line.
This protects your position from pullbacks while following the main trend.

Because the line is based on recent market structure, it naturally adapts to volatility and price swings.

Why Traders Use Trend Stop

✔ Clear and objective trend detection
✔ Dynamically adjusts to price movement
✔ Excellent for trailing stops and risk management
✔ Works on all symbols and timeframes
✔ No repainting of confirmed levels
✔ Ideal for trend-following, breakout strategies, and swing trading

Trend Stop is especially effective when combined with:

  • Moving averages

  • Breakout strategies

  • Momentum indicators (RSI, MACD, CCI)

  • Price action setups

  • Support/resistance zones

Parameters

Periods

The number of candles used to calculate the Trend Stop values.
Lower values → more sensitive, reacts faster
Higher values → smoother, more stable

This allows you to adjust the indicator to your trading style.

Conclusion

Trend Stop gives traders a clean, rule-based method to:

  • identify trend direction

  • time entries

  • place optimal stops

  • trail positions intelligently

Its simplicity, accuracy, and adaptability make it a powerful addition to any trading system.

    推荐产品
    Fractal Pivot Lines — Indicator Overview  Fractal Pivot Lines is a custom trend-structure indicator for MetaTrader 4 . It automatically connects key fractal highs and lows with dynamic lines so you can see how price is respecting local structure, building channels, and preparing for potential reversals. Instead of staring at dozens of candles and guessing where the real pivots are, the indicator turns fractals into clear support/resistance paths and trend channels . What the Indicator Does C
    Introduction It is common practice for professional trades to hide their stop loss / take profit from their brokers. Either from keeping their strategy to the themselves or from the fear that their broker works against them. Using this indicator, the stop loss / take profit points will be drawn on the product chart using the bid price. So, you can see exactly when the price is hit and close it manually.  Usage Once attached to the chart, the indicator scans the open orders to attach lines for t
    CRT Candle Range Theory HTF MT4.   Ultimate CRT Indicator: Advanced ICT Concepts and Malaysian SnR Trading System Discounted   Price   $50  !!     Secure your lifetime access   now   before it switches to   subscription-only ! Master the Market Maker's Footprints with the Most Advanced Candle Range Theory Indicator Unlock the true power of   Smart Money Concepts (SMC)   and trade precisely like the institutions with the   Ultimate CRT Indicator . Built exclusively for serious traders, this indic
    Octave Fractal Channel — Dynamic Gann-Based Support/Resistance Levels with Auto-Scaling. This indicator plots a dynamic channel based on the fractal structure of price movement. Channel levels adapt to the current symbol and timeframe, making it suitable for use across various financial instruments — from currency pairs to cryptocurrencies and indices. The indicator can be used in combination with other technical tools, such as the RSI oscillator, to provide additional signal filtering. How to
    Smart Divergence Dashboard
    Suvashish Halder
    5 (3)
    The Smart Divergence Dashboard is your ultimate tool for identifying high-probability trading opportunities. This cutting-edge indicator is meticulously designed to detect Regular Divergences, offering traders a clear and actionable advantage. MT5 Version -  https://www.mql5.com/en/market/product/120703/ Key Features: Real-time Divergence Detection: Instantly pinpoints Higher High/Lower Low and Oscillator Higher Low divergences across multiple currency pairs and timeframes using   Awesome Oscill
    This indicator provides the technical overview using following tools: Pivot Points Technical Indicators Moving Averages Pivot Points are calculated using five different methods: Classic Fibonacci Camarilla Woodie DeMark With the technical indicator , you can find the trading signals using the combination of different indicators. It supports the following technical indicators: RSI Stochastic Stochastic RSI MACD ADX CCI ATR Ultimate Oscillator ROC Bull/Bear Power Moving Averages is used to find th
    Divergent Accuracy
    Yaroslav Varankin
    The Divergent Accuracy indicator is designed to identify discrepancies on the price chart of a currency pair. The Divergent Accuracy indicator recognizes bullish and bearish divergences, and can also output a signal that a divergence has been detected... In addition to identifying divergences, the indicator works with overbought and oversold levels, and also shows arrows to enter the market...
    Trend Ray
    Andriy Sydoruk
    The indicator shows the potential trend direction by cyclical-wave dependence. Thus, all the rays of the intersection will be optimal rays, in the direction of which the price is expected to move, taking into account the indicator period. Rays can be used as a direction for potential market movement. But we must not forget that the approach must be comprehensive, the indicator signals require additional information to enter the market.
    Apollo BuySell Predictor 是一个包含多个模块的专业交易系统。该指标为交易者提供价格突破区、基于斐波那契的支撑和阻力位、趋势反转线、交易量信号、回调和任何交易者每天都需要的其他有用功能。该系统将适用于任何一对。推荐的时间框架是 M30、H1、H4。尽管该指标可以与其他时间范围一起使用,但 H4 以上的时间范围除外。 该系统是通用的,因为它提供了任何交易者成功交易所需的一切。该系统可以多种方式使用。该指标可用于日内交易、波段交易甚至剥头皮交易。无论您喜欢哪种交易方式,系统都会帮助您以真实的形式看待市场。所有系统信号都不会被重绘! 您可以根据您的交易偏好和任务启用/禁用各种系统模块。系统提供所有类型的通知,包括PUSH通知。您可以打开/关闭您需要的通知。 购买后请给我发电子邮件。我将与您分享交易说明和重要的红利指标,它们将使您的交易更加有利可图!
    Auto Fibo Pro m
    DMITRII GRIDASOV
    “Auto FIBO Pro” Crypto_Forex 指标 - 是交易中的绝佳辅助工具! - 指标自动计算并放置在图表斐波那契水平和局部趋势线(红色)上。 - 斐波那契水平指示价格可能反转的关键区域。 - 最重要的水平是 23.6%、38.2%、50% 和 61.8%。 - 您可以将其用于反转剥头皮或区域网格交易。 - 还有很多机会可以使用 Auto FIBO Pro 指标来改进您当前的系统。 - 它具有信息价差掉期显示 - 它显示所连接的外汇对的当前价差和掉期。 - 显示屏还显示账户余额、净值和保证金。 - 可以将信息价差掉期显示定位在图表的任何角落: 0 - 左上角,1 - 右上角,2 - 左下角,3 - 右下角。 点击这里查看高质量的交易机器人和指标! 这是仅在此 MQL5 网站上提供的原创产品。
    我们为您提供一个指标"蜡烛收盘台",它将成为您在贸易领域不可或缺的助手。 这就是为什么知道蜡烛何时关闭会有所帮助的原因: 如果你喜欢使用蜡烛花纹进行交易,你就会知道蜡烛何时关闭。 此指标将允许您检查是否形成了已知模式以及是否存在交易的可能性。 该指标将帮助您做好市场开放和市场关闭的准备。 可以设置一个计时器来创建计划新闻的预览,这样就可以检查市场对此的反应。 您可以设置指示灯,以便在蜡烛关闭前几秒钟发送警报/警告。 通知/警报/警报可以发送到: 屏幕警报 电子邮件 移动应用 MT4烛台计时器指示器为什么有用 那么烛台计时器什么时候有用呢?如果你长期交易,你可能不需要蜡烛计时器指示器,因为你的参赛不会受到一分钟或一小时的太大影响。但是,如果你在短时间内是黄牛或交易员,那么你知道时机非常重要。 外汇市场24小时开放,只在周末关门,有些策略可能会受到您入仓时出现错误时机的严重影响。 MT4蜡烛计时器指示器可以显示当前蜡烛中的剩余时间,以便为下一次蜡烛打开做好准备。 可以从这一指标中受益的一些情况例子有: 预定消息传出 地理市场开闭 预定发生的事件,通常是金融、经济或政治事件
    SMC Venom 模型 BPR 指標是針對在智慧貨幣 (SMC) 概念內工作的交易者的專業工具。它會自動辨識價格圖表上的兩種關鍵模式: FVG (公平價值缺口)是三根蠟燭的組合,其中第一根和第三根蠟燭之間存在缺口。它在水平之間形成一個沒有成交量支撐的區域,這通常會導致價格調整。 BPR (平衡價格區間)是兩種 FVG 模式的組合,形成一個「橋樑」 - 當價格以低成交量活動移動時,突破並返回到水平的區域,從而在蠟燭之間產生間隙。 這些模式可協助交易者透過分析圖表上的交易量和價格動態(大型市場參與者和普通參與者之間的互動)來識別關鍵的支撐/阻力位、突破區域和切入點。 此指標以矩形和箭頭的形式可視化模式,也支援靈活的警報設定。 主要特點: 模式顯示模式:選擇顯示 BPR 模式(看漲和看跌)或 FVG 模式(看漲和看跌)。 可以隱藏所有圖表分析模式。 以條數過濾:BPR 結構中 FVG 之間的最小/最大距離。 訊號的附加視覺化: 箭頭有 9 種類型可供選擇(標準、細、分形等)或手動輸入 Wingdings 代碼,其表格可以選擇性地顯示在圖表上。 使用 ATR 配置顏色、尺寸及其相對於價格
    Meta Sniper
    Samir Tabarcia
    Requirements Optimized to work with   EURUSD-EURCHF-USDJPY, AUDUSD-CADJPY-AUDNZD, CHFJPY-NZDJPY-NZDUSD For timeframe 4H. *(Minimum recommended deposit is $300 for each Pair) for initial lot set to 0.10, My favorite Pair are (CHFJPY-NZDJPY-EURUSD-AUDNZD-USDJPY) Warning it will be SALE only 5 Copys at 60$ Then it will be update up to 200$  You can use it the way it is, For new Set Files will be add on (Comments) ECN broker with low spread is recommended to get better results. Setup is very e
    Power Renko MT4
    Pierce Vallieres
    Power Renko is an indicator which plots Renko bricks underneath the chart using a histogram. You can select the brick size and the timeframe of the Renko bricks as well as whether or not to use the close price or the high/low price of the candles. Renko bricks are based on price alone, not time, therefor the Renko bricks will not be aligned with the chart's time. They are extremely useful for trend trading and many different strategies can be formed from them. Buffers are provided allowing you t
    Noize Absorption Index MT4
    Ekaterina Saltykova
    5 (1)
    Noize Absorption Index - is the manual trading system that measures the difference of pressure between bears forces and bulls forces. Green line - is a noize free index that showing curent situation. Zero value of index shows totally choppy/flat market.Values above zero level shows how powerfull bullish wave is and values below zero measures bearish forces.Up arrow appears on bearish market when it's ready to reverse, dn arrow appears on weak bullish market, as a result of reverse expectation. S
    Supply Demand Zone Pro Indicator works with all products and timeframes. It is using a new calculation method, and now you can select the desired zone on any timeframe! Strongest Zones are already enabled by default This is a great advantage in trading.This indicator has a built in backtester enabled by default, just move the chart. Supply and Demand ? Supply is a price zone where sellers outnumbered buyers and drove the price lower. Demand is a price zone where buyers outnumbers sellers and dr
    Reverse Engineered RSI   Introduction Reverse Engineered RSI transforms the way traders use the RSI indicator. Instead of displaying RSI in a separate oscillator window, this tool projects the key RSI levels — 30, 50, and 70 — directly onto the price chart . This allows traders to see where overbought, oversold, and equilibrium zones align with actual price levels — without switching charts or guessing momentum conditions. You get precise RSI-derived support and resistance levels right on the c
    Year2Year
    Stanislav Korotky
    This indicator shows price changes for the same days in past years. D1 timeframe is required. This is a predictor indicator that finds D1 bars for the same days in past 8 years and shows their relative price changes on the current chart. Parameters: LookForward - number of days (bars) to show "future" price changes; default is 5; Offset - number of days (bars) to shift back in history; default is 0; ShowAverage - mode switch; true - show mean value for all 8 years and deviation bounds; false - s
    FREE
    "Impulses and Corrections 4" is created to help traders navigate the market situation. The indicator shows multi-time frame upward and downward "Impulses" of price movements. These impulses are the basis for determining the "Base" , which is composed of zones of corrections of price movements, as well as "Potential" zones for possible scenarios of price movement. Up and down impulses are determined based on a modified formula of Bill Williams' "Fractals" indicator. The last impulse is always "U
    FX Flow
    Eva Stella Conti
    FX Flow   indicator can be used as an anticipator of the next trend, preferably confirmed by Price Action or another oscillator (RSi, Stochastic ..). It takes the money flows of the major currencies USD EUR GBP AUD NZD CAD CHF JPY into account, and processes them. Excellent tool for indices, but also for correlations between currencies. Works on each timeframes.  Blue line: Bull market Yellow line: Bear market Note : if the indicator opens the window, but does not draw lines, load the historie
    Pivot Points are a classic technical analysis indicator that calculates the central pivot point (PP) as well as support (S1–S3) and resistance (R1–R3) levels based on the previous day’s High, Low, and Close. The indicator allows you to: • identify key zones where the price may bounce or break through • determine the direction of the trend • find good entry points, as well as set stop loss and take profit levels Indicator settings: • enable/disable PP, R1/S1, R2/S2, R3/S3 • enable/disable price l
    FREE
    Classic Fractals indicator for MT4, with additional Trendlines connecting the latest couples of fractals ( fractals are showing highest high, and lowest low on each period) Rules for trendlines: -if new top fractal is below the last one = new resistance line -if new bot fractal is above the last one = new support line -Trendlines can be hidden -Fractals can be hidden Fractal Period = can be both even or uneven number, as it is setting for half (one side) of the bars sequence for findin
    The Auto Super Pivot indicator is an indicator designed to calculate support points and resistance points for pivot points. this indicator has the ability to calculate standard pivot, fibonacci, camarilla, woodie and demark pivot points. It also allows you to use all time zones with the time frame feature. Another feature of the indicator is the auto time slice feature. This feature allows automatic calculations without having to set any time zone. Features 6 different pivot calculation modes A
    Super Reversal Pattern
    Parfait Mujinga Ndalika
    Super Reversal Pattern Indicator Unlock the power of advanced pattern recognition with our Super Reversal Pattern Indicator. Designed for traders seeking precision and reliability, this indicator identifies one of the most effective reversal patterns in technical analysis, offering a significant edge in your trading strategy. Key Features: Non-Repainting Accuracy: Enjoy the confidence of non-repainting technology. Once a Super Reversal Pattern is detected, it remains static, providing consiste
    Pivot Points MT4
    KEENBASE SOFTWARE SOLUTIONS
    KT Pivot Points 会根据最新市场数据自动在图表上绘制每日、每周和每月的枢轴点位。这是外汇市场中广泛使用的技术分析工具之一,用于识别潜在的支撑和阻力区域。 功能特点 当价格触及枢轴点时发送提醒。  每种枢轴点类型都支持全面自定义。   无须复杂设置即可显示日线、周线和月线的枢轴点位。 占用 CPU 资源极少,计算速度快。 可与图表上的其他指标兼容使用。 什么是枢轴点 枢轴点是通过上一交易日(或交易周期)的最高价、最低价和收盘价计算出的平均值。  通过计算得出的枢轴点可以预测未来的支撑和阻力位,帮助判断价格在这些关键水平附近的走势。 通常认为,如果价格高于枢轴点,市场情绪偏多;反之,则偏空。 枢轴点计算公式 我们使用前一天、一周或一个月的最高价、最低价和收盘价来计算枢轴点水平。 P = (H + L + C) / 3 R1 = P + (P − L) = 2×P − L S1 = P − (H − P) = 2×P − H R2 = P + (H − L) S2 = P − (H − L) R3 = H + 2×(P − L) = R1 + (H − L) S3 =
    Infinity Trend Pro
    Yaroslav Varankin
    1 (1)
    This is a trend indicator without redrawing Developed instead of the binary options strategy (by the color of the Martingale candlestick) Also works well in forex trading When to open trades (binary options) A signal will appear in the place with a candle signaling the current candle It is recommended to open a deal for one candle of the current timeframe M1 and M5 When a blue dot appears, open a deal up When a red dot appears, open a trade down. How to open trades on Forex. When a signal is rec
    Pivot Pro
    Igor Semyonov
    Description Pivot Pro  is a universal color indicator of the  Pivot Points  levels systems. You can select one of its three versions:  Standard   Old , Standard New  and  Fibo . The system will automatically calculate the  Pivot Point  on the basis of market data for the previous day ( PERIOD_D1 ) and the system of support and resistance levels, three in each. It can also display price tags for each level. You can color the indicator lines. Only a method of calculation of the third level of supp
    Trade with Gann on your side!! MASTER CIRCLE 360 CIRCLE CHART, originally created by Gann admitted that this is “The Mother of all charts”. It is one of the last studies that this great trader left for us. The numeric tab le is apparently quite simple like all the tables and is based on square numbers, the SQUARE OF 12 and is by evolution, one of the most important square numbers. Here we can find CYCLE, PRICE AND TIME thanks to angles and grades, to show past and future support and resistance.
    Paper Fly
    Md Meraz Mahmud
    non-repaint free MT4 technical indicator works on all timeframes 1 minute to the monthly timeframe  the trade vision buy and sell arrow is a multi currency and synthetic indicator Trade vision buy and sell arrow comes with Push Alerts purple arrow look for selling opportunities white arrow look for buying opportunities.  wait for candle to close and arrow to appear before taking any trades
    Magic Filter MTF
    Yaroslav Varankin
    Magic Filter MTF is perfect for any strategy. you do not need to load the chart with extra indicators like this one indicator will replace all additional filters for you it can also be a great strategy. it combines well with trading at local minima and maximums (resistance levels) multi-timeframe-multi-currency indicator 4 screen system is used 4 rows of arrows UTB indicators adjusted for different periods when two arrows pointing in the same direction on the same timeframe coincide,I t c
    该产品的买家也购买
    Gann Made Easy
    Oleg Rodin
    4.83 (162)
    Gann Made Easy 是一个专业且易于使用的外汇交易系统,它基于使用先生理论的最佳交易原则。 W.D.江恩。该指标提供准确的买入和卖出信号,包括止损和获利水平。您甚至可以使用推送通知在旅途中进行交易。 购买后请联系我,即可免费获得交易指导和超棒的额外指标! 您可能已经多次听说过江恩交易方法。通常 Gann 的理论不仅对于新手交易者而且对于那些已经有一定交易经验的人来说都是非常复杂的东西。这是因为江恩的交易方法在理论上并不那么容易应用。我花了几年时间来完善这些知识,并将最好的原则应用到我的外汇指标中。 该指标非常易于应用。您所需要的只是将其附加到您的图表并遵循简单的交易建议。该指标不断进行市场分析工作并寻找交易机会。当它检测到一个好的入口点时,它会为您提供一个箭头信号。该指标还显示止损和获利水平。 换句话说,当您像先生一样进行交易时,该指标会为您提供最佳江恩建议。江恩亲自告诉你此时此刻该做什么。但最好的部分是您不需要了解任何有关江恩交易原则的知识,因为该指标会为您完成整个市场分析工作。
    The Propfolio Master Suite is the ultimate all-in-one analytical workstation for professional traders. Combining the power of the Beat The Market Maker (BTMM) methodology, Smart Money Concepts (SND/Liquidity), and Advanced Volume Profile, this suite replaces multiple different indicators with one optimized engine. Monitor up to 14 pairs simultaneously from a single chart, instantly identify market cycles, and seamlessly map institutional footprints with the click of a button. The Command Center
    M1 Sniper
    Oleg Rodin
    5 (23)
    M1 SNIPER 是一款易于使用的交易指标系统。它是一个专为 M1 时间框架设计的箭头指标。该指标可以作为独立的系统在 M1 时间框架下进行剥头皮交易,也可以作为您现有交易系统的一部分使用。虽然该交易系统专为 M1 时间框架交易而设计,但它也可以用于其他时间框架。我最初设计此方法是为了交易 XAUUSD 和 BTCUSD。但我发现这种方法在其他市场交易中也同样有用。 指标信号既可以顺势交易,也可以逆势交易。我教授一种特殊的交易技巧,帮助您利用指标信号进行双向交易。该方法基于使用特殊的动态支撑位和阻力位区域。 购买后,您可以立即下载 M1 SNIPER 箭头指标。此外,我还为所有 M1 SNIPER 工具用户免费提供下方屏幕截图所示的 Apollo Dynamic SR 指标!这两个指标的组合可以帮助您更轻松、更准确地利用 M1 时间框架进行交易。 购买后请联系我,免费获取交易提示和奖励指标! 祝您交易成功!
    Auto Optimized Parabolic RSI: 高级 3D 动量引擎 大多数零售指标之所以失效,是因为它们依赖于静态输入,一旦市场波动率发生变化,这些输入就会崩溃。Auto Optimized Parabolic RSI 通过不断重新计算自身的数学优势,解决了“指标衰退”的问题,将机构级别的量化自适应能力直接引入您的 MT5 终端。 核心优势:定制的内存 3D 优化   标准的自动优化器通常会导致 MT5 平台卡顿,因为它们通过标准的指标调用使终端超载。该工具完全绕过了这些性能瓶颈。内部引擎采用定制的原生基于 RAM 的计算器构建,每次加载图表或更改时间周期时,它都会执行极速的 3D 网格搜索。它同时扫描 RSI 周期(频率)、SAR 步长(加速度)和 SAR 最大值(速度限制),在绝对的毫秒级时间内测试数以万计的参数组合,且完全不会拖慢您的平台。它不是仅仅寻找一个“不错”的设置,而是映射整个参数空间,以寻找资产当前动量结构的绝对全局最大值。 严格的财务评分与逼真的交易模拟   与基于抽象“指标点数”进行优化评分的业余工具不同,该引擎的 3.10 版本严格与资金数学挂钩。每
    PZ Harmonacci Patterns
    PZ TRADING SLU
    3.17 (6)
    可以说,这是您可以为MetaTrader平台找到的最完整的谐波价格形成自动识别指标。它检测19种不同的模式,像您一样认真对待斐波那契投影,显示潜在的反转区域(PRZ),并找到合适的止损和获利水平。 [ 安装指南 | 更新指南 | 故障排除 | 常见问题 | 所有产品 ] 它检测19种不同的谐波价格形态 它绘制了主要,衍生和互补的斐波那契投影(PRZ) 它评估过去的价格走势并显示每个过去的形态 该指标分析其自身的质量和性能 它显示合适的止损和获利水平 它使用突破来表明合适的交易 它在图表上绘制所有样式比率 它实现了电子邮件/声音/视觉警报 受斯科特·M·卡尼(Scott M. Carney)的书的启发,该指标旨在满足最纯粹和最熟练的交易者的需求。但是,它采取了一种使交易更容易的方式:在向交易发出信号之前,它会等待Donchian朝正确方向突破,从而使交易信号非常可靠。 斐波那契投影与向量无关 它实现了电子邮件/声音/推送警报 它绘制了ABCD投影 重要提示: 为了符合 Scott M. Carney先生 的商标申诉,某些图案名称已重命名为不言自明的替代方式, Scott M.
    Scalper Inside PRO
    Alexey Minkov
    4.74 (69)
    Scalper Inside PRO – Since 2020. An exclusive indicator that utilizes an innovative algorithm to swiftly and accurately determine the market trend. The indicator automatically calculates opening, closing, and profit levels, providing detailed trading statistics. With these features, you can choose the most appropriate trading instrument for the current market conditions. Additionally, you can easily integrate your own arrow indicators into Scalper Inside Pro to quickly evaluate their statistics
    PRO Renko System
    Oleg Rodin
    5 (30)
    PRO Renko Arrow Based System for trading renko charts.  准确的信号交易任何外汇工具. 另外,我将免费提供系统的附加模块! PRO Renko系统是RENKO图表上高度准确的交易系统。该系统是通用的。 该交易系统可应用于各种交易工具。 该系统有效地中和了所谓的市场噪音,打开了获得准确反转信号的通道。 该指标易于使用,只有一个参数负责产生信号。 您可以很容易地使算法适应您感兴趣的交易工具和renko酒吧的大小。 我很乐意通过提供任何咨询支持来帮助所有客户有效地使用该指标。 祝您交易成功!购买后,立即写信给我! 我将与您分享我的建议和我的renko发电机。 另外,我将免费提供系统的附加模块!
    Quants HL Break
    Ferhat Mutlu
    5 (2)
    通過純價格行為進行高級計算,以找到 LH 和 HL 突破。 它會給你一個很好的市場反轉點。 LH 和 HL 信號也可用於 traingle 突破。 一旦突破發生,則表明強烈反轉。 移動平均線的漂亮過濾器。 我強烈建議將其與趨勢指標一起使用。 可用作支撐和阻力、供需指標的額外確認。 可以在以下外匯線程中找到更多詳細信息: 該指標未重新繪製。 Buffers :   SetIndexBuffer ( 0 ,UpBar);      SetIndexBuffer ( 1 ,UpBar2);           SetIndexBuffer ( 2 ,DnBar);      SetIndexBuffer ( 3 ,DnBar2);           SetIndexBuffer ( 4 ,UpBarTop);      SetIndexBuffer ( 5 ,UpBarLow);                    SetIndexBuffer ( 6 ,DnBarTop);      SetIndexBuffer ( 7 ,DnBarLow);           SetIn
    Quantum Breakout Indicator PRO
    Bogdan Ion Puscasu
    4.96 (26)
    介绍     Quantum Breakout PRO   ,突破性的 MQL5 指标,正在改变您交易突破区域的方式!   Quantum Breakout PRO 由拥有超过 13 年交易经验的经验丰富的交易者团队开发,旨在通过其创新和动态的突破区域策略将您的交易之旅推向新的高度。 量子突破指标将为您提供带有 5 个利润目标区域的突破区域的信号箭头,以及基于突破框的止损建议。 它既适合新手交易者,也适合专业交易者。 量子 EA 通道:       点击这里 MT5版本:   点击这里 重要的!购买后请私信我领取安装手册。 建议: 时间范围:M15 货币对:GBPJPY、EURJPY、USDJPY、NZDUSD、XAUUSD 账户类型:ECN、Raw 或 Razor,点差极低 经纪商时间:GMT +3 经纪商:IC Markets、Pepperstone with Raw 和 Razor 的点差最低 规格: 不重漆! 最多 5 个建议利润目标区域 建议止损水平 可定制的盒子。您可以设置自己的 Box Time Start 和 Box Time End。 接触 如果您
    购买此指标即可免费获得我的专业交易管理器。 首先,值得强调的是,这个交易系统是一个非重绘、非重画和非滞后的指标,这使得它非常适合手动和机器人交易。 在线课程,手册和下载预设。 “智能趋势交易系统 MT5”是专为新手和经验丰富的交易者量身定制的综合交易解决方案。它结合了超过 10 个优质指标,具有 7 多个强大的交易策略,使其成为适用于各种市场条件的多功能选择。 趋势跟随策略:提供精确的入场和止损管理,以有效地跟随趋势。 反转策略:识别潜在的趋势反转,使交易者能够利用区域市场的机会。 剃头策略:专为快速准确的日内交易和短期交易而设计。 稳定性:所有指标都不会重绘、不会重画和不会滞后,确保可靠的信号。 定制:支持自定义策略,以满足个人交易偏好。超过 7 种策略和组合可帮助您找到最佳策略。 信号清晰度:提供箭头信号,以指示清晰的入场和退出点。 实时警报:通过交易进出警报使交易者保持了解。 深入分析:提供更高时间框架的趋势分析和实时交易监控。 自适应颜色编码:利用蜡烛颜色编码来显示成交量、趋势和反转蜡烛信号。通过蜡烛颜色分析市场方向。 “智能趋势交易系统 MT5”赋予交易者必要的工具,以便在
    Advanced Currency Strength28 Indicator
    Bernhard Schweigert
    4.91 (657)
    目前40%的折扣 任何新手或专家交易者的最佳解决方案! 这个指标是一个独特的、高质量的、可负担得起的交易工具,因为我们纳入了一些专有的功能和一个新的公式。只需一个图表,你就可以读出28个外汇对的货币强度!想象一下,你的交易将如何得到改善,因为你的交易是在你的手中进行的。想象一下,你的交易将如何改善,因为你能够准确地确定新趋势或剥头皮机会的触发点? 用户手册:点击这里  https://www.mql5.com/en/blogs/post/697384 这是第一本,原版的! 不要买一个毫无价值的崇拜者的克隆品。 特别的 子窗口中的箭头显示强劲的货币势头GAP将指导你的交易! 当基础货币或报价货币处于超卖/超买区域(外盘斐波那契水平)时,在个人图表的主窗口中出现警告信号。 当货币力量从外围区间回落时,回撤/反转警报。 十字星模式的特别警报 可选择多个时间框架,以快速查看趋势! 货币强度线在所有的时间框架中都非常平稳,当使用较高的时间框架来识别总体趋势,然后使用较短的时间框架来确定精确的入口时,效果非常好。你可以根据自己的意愿选择任何时间框架。每个时间框架都由其自身进行了优化。
    GoldRush Trend Arrow Signal
    Kirk Lee Holloway
    5 (2)
    GoldRush 趨勢箭頭信號 GoldRush 趨勢箭頭信號 指標為 XAU/USD 中的高速、短期短線交易者提供精確、實時的趨勢分析。 專為1分鐘時間框架設計,此工具顯示方向箭頭以明確顯示入場點,使短線交易者能在波動市場中自信操作。 該指標包含主要和次要警示箭頭。主要信號為白色和黑色方向箭頭,用於指示趨勢方向的轉變;次要信號為藍色和紅色箭頭,用於確認主要箭頭指示的方向並提示潛在交易入場點。 注意:當趨勢方向發生變化後僅出現一個主要警報箭頭時,請注意可能會出現多個次要藍/紅箭頭。次要信號將在滿足信號標準的任何蠟燭圖後出現,因此在長期趨勢移動中,螢幕上將顯示大量次要箭頭(如附帶的截圖所示)。您可在設置中開啟或關閉任一箭頭類型。 以下是我使用此指標進行交易的方式: - 對於買入入場,我會耐心等待白箭頭在蠟燭收盤時出現,並在下一根可用蠟燭收盤時出現藍箭頭時進行買入交易。 - 對於賣出入場,我會耐心等待黑箭頭在蠟燭收盤時出現,並在下一根可用蠟燭收盤時出現紅箭頭時進行賣出交易。 - 獲利了結/止損設置由使用者自行負責,但我個人使用最低R:R為1:2,並發現這在倫敦/紐約開盤等
    Day Trader Master
    Oleg Rodin
    5 (15)
    Day Trader Master 是一个完整的日间交易者交易系统。该系统由两个指标组成。一个指标是买入和卖出的箭头信号。这是你得到的箭头指示器。我将免费为您提供第二个指标。第二个指标是专门设计用于与这些箭头结合使用的趋势指标。 指标不重复也不迟到! 使用这个系统非常简单。您只需按照当前趋势方向的箭头信号,显示为双色线。蓝色是买入趋势。红色是一种销售趋势。蓝色箭头是买入信号。红色箭头是卖出信号。您需要箭头的颜色和信号的方向来匹配趋势线的颜色。 箭头指标主要是为 M5 和 M15 时间间隔的日内交易而创建的。但从技术上讲,该系统可以用于其他时间间隔。 指示器配备带有推送消息功能的弹出警报。 购买后一定要写信给我!我将为您提供与系统交易的个人建议,以及我的趋势指标。此外,还有丰厚的奖励等着您!
    Apollo SR Master
    Oleg Rodin
    5 (2)
    Apollo SR Master 是一款支撑/阻力指标,其特殊功能使利用支撑/阻力区域进行交易更加便捷可靠。该指标通过检测局部价格顶部和底部,实时计算支撑/阻力区域,没有任何时间延迟。为了确认新形成的支撑/阻力区域,该指标会显示特殊信号,表明该支撑/阻力区域可以作为实际的卖出或买入信号。在这种情况下,支撑/阻力区域的强度会增强,因此从该区域进行交易的成功率也会更高。这正是该指标的核心理念。 SR区域也使止损和止盈的操作更加便捷。根据信号方向,可以将SR区域上方或下方的空间用作止损位。此外,相对的SR区域也可以用作潜在的止盈区域。 我还免费向所有 Apollo SR Master 指标的用户提供我的“Apollo 价格行为系统”指标。这两个指标结合使用将帮助您找到更好的入场点。 购买后请联系我,即可免费获得我的交易技巧以及我的“阿波罗价格行为系统”指标作为赠品!
    Market Makers
    Mohamed Hassan
    5 (4)
    After purchase, contact me privately to receive 1 month of free testing with EA Forex Proton! This advanced MT4 trading robot automatically executes signals from any MT4 indicator, including Market Makers. The latest version also includes AI integration, allowing each trade signal to be analyzed using Artificial Intelligence. Live Signal with EA Forex Proton: Click here Market Makers is a powerful price action trading system designed to identify high-probability Buy and Sell opportunities based
    Market Structure Patterns MT4
    Samuel Manoel De Souza
    5 (18)
    Market Structure Patterns   is an indicator based on   smart money concepts   that displays   SMC/ICT   elements that can take your trading decisions to the next level. Take advantage of the   alerts ,   push notifications   and   email messages   to keep informed from when an element is formed on the chart, the price crosses a level and/or enters in a box/zone. Developers can access the values of the elements of the indicator using the   global variables  what allows the automation of trading d
    Advanced Supply Demand
    Bernhard Schweigert
    4.91 (300)
    现在优惠 40%! 任何新手或专业交易者的最佳解决方案! 该指标是一款独特、高质量、且价格合理的交易工具,因为我们已经整合了许多专有功能和新公式。 依据此更新,您将能够显示双重时间帧区域。 您不仅可以显示一个较高的时间帧,还可以同时显示图表时间帧,加上更高的时间帧:显示嵌套时区。 供需双方所有交易者都会喜欢它。 :) 重要信息披露 高级供需的最大潜力,请访问 https://www.mql5.com/zh/blogs/post/720245   想象您的交易如何得以改善,是因为您能够精准定位入场或目标位吗? 构建于新的底层算法,它可以更轻松地识别出买卖双方之间的潜在失衡。 这是因为它以图形方式展示供需最强劲区域,及其过去的表现(显示旧区域)。 这些功能旨在帮助您更轻松地发现最佳入场区域和价位。 现在您可以针对您的交易品种和时间帧来优化和编辑区域强度! 高级供需指标适用于所有产品和时间帧。 它是一个新的公式,非常新的功能是两个区域强度函数可由用户输入进行调整! 这在交易中是一大优势。 当您学习如何使用专有功能,例如带有价格游离最小 X 因子的区域强度时,您能够判断该区域强劲与否。 供需
    PZ Turning Points MT4
    PZ TRADING SLU
    1 (1)
    该指标检查不同时期分形的价格结构,以确定市场中可能的反转点,从而为已经具有基本或技术估值模型的仓位交易者提供时机。与它的弟弟 Reversal Fractals不同 ,该指标不会因为所选时期而错过反转,并且会以之字形方式找到反转分形,而忽略那些没有足够动量来引发持续价格波动的反转。 [ 安装指南 | 更新指南 | 故障排除 | 常见问题 | 所有产品 ] 转折点可以开始长期趋势 指示器不重涂 它实现了各种警报 可自定义的颜色和尺寸 该指示符是无功或滞后信号,因为分形是奇数个条形的地层,是中间地带中最高或最低的条形,并且指示符在分形中的所有条形都闭合时绘制。但是,具有预先设定的方向偏差的交易者会发现该指标非常有用,可以提早进入切入点。 该指标既不是下探信号指标,也不是完整的交易系统。请不要这样评价或审查它。 输入参数 最小分形数:分形上的最小条形数。必须为奇数,例如3、5、7、9、11、13,... 最大分形:分形上的最大条形数量。必须为奇数,例如3、5、7、9、11、13 ... 最大历史柱数:指标加载时评估的过去柱数。 颜色:自定义箭头和线条的颜色和大小。 警报:启用或禁用各
    Dynamic Scalper System
    Vitalyi Belyh
    5 (1)
    “ Dynamic Scalper System ”指标专为在趋势波内进行剥头皮交易而设计。 已在主要货币对和黄金上进行测试,并可与其他交易工具兼容。 提供顺势短线建仓信号,并提供额外的价格变动支持。 指标原理: 大箭头决定趋势方向。 在趋势波内,我们采用一种生成小箭头形式的剥头皮交易信号的算法。 红色箭头代表看涨方向,蓝色箭头代表看跌方向。 敏感的价格变动线会沿着趋势方向绘制,并与小箭头信号协同作用。 信号运作方式如下:当线在适当时刻出现时,将形成入场信号;在出现线时,持仓;线完成后,平仓。 建议的操作时间范围为M1 - H4。 箭头在当前K线上方形成,如果下一根K线已开仓,则不会重新绘制上一根K线上方的箭头。 输入参数 Trend Wave Period - 趋势方向(大箭头)的周期,改变趋势波的时间间隔。值 1 表示趋势方向的最长持续时间,参数值越大,持续时间越短。 Scalper Arrows Period - 信号箭头(小箭头)的计算周期,改变入场信号的生成频率。值 3 表示最频繁的生成频率,参数值越大,箭头频率越低,准确度越高。 这些参数可以根据不同的时间范
    They say history repeats itself. What if you could prove it in real-time? The Propfolio Ghost Pattern is an advanced algorithmic pattern-matching engine. It empowers you to select any current price action structure on your chart and instantly scan thousands of historical candles to find the exact moment in the past where the market did the exact same thing. Once it finds the highest probability match, it projects the historical outcome into the future as "Ghost Candles"—giving you a highly calcu
    目前有26%的折扣!! 这个指标是我们两个主要指标( Advanced Currency Strength 28   &  Advanced Currency IMPULSE with ALERT )的一个超级组合。它显示了28个外汇对的TICK-UNITS货币强度值和警报信号。可以使用11种不同的Tick-Units。它们是1、2、3、4、5、6、10、12、15、20和30秒。子窗口中的Tick-Unit栏将被显示并向左移动,当在一秒钟的定时器中至少有一个Tick。 只用一个图表,你就可以剥28个外汇货币对的头皮!想象一下,你的剥头皮将如何提高。想象一下,你的剥头皮将如何改善,因为你能够准确地确定剥头皮机会的触发点? 这是市场上第一个在比1分钟更短的时间内工作的货币强度指标! 它是为那些希望快速进出并从市场中切出小点数的快速剥头皮者准备的。 用户手册:点击这里 https://www.mql5.com/en/blogs/post/727178 特点。 为28个货币对提供嘀嗒单位的卖出/买入警报,有一个按钮可以快速打开目标图表。 在3种敏感模式中选择一种(慢-中-快
    Atomic Analyst
    Issam Kassas
    5 (5)
    首先值得强调的是,该交易指标是非重绘、非延迟的指标,这使其成为手动和机器人交易的理想选择。 用户手册:设置、输入和策略。 Atomic Analyst是一种PA价格行动指标,利用价格的力量和动量来寻找市场上更好的机会。配备了高级过滤器,可帮助去除噪音和假信号,并提高交易潜力。使用多层复杂的指标,Atomic Analyst扫描图表,并将复杂的数学计算转化为任何初学者都能理解并用来做出一致交易决策的简单信号和颜色。 “Atomic Analyst”是专为新手和经验丰富的交易者量身定制的综合交易解决方案。它将高级指标和一流功能融合为一体的交易策略,使其成为所有类型交易者的多功能选择。 日内交易和剥头皮策略:专为快速准确的日内交易和短期交易而设计。 日内和摆动交易策略:可用作追求价格大幅波动的日内和摆动交易者的可靠工具。 多货币和市场:凭借其可靠的精度,在不同的工具和市场上运作。 多个时间框架:可在多个时间框架上使用,性能良好。 稳定性:所有指标均不重绘、不重绘和不滞后,确保可靠的信号。 信号清晰度:提供箭头信号,用于清晰的入场和出场点。 实时警报:通过交易入场、SL和TP警报通知交易者
    KURAMA GOLD SIGNAL PRO(MT4版)— 7层过滤器、自动TP/SL、品质评分搭载 XAUUSD完整交易系统 不重绘。不重画。不延迟。每个信号永久固定。所见即所得。 福利:购买买断版许可证可免费获得 AI Zone Radar(价值$59)+ 完整PDF手册。购买后请给我发消息。 AI Zone Radar: https://www.mql5.com/en/market/product/175834 交易员的信赖:已被活跃的黄金交易员社区使用。因精度和易用性获得赞誉。 你的问题 — 以及解决方案 你知道黄金每天波动$30-50。你知道这里有钱可赚。但是: - 入场过早,价格反向$10后才朝你的方向走 - 每次MA触碰都入场,结果一半都失败 - 没有TP/SL系统,所以持仓太久或离场太早 - 在死寂时段交易,然后想为什么什么都不顺 KURAMA GOLD SIGNAL PRO解决了这一切。不是用一个过滤器,而是七个。 工作原理 — 3步 1. 图表上出现箭头信号 2. 在面板上查看TP价格、SL价格、品质评分、风险回报比 3. 下单并等待 无
    PZ Double Top Bottom
    PZ TRADING SLU
    5 (1)
    该指标找到双顶和双底反转形态,并使用突破引发交易信号。 [ 安装指南 | 更新指南 | 故障排除 | 常见问题 | 所有产品 ] 清除交易信号 可自定义的颜色和尺寸 实施绩效统计 可定制的斐波那契回撤水平 它显示合适的止损和获利水平 它实现了电子邮件/声音/视觉警报 这些图案可以扩展,并且指示器通过重新绘制跟随图案。但是,该指标采用了一种扭曲方式,以使其更容易交易:它在向交易发出信号之前等待Donchian突破,然后发出交易信号,使其信号非常可靠,并且几乎没有重涂。 输入参数 幅度:幅度表示替代价格点之间的最小柱线量。要找到大图案,请增加幅度参数。要查找较小的模式,请减小幅度参数。 闵。回撤:形态中所需的最小斐波那契回撤。 最大。回撤:形态中可能的最大斐波那契回撤。 最大历史柱数:指标在图表中加载时要评估的过去柱数。 显示统计信息:显示或隐藏统计信息显示板和效果数据。 显示SL / TP电平:显示或隐藏每个信号的合适的止损和获利水平。 绘图选项:看涨或看跌的线条和标签的颜色和大小以及字体大小。 突破:突破箭头的颜色和大小。 警报:启用或禁用各种警报。 作者 Arturo
    Gold Scalper Super
    Aleksandr Makarov
    5 (2)
    Gold Scalper Super is an easy-to-use trading system. The indicator can be used as a standalone scalping system on the M1 time frame, as well as part of your existing trading system. Bonus: when purchasing an indicator, Trend Arrow Super is provided free of charge, write to us after purchase. The indicator 100% does not repaint!!! If a signal appears, it does not disappear! Unlike indicators with redrawing, which lead to the loss of a deposit, because they can show a signal and then remove it.
    Cyclic Impulse
    Vitalyi Belyh
    构建图表并识别周期性价格变动的技术指标。 可以在任何图表上工作。 几种类型的通知。 图表本身还有额外的箭头。 无需重新绘制历史记录,只需关闭蜡烛即可。 建议使用 M5 及以上的 TF。 易于使用和配置参数。 当使用 2 个具有不同参数的指标时,您可以单独使用它们,而无需其他指标。 有 2 个输入参数 周期性和信号持续时间 这两个参数处理图表结构的处理。 Cyclicity 调节反转周期的变化频率,平滑周期。 Signal duration 为最小数字,检测价格变动中的脉冲,最大长期趋势变动。    ---------------------------------------------------------------------------------------
    KuKl
    IGOR KIRIANEN
    The indicator is built on a non-standard Zig Zag, it draws accumulations after which if the price leaves this zone and a test of this zone occurs, then a sound signal is given and an arrow appears - after the test candle closes.The indicator does not redraw its signals, it is very easy to use, there are only three settings 1- this is the zig zag parameter 2- this is the minimum price exit from the zone 3- this is the maximum price exit from the zone. The lower the parameter for Zig Zag, the more
    Trend Screener
    STE S.S.COMPANY
    4.79 (95)
    趋势指标,趋势交易和过滤的突破性独特解决方案,所有重要趋势功能都内置在一个工具中! 它是 100% 非重绘多时间框架和多货币指标,可用于所有符号/工具:外汇、商品、加密货币、指数、股票。 限时优惠:支撑和阻力筛选指标仅售 65美元,终身有效。(原价 250 美元)(优惠延长) 趋势筛选器是有效的指标趋势跟踪指标,它在图表中提供带有点的箭头趋势信号。 趋势分析器指标中可用的功能: 1.趋势扫描仪。 2. 具有最大利润分析的趋势线。 3.趋势货币强度计。 4. 带有警报的趋势反转点。 5. 带有警报的强趋势点。 6. 趋势箭头 每日分析示例,每日信号表现...等与我们的趋势筛选指标,可以在这里找到: 点击这里 限时优惠:Trend Screener Indicator 仅售 150 美元且终身可用。原价 199$) 通过访问我们的 MQL5 博客,您可以找到我们所有的高级指标以及分析示例、每日信号表现...等。 : 点击这里 我们的趋势系统由 2 个指标组成: 1. Trend Screener Indicator:显示趋势仪表盘、图表中的趋势线、入场点...等。 2. Trend
    Advanced UT BOT ALERTS for MT4 專業多重濾波趨勢識別系統|強化版 UT BOT 引擎 我們只提供高品質的指標。 Advanced UT BOT 為專業交易者設計,採用穩定的信號邏輯與安全運算結構,確保無延遲與錯誤更新。 它 不會重繪、不會重畫、不會刪除或修改 任何過去的信號。 所有 BUY 和 SELL 信號均在 K 線收盤後生成並固定 ,確保穩定性與準確性。 在即時行情中 不會重繪 ,信號會在收盤後即時出現。 限時優惠中 —— 下一次價格將調整為 49 美元。 請把握現在的優惠價格,售完即漲。 產品概述 Advanced UT BOT ALERTS   是新一代的趨勢信號系統,基於   UT BOT   的核心邏輯重新打造, 全面升級為 MT5 版本,融合多重濾波、動態視覺化與高精度警報系統。 UT Bot 指標最初由   Yo_adriiiiaan   開發,本版本由   PioneerAlgoFX   團隊深度強化, 在穩定性、精準度與自訂性方面均達到專業級水準,為實戰交易者而設計。 此系統能夠高精準地識別趨勢反轉與動能變化, 透過多層動態濾波與
    Delta Fusion Pro
    Francesco Secchi
    5 (2)
    Delta Fusion Pro – 高级订单流分析,专为日内交易设计 Delta Fusion Pro 是一款专业的 MetaTrader 4 指标,能够揭示市场中的主动订单流,实时显示机构压力的强度和方向。与传统的成交量指标不同,它分析买盘(Ask)与卖盘(Bid)之间的成交量差值(Delta),用于提前预测反转、确认趋势并识别专业兴趣区域。 主要特点 智能自动调节系统 根据以下条件自动调整所有参数: 交易品种类型(外汇、加密货币、指数、大宗商品、股票) 操作周期 市场波动率(ATR) 最近平均成交量 无需手动配置,适合新手交易者——指标自动完成校准! 核心功能 净Delta与累计Delta 计算主动买盘/卖盘成交量差值,支持自定义 EMA 平滑 实时显示方向性压力 可自定义直方图颜色(买入/卖出) 价格/成交量背离 自动检测常规与隐藏背离 强度分类:强/中/弱 高级过滤:成交量确认、趋势、时间距离 图形信号(彩色箭头) 市场失衡 识别显著的买盘/卖盘比例失衡(可配置比率) 最小成交量阈值验证 图表显示彩色点(多头/空头) Infusion Volume 检测异常成交量峰值(
    作者的更多信息
    Fractal Pivot Lines — Indicator Overview  Fractal Pivot Lines is a custom trend-structure indicator for MetaTrader 4 . It automatically connects key fractal highs and lows with dynamic lines so you can see how price is respecting local structure, building channels, and preparing for potential reversals. Instead of staring at dozens of candles and guessing where the real pivots are, the indicator turns fractals into clear support/resistance paths and trend channels . What the Indicator Does C
    Reverse Engineered RSI   Introduction Reverse Engineered RSI transforms the way traders use the RSI indicator. Instead of displaying RSI in a separate oscillator window, this tool projects the key RSI levels — 30, 50, and 70 — directly onto the price chart . This allows traders to see where overbought, oversold, and equilibrium zones align with actual price levels — without switching charts or guessing momentum conditions. You get precise RSI-derived support and resistance levels right on the c
    Reversing MACD — Indicator Overview Reversing MACD is a forward-looking analytical tool that calculates the exact price the next bar would need to reach for the MACD line and the signal line to cross on the upcoming candle . Instead of waiting for a crossover to occur after the fact, the indicator answers a more powerful question: “At what price will the MACD cross on the very next bar ?” Core Idea Behind the Indicator Traditional MACD reacts to price changes after they occur . A trader only see
    Projected Moving Average  A clean and practical moving-average tool designed for traders who want a clearer view of short-term and medium-term trend direction. The Projected Moving Average shifts a standard SMA forward by half of its period, creating a smooth projection zone that updates dynamically with each new candle. This makes it easier to visually anticipate where the moving average is heading without repainting past values. Key Features Forward-shifted SMA (Length/2) for clearer trend pro
    Weinstein Stage Analysis (MTF) – Professional Market Structure Indicator This indicator implements   Stan Weinstein’s Stage Analysis   in a clean, modern, and fully   MTF-correct   way for MetaTrader 5. It automatically identifies the four classical market stages: Stage 1 – Base / Accumulation Stage 2 – Advancing Trend Stage 3 – Distribution Stage 4 – Declining Trend Unlike many simplified versions, this indicator: Calculates the trend   on a higher timeframe moving average Projects the correct
    Bollinger Trend Lines – MT4 & MT5 Bollinger Trend Lines   is a professional volatility-based trend indicator designed to clearly identify trend direction and dynamic stop levels using Bollinger Bands. Fuses on one core principle: follow the trend, ignore noise, and let volatility define the stop. How it works The indicator builds   trailing trend lines   using Bollinger Bands: In an   uptrend , the   lower band trails price and can only rise In a   downtrend , the   upper band trails pri
    Astro Composite – extended description Astro Composite builds a   composite cycle   by summing sine waves of selected planetary orbits. Each planet contributes a cyclic component (0 → 360), and an optional   phase shift   allows fine-alignment of the cycle start with market structure. The result is a smoother, more interpretable wave that highlights   dominant market phases   rather than short-term noise. Astro Composite focuses on planets with   historically observable market influence   and p
    Trend Stop  Introduction Trend Stop is a simple yet powerful trend-following and stop-placement tool for MetaTrader 5. It calculates the highest high or lowest low of the last N periods and plots a dynamic line that reacts instantly to trend changes. The result is a clean, reliable trend filter and a practical guide for placing optimal stop levels — without unnecessary noise or lag. Whether you’re a trend trader, swing trader, or scalper, Trend Stop helps you stay on the right side of the market
    Fractal Pivot Lines — Indicator Overview   Fractal Pivot Lines is a custom trend-structure indicator for MetaTrader 5 . It automatically connects key fractal highs and lows with dynamic lines so you can see how price is respecting local structure, building channels, and preparing for potential reversals. Instead of staring at dozens of candles and guessing where the real pivots are, the indicator turns fractals into clear support/resistance paths and trend channels . What the Indicator Does
    Reverse Engineered RSI   Introduction Reverse Engineered RSI transforms the way traders use the RSI indicator. Instead of displaying RSI in a separate oscillator window, this tool projects the key RSI levels — 30, 50, and 70 — directly onto the price chart . This allows traders to see where overbought, oversold, and equilibrium zones align with actual price levels — without switching charts or guessing momentum conditions. You get precise RSI-derived support and resistance levels right on the c
    Reversing MACD — Indicator Overview Reversing MACD is a forward-looking analytical tool that calculates the exact price the next bar would need to reach for the MACD line and the signal line to cross on the upcoming candle . Instead of waiting for a crossover to occur after the fact, the indicator answers a more powerful question: “At what price will the MACD cross on the very next bar ?” Core Idea Behind the Indicator Traditional MACD reacts to price changes after they occur . A trader only see
    Projected Moving Average  A clean and practical moving-average tool designed for traders who want a clearer view of short-term and medium-term trend direction. The   Projected Moving Average   shifts a standard SMA forward by half of its period, creating a smooth projection zone that updates dynamically with each new candle. This makes it easier to visually anticipate where the moving average is heading without repainting past values. Key Features Forward-shifted SMA (Length/2) for clearer trend
    Weinstein Stage Analysis (MTF) – Professional Market Structure Indicator This indicator implements Stan Weinstein’s Stage Analysis in a clean, modern, and fully MTF-correct way for MetaTrader 5. It automatically identifies the four classical market stages: Stage 1 – Base / Accumulation Stage 2 – Advancing Trend Stage 3 – Distribution Stage 4 – Declining Trend Unlike many simplified versions, this indicator: Calculates the trend on a higher timeframe moving average Projects the correct stage onto
    Bollinger Trend Lines – MT4 & MT5 Bollinger Trend Lines is a professional volatility-based trend indicator designed to clearly identify trend direction and dynamic stop levels using Bollinger Bands. Fuses on one core principle: follow the trend, ignore noise, and let volatility define the stop. How it works The indicator builds trailing trend lines using Bollinger Bands: In an uptrend , the lower band trails price and can only rise In a downtrend , the upper band trails price and can only
    Astro Composite – extended description Astro Composite builds a composite cycle by summing sine waves of selected planetary orbits. Each planet contributes a cyclic component (0 → 360), and an optional phase shift allows fine-alignment of the cycle start with market structure. The result is a smoother, more interpretable wave that highlights dominant market phases rather than short-term noise. Astro Composite focuses on planets with historically observable market influence and practical cycle l
    筛选:
    无评论
    回复评论