Trend Hunters Indicator


Note: The PRICE IS SUBJECT TO INCREASE AT ANY TIME FROM NOW!! DON'T MISS THIS BEST OFFER.

Dear traders once again I am very glad to introduce to you my another trading tool called "Trend Hunter Indicator".

This indicator is designed to help traders capture the trend from the beginning or the end of it. It is one of the indicator that if used wisely may 

help you improve in your trading decisions.


Timeframe


  • The indicator is for all timeframes


Pairs

  • The Indicator is for all pairs.


Market

  • This indicator can be used for all markets the forex, crypto, and stock market.


Settings

  • You don't have to change anything in the settings or you may change the colors in this section.
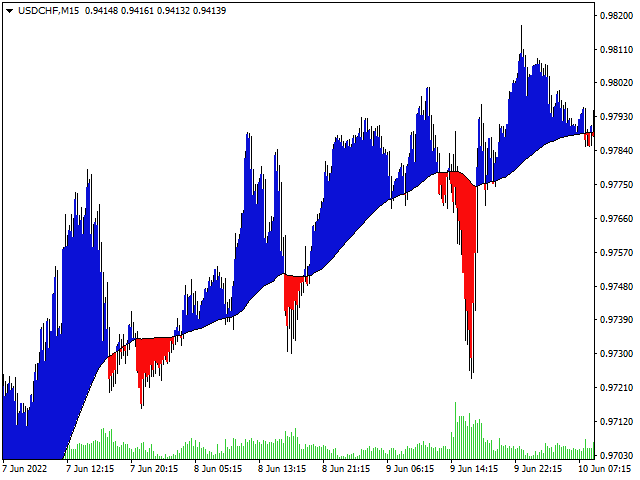
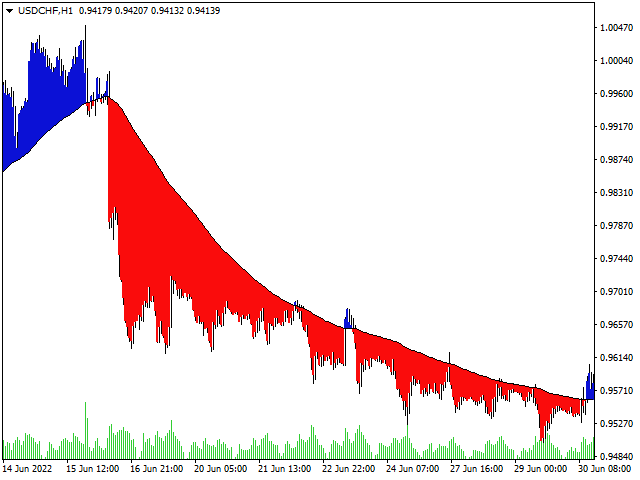
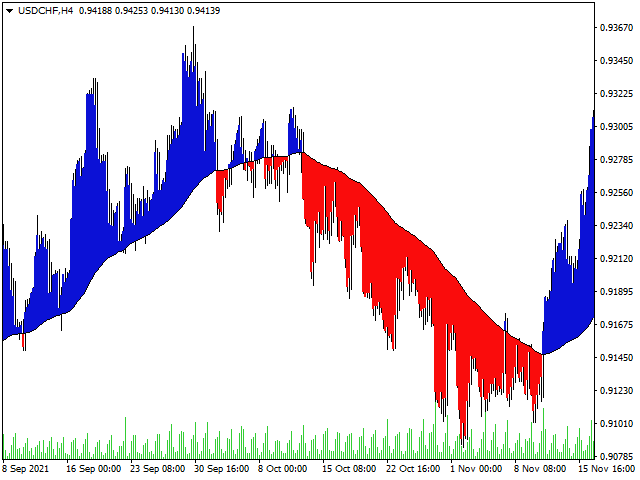
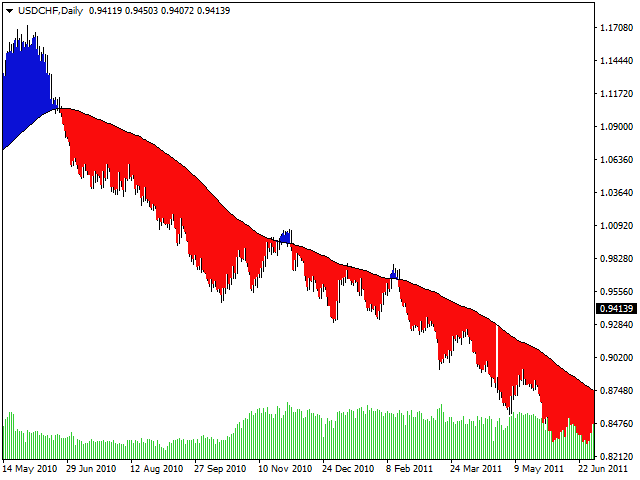

Signals

  •  The indicator will plot blue and red histograms.
  • Red for down trend or sell and Blue for uptrend or buy.

Finally/Last word

Disclaimer: There is no guaranteed 100% accurate signals from this tool. Therefore consider managing your capital wisely and you are responsible for every financial decision you make. Otherwise, thank you for valuing my product.


推荐产品
Power Renko MT4
Pierce Vallieres
Power Renko is an indicator which plots Renko bricks underneath the chart using a histogram. You can select the brick size and the timeframe of the Renko bricks as well as whether or not to use the close price or the high/low price of the candles. Renko bricks are based on price alone, not time, therefor the Renko bricks will not be aligned with the chart's time. They are extremely useful for trend trading and many different strategies can be formed from them. Buffers are provided allowing you t
FRB Time MT4
Fernando Baratieri
FRB Time - FRB Trader Indicator that shows the server's time of operation. You can edit the font color and size of the timetable. Settings font color Font size Background color To move the Timetable, just click on it and move the mouse to where you want to leave it. After placing the Time where you want it, click again or press "ESC" and the time will stay where you left it.
FREE
Market Imbalance
Scott Edward Merritt
4.6 (15)
What Is Market Imbalance? Market Imbalance, also known as "IPA" or Improper Price Action, is when price moves so quick in one direction with no orders on the other side of the market to mitigate the price movement. We all know Big Banks, or "Smart Money", can move the market by placing huge orders which in turn can move price significantly. They can do this because Big Banks are the top 10 Forex traders in the world . But unfortunately, the Big Banks cannot leave these orders in drawdown and mus
Median Renko Terminator
Lesedi Oliver Seilane
Median Renko Terminator works best with renko charts if you do not have a renko chart generator I will email it to you for free and give you the correct settings for scalping or to swing trade NON-REPAINT  COMES WITH ALERTS WHEN THERE IS A SIGNAL Conditions to sell: big purple arrow shows you the direction first then you take the small purple arrow to enter the same direction of the purple arrow. Conditions to buy: big white arrow shows you the up direction first then you take small white arrow
Rira Renko
Vitor Palmeira Abbehusen
RENKO on Time Chart This indicator is an enhanced Renko, so you can watch the Renko bricks on the chart to understand price movement more clearly the other improvement is automated box size according to ATR (Average True Range) period you can set the ATR number as you want and the box size of Renko changes automatically based on price movement Inputs Mode: Box size is the input to specify the size of the Renko box you want to print on the chart. This input lets you choose the fixed box siz
EurUsd Net Strength
Pieter Gerhardus Van Zyl
EURUSD Net Strength is a custom indicator designed to provide a clear view of the relative balance between Euro and U.S. Dollar pressure in the market. Instead of analyzing a single chart in isolation, it evaluates a basket of major EUR and USD currency pairs, applies weighted importance based on liquidity, and translates the combined result into a color-coded histogram. Green bars indicate periods when Euro demand outweighs Dollar strength, while red bars highlight when the Dollar dominates.
This indicator displays the ZigZag Pointer Fibonacci Expansion Triangle movements timeframes only M1-W1. Parameters InDepth: Displays the Depth movements. InDeviation: Displays the Deviation movements. InBackstep: Displays the Backstep movements. Fibonacci Expansion: Displays the Fibonacci Expansion movements. Fibonacci Expansion true.(false) Triangle: Displays the Triangle movements. Triangle true.(false) How to understand the status: If the Triangle is green, trend is up. If the Triangle is r
The BLACK ZONE PREMIUM INDICATOR is a powerful all-in-one trading assistant built to bring clarity, precision, and consistency to forex trading. It combines multi-timeframe market structure, trade forecasting, risk management, and live monitoring into one professional-grade tool. From planning trades to managing them with discipline, this indicator equips traders with everything they need to make informed and confident decisions. If you’ve been looking for a professional solution that simplifies
RaysFX Candlestick Exit  Il RaysFX Candlestick Exit è un indicatore di trading avanzato progettato per i trader che desiderano avere un controllo preciso sulle loro uscite di trading. Questo indicatore utilizza una combinazione di tecniche di trading per fornire segnali di uscita accurati e tempestivi. Caratteristiche principali: Range : Questo parametro consente di impostare il range di candele considerate per il calcolo dell’indicatore. Shift : Questo parametro consente di spostare l’indicator
适用于MT4平台的加密货币外汇指标:日内开盘价位 - “日内开盘价位”指标是一个非常实用的辅助指标。 - 日内开盘价位非常重要,因为价格经常会在一天中回到该区域。 - 该指标显示每日的开盘价位。 - 它对日内交易者设置目标价位或用作支撑/阻力位非常有用。 - “日内开盘价位”指标可用于日内反转交易。 .............................................................................................................. // 更多优秀的交易机器人和指标请访问: https://www.mql5.com/en/users/def1380/seller 本产品为MQL5原创产品,仅在MQL5网站提供。
MASi Three Screens
Aleksey Terentev
5 (2)
MASi Three Screens is based on the trading strategy by Dr. Alexander Elder. This indicator is a collection of algorithms. Algorithms are based on the analysis of charts of several timeframes. You can apply any of the provided algorithms. List of versions of algorithms:     ThreeScreens v1.0 - A simple implementation, with analysis of the MACD line;     ThreeScreens v1.1 - A simple implementation, with analysis of the MACD histogram;     ThreeScreens v1.2 - Combines the first two algorithms in
FREE
Chinetti pip collector XL is a complete turnkey trading system. If a trader does not yet have his own trading system, he can apply Chinetti pip collector XL to trading. Trading with this indicator is very easy. Even a beginner in Forex can handle it. Trading rules: wait for the indicator to start drawing a blue line. This means that the price trend is starting now. Now we are waiting for the indicator to analyze the market and draw an up arrow on the chart. At this point, we open a buy order.
UTBot with HTS filter
Bartlomiej Tadeusz Tomaja
Advanced UT Bot & HTS Indicator This indicator is an advanced technical analysis tool that combines two methods: UT Bot and HTS (Higher Timeframe Smoothing) , to generate accurate buy and sell signals. 1. Indicator Structure Works within the main chart window and utilizes 11 buffers to store various data points, including arrows (buy/sell signals) and bands from both UT Bot and HTS systems. Uses colored arrows to represent different trading conditions: Blue arrows : Normal buy signals. Red arro
Renko bars builder
Navdeep Singh
4.2 (5)
The indicator builds a Renko chart in the sub window for the current symbol. The bars are formed from live data and the desired bar size can be set in the inputs tab. Most importantly, because the Renko chart only uses price to construct bars and ignores time, the indicator can be applied to any time frame and same results can be achieved. Recommended usage As Renko charts are famous for eliminating noise so traders can use this tool to see clear picture of the trend to help their analysis, entr
FREE
Find and fill Gaps
Leandro Oliveira
This indicator shows the gaps on the current chart with a rectangle shape and indicates when the gap is filled by closing the shape. Gaps are considered over the shadows. Allows sending alerts by e-mail or push notifications when a gap is found. Parameters SizeGAP - Size of the gap that you want to indicate; HGcolor1 - Color of the gap in an upward movement; HGcolor2 - Color of the gap in a downward movement; HGstyle - The style of rectangle to be drawn; StartCalculationFromBar - How many candl
Volume Compair
Thiago Pereira Pinho
专业累计德尔塔与成交量中位线指标 通过这款强大的成交量分析工具,追踪 真实的买卖压力 。 成交量比较指标 (Volume Compare Indicator) 结合了 累计德尔塔 (Cumulative Delta) 和 成交量中位线 (Volume Medians) ,帮助您识别机构活动、失衡以及潜在的反转。 主要特点: 累计德尔塔直方图 – 实时可视化净买入成交量与净卖出成交量。 买入/卖出成交量中位线 – 显示平均买入和卖出成交量水平的水平线。 智能成交量分类 – 分隔: 强劲买入(绿色) – 看涨压力。 强劲卖出(红色) – 看跌压力。 买入成交量中位线(蓝色线) – 典型买入量的参考。 卖出成交量中位线(橙色线) – 典型卖出量的参考。 可自定义参数 – 调整 CDIPeriod 和 CDIRange 以设置敏感度。 EMA 平滑成交量 – 减少噪音,使信号更清晰。 如何帮助交易者: 发现机构活动 – 异常的成交量尖峰指示大玩家进场。 确认突破/反转 – 强烈的德尔塔背离警告假动作。 基于成交量的支撑/阻力 – 中位线充当动态
Trade Direction
Gevorg Hakobyan
5 (1)
The oscillator shows trend direction using its own algorithm, which is based on calculating price values ​​by analyzing prices of separate currencies (original valuation of currencies). The histogram shows the average value of physical price change over the selected period. When the histogram has a positive value, the trend is rising, if negative - the trend id falling. The indicator uses standard RSI to determine the current market direction on a selected period as follows: the default value of
Velas RENKO
Ramon Sobrevals Arce
Immediately plots renko bars in an external/indicator window.  One of the distinctive advantages Renko charts offer is the fact that they are not time dependent. Therefore, the new Renko blocks are only traced when the price moves higher or lower by the specified number of points.  For example, a 10 pip (100 points) Renko chart would plot the blocks when price moves 10 pips higher in an uptrend or 10 pips lower in a downtrend. Renko charts removes "noises" from the Market and i t helps to identi
Check Execution Broker
Nikolaos Pantzos
5 (1)
This expert is a tool to check broker execution and spread. Attach expert in any chart and wait to finish check. Expert sends a pending order (Buy Stop) away from the current price (100 pips) and then modifies it. When expert is removed from chart, pending orders expire and are deleted after 15 minutes. You can to get source code from here . Parameters OrdersID - Magic number for orders. ManualLotSize - Lot size for orders. TypeOfOrderUse - Type of order to place (pending or market). TimesModi
FREE
Identify Take
Oleksii Ferbei
4.5 (2)
Identify Take - trend trading strategy, market noise filtering and all necessary functions built into one tool! The system itself shows in the form of arrows when to buy and when to sell. Uses only one setting parameter. Simple, visual and effective trend detection. The intelligent algorithm of the Identify Take indicator shows the points of a potential market reversal. Most often, a good trend can be seen visually on the price chart. But an experienced trader must clearly understand the curre
Order Closer Manager Order Closer Manager Order Closer Manager is a powerful and easy-to-use MetaTrader 4 (MT4) Expert Advisor designed to help traders efficiently manage their open orders. This EA is ideal for traders who want precise control over their trades with minimal manual intervention. Key Features: Close Orders by Percentage: Automatically close a specified percentage of your total open lot size with a single click. Breakeven Management: Apply breakeven levels to buy, sell, or all open
Bigger chart labels would allow the user to be entirely aware of which chart he/she is on. Each chart window is unique, containing different patterns and economic motives so acknowledging the chart window would be absolutely essential! There are well known Economic Time Zones included in clear view, by choice!    Simple does it! Use your computing mouse scroller, clicking with the right finger on the label, in order to customize the label properties. From there, choose your preferred color, fon
FREE
MIDAS Trading Tools
Carl Gustav Johan Ekstrom
4.91 (11)
This indicator is the result of years of market observation and refinement, inspired by the pioneering work of the late technical analyst Paul Levine. Built on Levine’s MIDAS (Market Interpretation/Data Analysis System), it interprets market behavior through support/resistance dynamics and accumulation/distribution rather than conventional lagging indicators. MIDAS was developed to pinpoint trend strength, reversal points, and key price levels with greater accuracy. This modern version carries
MetaWaves
Stanislav Korotky
This indicator was inspired by М & W Wave Patterns by A. Merrill. 5 extremums or 4 edges of ZigZag are enough to build M or W pattern at arbitrary offset in the history. The classical approach includes a table of predefined figures of ZigZag waves, which can transform into each other under special rules—so that next edge can be forecasted based on these rules. Unlike to this approach, the indicator analyses available history and builds statistics for all M and W patterns, which differ in their c
Tick Chart Window
Ramon Sobrevals Arce
Do you need precision? Tick charts show each change in the ask or bid; The chart updates whenever either price changes. Study the markets more deeply, with surgical precision. Tick Chart Window saves all the received ticks and shows them into a seperate window. Get the best entry price in the Market.               trade with precision trade good  Spread Register In the comment section you will see the highest spread, the lowest spread and the average spread since the indicator was loaded.
FREE
Blahtech Market Profile
Blahtech Limited
4.53 (15)
Was: $249  Now: $99   Market Profile defines a number of day types that can help the trader to determine market behaviour. A key feature is the Value Area, representing the range of price action where 70% of trading took place. Understanding the Value Area can give traders valuable insight into market direction and establish the higher odds trade. It is an excellent addition to any system you may be using. Blahtech Limited presents their Market Profile indicator for the MetaTrader community. Ins
TMA AI Bands
Monique Ellen Miranda Dos Santos
Renko Chart Profile
Makarii Gubaydullin
过滤掉小的价格波动,专注于更大的趋势 . Renko 图表指标将帮助您过滤掉小的价格波动,以便您可以专注于整体趋势。 价格必须移动指定距离才能创建一个 Renko 砖块。 这使得识别当前价格移动的方向变得更加容易。 多功能工具 : 包含 66+ 项功能  |   如有任何问题请联系我   |    MT5 版本 在指标设置中,您可以配置: 计算设置: 块大小,以点为单位; 指标样式: 块颜色; 程序文件应放置在 " Indicators " 目录中。 //--------------------- 多功能工具 : 包含 66+ 项功能  |   如有任何问题请联系我   |    MT5 版本 //----------------------------------------------------
SnR tool
Syahirul Nizzam Bin Haron
5 (1)
This is a SnR tool. It is built based on the body candle. It is a multi timeframe indicator. There is a powerful scalabar for vertical line slides to limit the candle bars. Color for each line can also be changed. It can detect: 1. Support && Resistance 2. Support become Resistance && vice versa 3.Support become Resistance become Support && vice versa It also can be used for trading tools and studies on SnR *New Version avaiable
Renko Moving Average
Vitor Palmeira Abbehusen
This indicator gives you the Moving Average based on Renko chart. A   Renko chart   is a type of chart that is built using price movement rather than both price and standardized time intervals like most charts are. A Moving Average based on Renko chart is considered less noisy since it is not based on the time and only based on price change. You can see my free enhanced Renko indicator here . Inputs: Box Size: Renko box size based on market Points. Period: Moving Average Period Method: Moving
该产品的买家也购买
Meravith
Ivan Stefanov
5 (1)
该指标从每个点分析成交量,并计算该成交量的市场疲劳水平。 它由三条线组成: 牛市成交量疲劳线 熊市成交量疲劳线 表示市场趋势的线。该线根据市场是熊市还是牛市变化颜色。 您可以从任何选择的起点分析市场。一旦达到成交量疲劳线,确定一个新的起点来开始下一次分析。 您可以分析任何内容——趋势和修正。一个好的方法是每次当它达到趋势线或形成顶部或底部时移动指标。 趋势线与某一成交量疲劳线之间的距离越大,说明该方向的成交量越大。 趋势线可以作为开单的位置,而疲劳线则用于收集利润。 该系统非常独特,但又极其直观。 市场上没有类似的产品。 使用没有限制。可以在所有市场和所有时间框架中应用。 重要提示:在MetaTrader4测试器中检查时,双击紫色线条,然后左右移动它以分析市场。 如有任何问题,请随时联系我。
Scalper Inside PRO
Alexey Minkov
4.74 (69)
An exclusive indicator that utilizes an innovative algorithm to swiftly and accurately determine the market trend. The indicator automatically calculates opening, closing, and profit levels, providing detailed trading statistics. With these features, you can choose the most appropriate trading instrument for the current market conditions. Additionally, you can easily integrate your own arrow indicators into Scalper Inside Pro to quickly evaluate their statistics and profitability. Scalper Inside
目前八折优惠! 对任何新手或专家交易者来说都是最好的解决方案! 这个仪表板软件适用于28种货币对。它基于我们的两个主要指标(高级货币强度28和高级货币冲动)。它对整个外汇市场提供了一个伟大的概述。它显示高级货币强度值,货币运动速度和28个外汇对在所有(9)时间段的信号。想象一下,当你可以使用图表上的单一指标观察整个市场,以确定趋势和或剥头皮的机会时,你的交易将得到改善 我们已经在这个指标中建立了一些功能,使你更容易识别强势和弱势货币,同时识别和确认潜在的交易。该指标以图形方式显示货币的强势或弱势是增加还是减少,以及它在所有时间段的表现。 增加的新功能是动态市场斐波那契水平,它适应当前的市场条件变化,这是一个已经在我们的高级货币强度28和高级货币冲动指标中使用的成熟的加分项。 在交易时,总是将弱势货币和强势货币配对,这个新指标将帮助你做到这一点。 用户手册:点击这里  https://www.mql5.com/en/blogs/post/708783 特点  显示每个时间段的ACS28和GAP-speed(冲动)的货币强度值。 列:颜色代码以7种颜色显示货币强度:强势
本指标是实践实战交易完善的波浪自动分析的指标 !  案例... 注: 波浪分级用西方叫法不习惯,因受到缠论(缠中说禅)命名方式习惯的影响,我是将基础波浪命名为 笔 ,将二级波段命名为 段 ,同时具有趋势方向的段命名为 主趋段 (以后笔记中都是这种命名方式,先告知大家),但是算法上和缠论关系不大切勿混淆.反映的是本人分析盘面总结的 千变万化纷繁复杂的运行规律 . 对波段进行了标准化定义,不再是不同人不同的浪  ,   对人为干扰的画法进行了排除,在严格分析进场起到了关键的作用 . 使用这个指标,等于将交易界面提升美感,抛弃最原始的K线交易带你进入新的交易层次.如果不是为了交易,在宣传上也将使客户观感提升层次. 指标内容: 1. 基础波浪 (笔) : 首先我们找出了价格波动过程中的基础波动拐点,当然他的有序性低,为下一步的计算提供基础. 2. 二级波段( 段 ) :在基础波浪的基础上,通过算法分析得到层级更明显的二级波段,二级波段为波浪提供了分析基础 3. 波浪( 浪 ): 有着更清晰的趋势,更清晰直观的方向.分析一个波浪是否延续,需要看二级波段的形态,分析二级的构成,可以得出波浪后
Looking for a powerful yet lightweight swing detector that accurately identifies market structure turning points? Want clear, reliable buy and sell signals that work across any timeframe and any instrument? Buy Sell Arrow MT Swing is built exactly for that — precision swing detection made simple and effective. This indicator identifies Higher Highs (HH) , Higher Lows (HL) , Lower Highs (LH) , and Lower Lows (LL) with remarkable clarity. It is designed to help traders easily visualize market str
Dynamic Forex28 Navigator
Bernhard Schweigert
4.43 (7)
Dynamic Forex28 Navigator - 下一代外汇交易工具。 当前 49% 折扣。 Dynamic Forex28 Navigator 是我们长期流行的指标的演变,将三种功能合二为一: 高级货币强度 28 指标 (695 条评论)+ 高级货币 IMPULSE 带警报 (520 条评论)+ CS28 组合信号(奖励)。 有关指标的详细信息 https://www.mql5.com/en/blogs/post/758844 下一代强度指标提供什么? 您喜欢的原始指标的一切,现在通过新功能和更高的精度进行了增强。 主要特点: 专有货币强度公式。  所有时间范围内的平滑和准确的强度线。 非常适合识别趋势和精确进入。 动态市场斐波那契水平(市场斐波那契)。  此指标独有的独特功能。 斐波那契应用于货币强度,而不是价格图表。 适应实时市场活动以获得准确的反转区域。 实时市场动量。  第 9 行显示市场是活跃还是被动。 对于定时交易至关重要。 全面的警报和显示。  每种货币最强的买入和卖出动量。 ​​28 对的双重动量买入和卖出。 超买/超卖警告外部范围和止损。 反转
ACB Breakout Arrows
KEENBASE SOFTWARE SOLUTIONS
4.15 (34)
ACB Breakout Arrows 指标通过识别一种特殊的突破形态,为交易者提供关键的入场信号。该指标持续扫描图表中某一方向上趋于稳定的动能,并在主要行情启动之前给出准确的进场信号。  点击此处获取多品种、多周期扫描仪 - ACB Breakout Arrows MT4 专用扫描仪 主要功能 指标自动提供止损和止盈位置。 配备 MTF 多周期扫描仪面板,可跟踪所有时间周期的突破信号。 适用于日内交易者、波段交易者和剥头皮交易者。 采用优化算法,提高信号准确性。 提供特殊目标线,用于设置快速平仓点或无损平移位(Quick Profit Line)。 包括胜率、成功率、平均收益等表现分析指标。 不重绘,信号一旦出现即保持不变。 交易确认 -  建议结合使用 ACB Trade Filter 指标 以过滤低质量信号。 强买入: 上箭头 + 绿色柱状图 + 多头趋势。 强卖出: 下箭头 + 红色柱状图 + 空头趋势。 避免交易 :当柱状图为灰色且趋势为震荡时。 (可选) -  建议使用 KT  支撑与阻力位指标  来避免在关键支撑/阻力区域附近开仓。此类交易可能迅速转为亏损,造成不必
Entry Points Pro
Yury Orlov
4.62 (172)
这是一款 MT4 的趋势指标,可提供准确的入场交易信号,且无重绘或延迟。 它可应用在任何金融资产:外汇、加密货币、贵金属、股票、指数。 最好的结果出现在 M15+ 的时间帧内。 指标的 MT5 版本 重要! 购买后请联系我,以便获取详细指南和奖励。 视频 (6:22) - 一个信号赢取的利润等于指标价格的三倍。 视频 (4:44) - 它如何在测试器中工作,我的提示和技巧。 视频 (1:44) - 有关它如何处理加密货币和指数的几句话。 大多数交易者在 Entry Points Pro 指标的帮助下,在第一个交易周内就改善了他们的交易结果。 Entry Points Pro 指标的益处 入场信号无重绘或延迟 如果信号出现,并得到确认(如果信号所在烛条已收盘),则它不会再消失;不像是重绘指标,它会导致重大的财产损失,因为它们可以在显示信号后再将其删除。 无差错开仓 指标算法可令您找到入场交易(买入或卖出资产)的理想时机,从而提高每位交易者的成功率。 Entry Points Pro 可操作任何资产 它允许您在 MT4 平台上交易任何经纪商提供的加密货币、股票、金属、指数、商品
Adaptive Volatility Range
Stanislav Konin
5 (3)
Adaptive Volatility Range [AVR] is a powerful tool for identifying key trend reversal points. AVR accurately reflects the Average True Range (ATR) of volatility, taking into account the Volume-Weighted Average Price (VWAP). The indicator adapts to any market volatility by calculating the average volatility over a specific period, ensuring a stable rate of profitable trades. You receive not just an indicator but a professional automated trading system , AVR-EA . Advantages: Automated Trading Sys
RelicusRoad Pro
Relicus LLC
4.63 (106)
您有多少次购买了一个交易指标,它拥有 出色的回测 、 实盘账户表现证明 以及惊人的数据和 无处不在的统计数据 ,但使用后您却 最终爆仓 ? 您不应该只相信一个信号本身,您需要知道它最初为何出现,而这正是 RelicusRoad Pro 最擅长的! 用户手册 + 策略 + 培训视频 + 带 VIP 权限的私人群组 + 提供移动版本 一种全新的市场视角 RelicusRoad 是外汇、期货、加密货币、股票和指数领域 全球最强大、最好的交易指标 ,为交易者提供 账户增长 所需的所有信息和工具。我们提供 技术分析 和 交易计划 ,帮助 每一位交易者成功 ,无论是 初学者 还是 高级交易者 。 它是一个 关键交易指标 ,提供足够的信息来 预测 未来市场。我们相信一个 完整的解决方案 ,而不是图表上几个毫无意义的不同指标。这是一个 一体化指标 ,显示 信号 、 箭头 + 价格行为 信息,这些信息 无与伦比 且 非常准确 。   RelicusRoad 利用机器学习(AI)技术,为交易者提供必要的信息和工具,帮助他们成为成功且消息灵通的交易者。   利用领先指标预测未来价格 几乎 所有技术指标
OrderFlow Absorption – 專業級MT4買賣差與吸收訊號指標 釋放真正訂單流分析的力量,OrderFlow Absorption 是MetaTrader 4上最強大的買賣差(Delta)直方圖與吸收訊號指標。專為想看清每一個價格波動背後真相的交易者設計,這個工具揭示了隱藏的買賣壓力與推動市場的吸收事件。 功能特色 買賣差直方圖視覺化:   以清晰的色彩直方圖即時顯示買方與賣方壓力。 吸收訊號偵測:   先進邏輯自動辨識多空吸收事件,及早預警潛在反轉。 圖表標記:   吸收訊號直接標示於主圖表,方便視覺辨識。 彈出式警報:   新吸收訊號出現時即時通知。 自訂門檻:   過濾弱訊號,專注高勝率機會。 資源管理:   高效運算,適用於大型圖表也能流暢運行。 全品種兼容:   適用於任何商品與週期,包括外匯、指數、商品等。 簡易整合:   參數簡單,快速上手與調整。 OrderFlow Absorption 的邏輯說明 OrderFlow Absorption 採用專利演算法,能在沒有完整Tick數據的情況下,估算每根K棒的買賣壓力(Delta)。它分析成交量、價格行為、K
Dynamic Scalper System
Vitalyi Belyh
5 (1)
“ Dynamic Scalper System ”指标专为在趋势波内进行剥头皮交易而设计。 已在主要货币对和黄金上进行测试,并可与其他交易工具兼容。 提供顺势短线建仓信号,并提供额外的价格变动支持。 指标原理: 大箭头决定趋势方向。 在趋势波内,我们采用一种生成小箭头形式的剥头皮交易信号的算法。 红色箭头代表看涨方向,蓝色箭头代表看跌方向。 敏感的价格变动线会沿着趋势方向绘制,并与小箭头信号协同作用。 信号运作方式如下:当线在适当时刻出现时,将形成入场信号;在出现线时,持仓;线完成后,平仓。 建议的操作时间范围为M1 - H4。 箭头在当前K线上方形成,如果下一根K线已开仓,则不会重新绘制上一根K线上方的箭头。 输入参数 Trend Wave Period - 趋势方向(大箭头)的周期,改变趋势波的时间间隔。值 1 表示趋势方向的最长持续时间,参数值越大,持续时间越短。 Scalper Arrows Period - 信号箭头(小箭头)的计算周期,改变入场信号的生成频率。值 3 表示最频繁的生成频率,参数值越大,箭头频率越低,准确度越高。 这些参数可以根据不同的时间范
The BB Reversal Arrows technical trading system has been developed to predict reverse points for making retail decisions. The current market situation is analyzed by the indicator and structured for several criteria: the expectation of reversal moments, potential turning points, purchase and sale signals. The indicator does not contain excess information, has a visual understandable interface, allowing traders to make reasonable decisions. All arrows appear to close the candle, without redrawin
Full Scalping Signal
Leandro Bernardez Camero
FullScalping 是一款 不重绘、不回绘 的指标,专为在任何市场中生成 持续不断的剥头皮入场信号 而设计。非常适合追求激烈行情的激进交易者! 加入频道,获取独家信息和更新: https://www.mql5.com/en/channels/forexnewadvisor 你会注意到它 几乎在每根K线 上都会给出信号,要么是确认趋势,要么是提示关键回调。就像一个全天候运行的雷达为你指引方向。 它是如何工作的?非常简单: 红色箭头 进场 做空 蓝色箭头 进场 做多 始终顺应整体趋势方向进行交易,积极获取 每单15到20点 的利润,并在市场剧烈反转之前迅速退出。 信号 持续不断 ,让你永远不会错过交易机会。目标是通过以下方式实现 高频剥头皮交易 : 大手数交易 低点差(显示在左下角) 宽止损,设在上一次趋势反转附近 你可以观看 实时交易视频 了解操作过程,但它使用起来非常简单,安装完成后即可上手。 它会重绘或回绘吗? 对于箭头类指标,大家最关心的问题之一就是它是否 重绘 或 回绘 。而对于 FullScalping 来说,答案非常明确: 此指标 不会重绘 这意味着
NAM Order Blocks
NAM TECH GROUP, CORP.
3.67 (3)
MT4多時限訂單塊檢測指示器。 特徵 -在圖表控制面板上完全可自定義,提供完整的交互。 -隨時隨地隱藏和顯示控制面板。 -在多個時間範圍內檢測OB。 -選擇要顯示的OB數量。 -不同的OB用戶界面。 -OB上的不同過濾器。 -OB接近警報。 -ADR高低線。 -通知服務(屏幕警報|推送通知)。 概括 訂單塊是一種市場行為,它指示從金融機構和銀行收取訂單。著名的金融機構和中央銀行帶動了外匯市場。因此,交易者必須知道他們在市場上正在做什麼。當市場建立訂單塊時,它會像發生大多數投資決策的範圍一樣移動。 訂單建立完成後,市場將朝著上升和縮小的方向發展。訂單大宗交易策略的關鍵術語是它包括機構交易者正在做的事情。由於它們是主要的價格驅動因素,因此包括機構交易在內的任何策略都可以。 您將在任何時間範圍內實時看到訂單塊,使用我們的控制面板,您將能夠在所選的歷史記錄週期內檢測常規,拒收和未大寫的訂單塊。 現在您可以接收到訂單塊接近警報,我們在MT4上顯示屏幕通知,並將通知推送到您的手機!
The Nihilist 5.0 Indicator includes Forexalien and Nihilist Easy Trend trading strategies and systems. It is composed of an MTF Dashboard where you can analyze the different input possibilities of each strategy at a glance. It has an alert system with different types of configurable filters. You can also configure which TF you want to be notified on your Metatrader 4 platform and Mobile application The indicator has the option to view how could be a TP and SL by using ATR or fixed points, even w
Introducing the Delta Volume Profile Indicator - Unleash the Power of Institutional Precision!  Technical Indicator: Are you ready to trade like the pros? The Delta Volume Profile Indicator is no ordinary tool. It’s a high-precision, cutting-edge indicator that puts the power of institutional-grade trading in your hands. This unique indicator analyses delta volume distribution in real-time, revealing the market's hidden buy/sell imbalances that the biggest financial institutions rely on to antic
介绍 ON Trade Waves Patterns Harmonic Elliot Wolfe,这是一款高级指标,旨在使用手动和自动方法检测各种市场模式。以下是它的工作原理: 谐波模式: 该指标可以识别出现在您图表上的谐波模式。这些模式对于练习谐波交易理论的交易者非常重要,正如Scott Carney的书《谐波交易第1卷和第2卷》所描述的那样。无论您是手动绘制它们还是依赖自动检测,ON Trade Waves Patterns都可以胜任。 控制面板: 我们配备了一个用户友好的控制面板,它会保存您的图表和时间帧设置,使您可以轻松切换不同配置。您甚至可以最小化它以最大化图表空间。如果您更喜欢使用其他分析工具,只需单击关闭按钮即可隐藏所有指标数据。 模板保存: 当您自定义设置或添加其他指标,如移动平均线或布林带时,该指标会自动保存您的模板。这意味着您可以随时轻松加载您喜欢的设置。 优化显示: 对于Windows 10用户,我们建议调整您的DPI设置以获得高清设备上的最佳屏幕体验。右键单击MetaTrader图标,选择“兼容性”,然后选择“更改高DPI设置”,将其设置为“系统(增强)”。
KT Trend Trading Suite MT4
KEENBASE SOFTWARE SOLUTIONS
KT Trend Trading Suite 是一款多功能指标,它结合了趋势跟随策略和多个突破点作为入场信号。 当新趋势形成后,该指标会提供多个入场机会,让交易者能够顺势而为。为了避免不重要的入场点,还引入了回调阈值的概念。 MT5版本可在此处获取  https://www.mql5.com/en/market/product/46270 功能特点 将多种市场动态纳入一个公式中,以清晰展现市场趋势。 绘制矩形框标记入场信号,并配合局部高点和低点进行定位。 指标会自动评估自身信号的准确性,并提供多个简明的性能指标。 内置多周期仪表盘,扫描所有可用时间周期,并显示每个周期内的趋势方向。 输入参数 History Bars:   用于分析历史信号的K线数量。  Signals Period:   整数值,决定入场信号的强度。 Pullback Depth:   整数值,决定趋势继续前常见的回调深度。 Trend Period:   整数值,用于判断主要趋势方向。 Show MTF Dashboard:   显示/隐藏多周期扫描仪表盘。 Performance Analysis:
The Super Arrow Indicator provides non-repainting buy and sell signals with exceptional accuracy. Key Features No repainting – confirmed signals remain fixed Clear visual arrows: green for buy, red for sell Real-time alerts via pop-up, sound, and optional email Clean chart view with no unnecessary clutter Works on all markets: Forex, gold, oil, indices, crypto Adjustable Parameters TimeFrame Default: "current time frame" Function: Sets the time frame for indicator calculation Options: Can be set
Beast Super Signal
Dustin Vlok
4.73 (89)
正在寻找可以帮助您轻松识别有利可图的交易机会的强大外汇交易指标? Beast Super Signal 就是您的不二之选。 这个易于使用的基于趋势的指标持续监控市场状况,寻找新的发展趋势或跳入现有趋势。当所有内部策略一致且彼此 100% 融合时,Beast Super Signal 会发出买入或卖出信号,无需额外确认。当您收到信号箭头警报时,只需买入或卖出。 购买后给我留言,让我加入我的私人 VIP 群组! (仅限购买完整产品)。 购买后给我发消息以获取最新的优化设置文件。 此处提供 MT5 版本。 在此处 获取 Beast Super Signal EA。 查看评论部分以查看最新结果! Beast Super Signal 根据您偏好的 1:1、1:2 或 1:3 风险回报率建议入场价、止损和获利水平,让您放心交易。这个 Beast Super Signal 是 100% 不可重新绘制的,这意味着它永远不会重新计算或重新绘制,每次都能为您提供可靠的信号。 Beast Super Signal 指标适用于所有时间范围,包括货币对、指数、商品和加密货币对。 Beast Su
GOLD Impulse with Alert
Bernhard Schweigert
4.64 (11)
这个指标是我们2个产品 Advanced Currency IMPULSE with ALERT  +   Currency Strength Exotics 的一个超级组合。 它适用于所有时间框架,并以图形方式显示8种主要货币和一种符号的强势或弱势冲动! 该指标专门用于显示任何符号的货币强度加速,如黄金、异国货币对、商品、指数或期货。这是它的第一个指标,任何符号都可以被添加到第9行,以显示黄金、白银、石油、DAX、US30、MXN、TRY、CNH等的真实货币强度加速(冲动或速度)。 建立在新的基础算法上,它使识别和确认潜在的交易更加容易。这是因为它以图形方式显示了一种货币的强势或弱势是否正在加速,并测量了这种加速的速度--把它想象成你汽车中的速度表。当你加速时,事情显然会发生得更快,这在外汇市场上也是一样的,即如果你配对的货币正在向相反的方向加速,你就会发现一个潜在的有利可图的交易。 动态市场斐波那契28水平被用作警报触发器,将适应市场活动。如果冲动击中黄色触发线,你将收到警报。然后你就知道作为一个交易员应该做什么。货币对和方向已经给出。只需点击警报按钮,就可以切换到该货
Volatility Trend System - a trading system that gives signals for entries. The volatility system gives linear and point signals in the direction of the trend, as well as signals to exit it, without redrawing and delays. The trend indicator monitors the direction of the medium-term trend, shows the direction and its change. The signal indicator is based on changes in volatility and shows market entries. The indicator is equipped with several types of alerts. Can be applied to various trading ins
Elliott Wave Trend MT4
Young Ho Seo
4 (7)
Elliott Wave Trend was designed for the scientific wave counting. This tool focuses to get rid of the vagueness of the classic Elliott Wave Counting using the guideline from the template and pattern approach. In doing so, firstly Elliott Wave Trend offers the template for your wave counting. Secondly, it offers Wave Structural Score to assist to identify accurate wave formation. It offers both impulse wave Structural Score and corrective wave Structure Score. Structural Score is the rating to sh
MR Reversal Patterns 4
Sergey Khramchenkov
5 (2)
In the "Masters of Risk" trading system, one of the main concepts is related to places where markets change direction. In fact, this is a change in priority and a violation of the trend structure at the extremes of the market, where supposedly there are or would be stop-losses of "smart" participants who are outside the boundaries of the accumulation of volume. For this reason, we call them "Reversal Patterns" - places with a lot of weight for the start of a new and strong trend. Some of the imp
Smart Price Action Concepts
Issam Kassas
4.75 (12)
首先,值得强调的是,这个交易工具是非重绘、非重画和非滞后的指标,非常适合专业交易。 在线课程,用户手册和演示。 智能价格行动概念指标是一个非常强大的工具,既适用于新手,也适用于经验丰富的交易者。它将超过20个有用的指标合并到一个指标中,结合了高级交易思想,如内圈交易员分析和智能资金概念交易策略。该指标侧重于智能资金概念,提供有关大型机构交易方式的见解,帮助预测它们的动向。 它在流动性分析方面尤其擅长,有助于理解机构的交易方式。它擅长预测市场趋势,并仔细分析价格波动。通过将您的交易与机构策略对齐,您可以更准确地预测市场走向。该指标多才多艺,擅长分析市场结构,识别重要的订单区块,并识别各种模式。 它擅长识别BOS和CHoCH等模式,理解动量的转变,并突出显示供需强劲的关键区域。它还擅长发现强大的不平衡,并分析价格创造更高高点或更低低点的模式。如果您使用斐波那契回撤工具,该指标可以满足您的需求。它还可以识别相等的高点和低点,分析不同的时间框架,并通过仪表板显示数据。 对于使用更高级策略的交易者,该指标提供了工具,如公平价值差指标和优惠和折扣区域的识别。它特别关注高时间框架订单区块,并
Supply and Demand Dashboard PRO
Bernhard Schweigert
4.8 (20)
目前八折优惠! 这个仪表板是一个非常强大的软件,可用于多个符号和多达9个时间段。 它是基于我们的主要指标(最佳评论:高级供应需求)。 Advanced Supply Demand 该仪表板提供了一个伟大的概述。它显示。   筛选后的供需值,包括区域强度评级。 区间内和区间外的点位距离。 它突出了嵌套的区域。 在所有(9个)时间段内,它对所选符号发出4种警报。 它是高度可配置的,以满足您的个人需求! 您的利益! 对每个交易者来说,最重要的问题是。 什么是入市的最佳水平? 在强大的供应/需求区域内或附近进入你的交易,以获得最佳的成功机会和风险/回报。 我的止损的最佳位置是哪里? 把你的止损放在强势供应/需求区的下方/上方是最安全的。 我的最佳盈利目标是什么? 你的退出策略和你的进入策略一样重要,了解更高的时间框架图可以帮助你。对于买入,使用下一个供应区作为目标,对于卖出,使用下一个需求区作为目标。在回撤到供应区或需求区时进场,以确保有足够的利润空间,达到更高的时间框架的供应和需求,将增加你的利润。 为什么我们要过滤强区和弱区? 不平衡性越大,价格的变动就
PZ Harmonacci Patterns
PZ TRADING SLU
3.17 (6)
可以说,这是您可以为MetaTrader平台找到的最完整的谐波价格形成自动识别指标。它检测19种不同的模式,像您一样认真对待斐波那契投影,显示潜在的反转区域(PRZ),并找到合适的止损和获利水平。 [ 安装指南 | 更新指南 | 故障排除 | 常见问题 | 所有产品 ] 它检测19种不同的谐波价格形态 它绘制了主要,衍生和互补的斐波那契投影(PRZ) 它评估过去的价格走势并显示每个过去的形态 该指标分析其自身的质量和性能 它显示合适的止损和获利水平 它使用突破来表明合适的交易 它在图表上绘制所有样式比率 它实现了电子邮件/声音/视觉警报 受斯科特·M·卡尼(Scott M. Carney)的书的启发,该指标旨在满足最纯粹和最熟练的交易者的需求。但是,它采取了一种使交易更容易的方式:在向交易发出信号之前,它会等待Donchian朝正确方向突破,从而使交易信号非常可靠。 斐波那契投影与向量无关 它实现了电子邮件/声音/推送警报 它绘制了ABCD投影 重要提示: 为了符合 Scott M. Carney先生 的商标申诉,某些图案名称已重命名为不言自明的替代方式, Scott M.
IQ Gold Gann Levels
INTRAQUOTES
5 (4)
Presenting one-of-a-kind Gann Indicator for XAUUSD IQ Gold Gann Levels is a non-repainting, precision tool designed exclusively for XAUUSD/Gold intraday trading. It uses W.D. Gann’s square root method to plot real-time support and resistance levels, helping traders spot high-probability entries with confidence and clarity. William Delbert Gann (W.D. Gann) was an exceptional market analyst whose trading technique was based on a complex blend of mathematics, geometry, astrology, and ancient calcul
Quantum Trend Sniper Indicator MT4
Bogdan Ion Puscasu
4.69 (42)
介绍   量子趋势狙击指标 ,突破性的 MQL5 指标,正在改变您识别和交易趋势反转的方式!由拥有超过13年交易经验的资深交易员团队开发,     量子趋势狙击指标   旨在通过其创新的方式以极高的准确度识别趋势反转,将您的交易之旅推向新的高度。 ***购买量子趋势狙击指标,即可免费获得量子突破指标!*** 当量子突破指标识别出趋势反转时,它会向您发出警报和信号箭头,并建议您三个止盈水平。 它既适合新手交易者,也适合专业交易者。 量子 EA 通道:       点击这里 MT5版本:       点击这里 建议: 时间范围:  所有时间范围。为了获得最佳结果,我们建议在 M15、M30 和 H1 时间范围内使用它。 货币对:欧元兑美元、英镑兑美元、澳元兑美元、欧元兑英镑, EURAUD, XAUUSD 账户类型:ECN、Raw 或 Razor,点差极低 经纪时间:任意 经纪商:IC Markets、Pepperstone with Raw 和 Razor 的点差最低 建议止损:50 点 建议止盈水平:20 点、50 点和 100 点 规格: 不重漆! 最多
作者的更多信息
King of Forex trend indicator is a trend following indicator based on moving averages. This indicator doesn't repaint. The major function of this indicator is to show the major direction of the trend, the beginning and the end of the current trend. A bullish trend is when the indicator turns blue A bearish trend is when the indicator turns pink. This indicator is great for swing trading and day trading It works best on H1, H4, D and Weekly time-frames. It works on all pairs but it works best on
The King of Forex Trend Cloud Indicator is a trend following indicator based on moving averages. The Indicator is meant to Capture both the beginning and the end of a trend. This indicator can be used to predict both short and long terms market trends.  The king of Forex Trend Cloud if paired together with the King of Forex Trend Indicator can give a broad picture in market analysis and forecasts. I have attached images for both the  The king of Forex Trend Cloud on its own and  The king of Fore
Dear traders, here is my other tool called the "Market Makers Trend Index".   The Market Makers Trend Index is created for the purpose of helping majority of traders to analyse the market direction in an easy way. This indicator is for serious traders who are eager to add edging tools to their trading arsenal. What are you waiting for just grab your copy today and amake a difference.  WHY THIS TOOL This indicator help traders analyse the trend direction and trading signals with precision and eff
The Trend Monster is a trend following non repainting indicator based on moving averages. As traders we want to be careful not to trade against the trend. Therefore when you look at the chart as a trader you will have to ask yourself these kind of questions Is this market trending? Is this market ranging/trading sideways? Is this market bullish or bearish? What should I look for before I take a trade? Those are some critical questions that every trader should ask him/herself before taking any tr
NOTE-After the first 10 people to rent this product for 1 month then I will remove the 1 month renting option and leave the unlimited price only. Therefore don't rent it too late. Thanks for those who have rented yet. Don't miss out this offer! Few  people remaining. Special offer from 2500usd to 200usd 24 hours offer! Introduction Super bands Trend Indicator is an indicator designed to reveal the direction of the market Trend. The Indicator is based on moving averages, ichimoku, alligators, a
The Forex Scalpers Index (FSI) is a trend following Indicator based on moving averages.  The purpose of this indicator is to be used for scalping all kinds of markets without limitations. The indicator can be used for any kind of currency pair. For those Scalpers who are looking for the indicator that can make their trading activities easy we recommend using this indicator because it provides many entry and exit opportunities. This indicator can be used on all timeframes. How it works. Colored
Disclaimer: There is no guaranteed profitability! Invest wisely. The Perfect Trend Scanner is a trend following indicator which is designed to show you the direction of the current trend. The aim is to assist you not to trade against the trend. How it works. The indicator doesn't repaint. The indicator works on all time-frames. The pink histograms indicate a bearish trend while the blue histograms indicates a bullish trend /signals. You can us this indicator in the top down market analysis appro
The Mane Flow Index is designed to help youu know where the market orders are flowing to. The indicator is based on moving averages. In other words it will show you where the investors capital is flowing to. In our trading activities we want to know where the capital is going so that we capitalize on the direction of the capital invested in the market. We want to trade with the trend! Not to go against it! How it works It is non repaint. It is suitable for all kind of markets It is suitable for
Market Swing Index MSI
Elias Mtwenge
5 (1)
Septermber OFFER 85% OFF next price for unlimited version will be 2500$. This is the only time you can get this institutional and professional indicator at this price for unlimited version. Don't dare to miss this. The tool I am about to introduce to you you can't compare it with other tools due to its strategy and accuracy level in predicting the next price directional movement. This tool is designed for serious traders who have decided to make a difference through trading. Be the next person t
The Trend Professor is a moving average based indicator designed for the purpose of helping the community of traders to analyse the price trend. The indicator will be displayed in the main chart as it is indicated on the screenshot section. How it works The indicator has lines of moving averages and colored histograms to depict the direction of the trend. There will be a fast signal line colored blue/yellow/red at some points. The red/yellow colored lines stands for bearish trend/signal while th
Maximum Directional Index (MDI) is designed for two purposes. 1. To show the direction of the trend (The blue yellow trend line) 2. To show the Overbought (Resistance) and Oversold (Support) zones for a trader to know whether the trend is about to reverse or not. It shows the maximum direction of the price trend. How it works 1. The indicator works on all time-frames but for clarity I recommend you use it on 5minutes, 15miutes, 30minutes, 1 hour and 4 hours time-frame charts. 2. The indicator c
Information about this tool Generally: The Smart Trend Indicator STI is designed for the purpose of showing you the direction of the trend.   How it works It is based on moving averages. The indicator works on all types of markets. The indicator works on all timeframes. The indicator works on all currency pairs. This indicator doesn't repaint. The light green histograms are for bullish trend. The green histograms are for fast buy signals. The light red histograms are for bearish trend. The dee
The Omega Trend Oscillator is a trend indicator based on Moving averages and Bollinger bands. I made it simple for you to have easy and soft market analysis approach. The indicator can be used for the following purpose. 1. For trend analysis 2. For determining the overbought and oversold market condition 3. For discovering market selling and buying opportunities.  Meaning of colors on the indicator FOR BULLISH MARKET (Buy) 1. Lime color is for bullish market/trend 2. Blue color is for very st
OFFER! OFFER! From 450usd to 370usd this offer may end at any time from now! Don't miss this. Hi traders, I have created this EA and called it "The Account Flipper EA". This trading EA is for both newbies and professional traders. The first goal with this EA is to protect your capital first and the second is to grow your account. Therefore no risky strategies like grid, marti-angle, hedging, or any greedy trading strategies. We use a fixed lot size in every trade, SL, TP and break even all these
Hi traders, I'm glad to bring to you the market analysis tool called "Infinity Trend Indicator". The main goal of this indicator is to help you figure-out  the beginning of a new trend and the end of the trend current trend.  NOTE:  THIS INDICATOR DOESN'T REPAINT!! How to use this Indicator 1. Based on the Infinity trend indicator only We look to buy when the yellow line is pointing or curving up after a strong bearish move We look to sell when the yellow line is pointing or curving downward aft
Note: The price is subject to increase at any time from now!  Hi Traders, I would like to introduce to you my new indicator called the Infinity Oscillator Indicator. This indicator is designed for both newbies and professional traders. Parameters The inputs that can be changed by the user are colors of the lines only so as to not disturb the original trading strategy this indicator uses. The indicator will not provide buy and sell arrow signals but will help traders in market analysis approach
IMPORTANT; Price is subject to rise at any time from now! Do not miss this offer! Dear trader I am glad to introduce my new tool called Trend Analyser Dashboard to you. The design, style, and settings of this indicator  have been made simple to make its users not take too much time in understanding the indicator itself.   The purpose is to help traders in analysing the direction of the major trend and the status of the trend whether in weak trend or its strong trend. The indicator will also prov
Reminder: After purchasing the unlimited version of this indicator send me the proof and I will add you to my private group so that you join the community and continue to learn more about this tool and grow together with other traders. You will also learn the strategy that will change your trading story! Dear Traders I am so glad to introduce my forex trading product called "Day Traders Master Board". This tool is designed for serious traders of any trading strategy.  My goal is to help trader b
NOTE: NEXT PRICE WILL BE 550$ Dear Trader I hope you have been eagerly waiting and looking for a tool to improve your trading. I am so glad to introduce my other product to you called Trend Shooter Index. The main goal of this tool is to help traders shoot the trend (target the trend) from the bottom or from the top of the trend for maximum profitability. How is the Indicator designed This tool is designed to show the following Red arrows pointing down for sell signals. Blue arrows pointing up f
OFFER! OFFER! NEXT Price Will be 650$ and the rental option will be removed after this. Don't miss the current price offer before it is too late. Dear Traders I am so glad to introduce my Super Powers Indicator.  The purpose of this trading tool is to help serious traders who want to make trading one of their main source of income.  I know trading is not an easy task but if you have the right tools, knowledge and motivation to trade then you are ready to go in this industry. My role is to help y
NOTE: PRICE WILL RISE VERY SOON. DON'T SKIP THIS OFFER! Dear traders I am glad to introduce the " Market Swing Scanner Board" indicator to you. This indicator was made mainly to be used in combination with the Market Swing Index Indicator. You use the  "Market Swing Scanner Board"  indicator to scan for trading opportunities on the  Market Swing Index Indicator . This tool is designed for serious traders who have decided to make a difference through trading. Be the next person to witness this st
WARNING!! THIS SWORD IS TOO SHARP!    ONLY 10 COPIES LEFT FOR THE NEXT PRICE TO BE 8,000$ FOR UNLIMITED PLAN. Dear traders I am very glad once again to introduce to you my other tool called "Forex Sword Indicator". In short this tool is meant to give you an edge over the market that you have been waiting for  so long. Now, here it is. It is a very very simple tool but yet a dangerous sword. I call it a  Holy grail indicator!. I will not talk a lot about this tool. Just let the tool speak by itse
Swing Master Indicator
Elias Mtwenge
5 (1)
Dear Traders this is my another tool called " Swing Master Indicator ". As the name above the indicator is designed to help you in swing trading by capturing the low and highs of the price. You may us this tool with any trading strategy and style from scalping to position trading. It is made for level of traders including newbies and advanced traders even prop-firms, hedge funds and banks to help them make sold market analysis. I create tools for serious traders who want to make a difference in
Dear Trader It is my pleasure to introduce to you my tool called the " Forex Sniper Indicator" . The major aim of this tool is to help serious traders and investors in all type of Financial Markets to catch price next movement right at the moment the price direction is about to change. This tool can be used to snipe the price direction in both down trend, uptrend and ranging markets. This tool can be used as the stand alone tool though it may be combined with other tools as well. My goal is to h
WARNING: PRICE IS SUBJECT TO RISE AT ANY TIME. GET YOUR COPY TODAY TO AVOID MORE COST! Dear Traders I am so glad to introduce to you my other tool called the Forex Sniper Entries Indicator. This tool is designed to help serious traders and investors capture big moves in the currency price movements. The philosophy behind this tool is all about winning big and riding the price movement from its beginning until the maximum point. We want to capture those big moves in both down and up markets as mu
OFFER!   OFFER ! After 3 weeks the unlimited price will be 500$ and in the future you will regret why you didn't make a purchase at this lowest price. Dear Traders, the atomic power Entries Indicator is one of the indicators that if used wisely and correctly can help you to find an edge over the market.  The indicator will work for all forex pairs, all markets and all timeframes. Still it is your duty to find the most effective timeframe for you. When the sell or buy arrow appears you will get a
OFFER! OFFER!    ONLY 5 COPIES REMAINING FOR THE NEXT PRICE TO BE 360$ Dear traders I am very glad to introduce the Sweet Arrows Indicator to you. The Sweet Arrows indicator is well designed to help serious investors to trade with confidence. In short I can say that this is one of the valuable tool to add in your trading tool kit. INSTANT, FAST AND NON LAGGING SIGNAL This is an instant signal meaning that you get the signal as soon as the bar opens. The signals don't lag meaning that it doe
Urgent reminder> Only 13 copies remaining for the price to double on all renting options. Get your copy Today! Introduction Dear Traders, I am always working to come up with tools that may help you to become a better trader and investor. Due to my experience in trading and market analysis and trading software design and development, I am glad to introduce to you my other tool called " Amazing Entries Indicator ". The Indicator is designed in a way that it combines different strategy to provide
URGENT REMINDER> Only 5 remaining Copies for next unlimited price to be 360$ (THIS IS A SPECIAL OFFER TOOL) If you are looking for FAST , RELIABLE and PROFITABLE indicator to help you take easy trades then this is the tool to go with. Trading is very tricky, frustrating, confusing, embarrassing and even can make you go broke if you approach the market with gambling mindset, poor entry and exit strategies, unreliable indicators or signals, poor money management skills and lack of knowledge. Many
Dear traders I am happy to introduce to you my new tool called "Brilliant Oscillator" Indicator. This is one of the indicators that can be used as a stand alone indicator. WHAT I LIKE ABOUT THIS TOOL IS Fast and reliable signals Purpose The purpose of this tool is to assist both newbie and Advanced traders to analyze the market with high level of accuracy in both bearish and bullish market trends. The inputs In the input section you will be able to change colors of the indicator only. Currency p
筛选:
无评论
回复评论