Fixed Range Volume Profile V1
- 指标
- 版本: 1.0
- 激活: 5

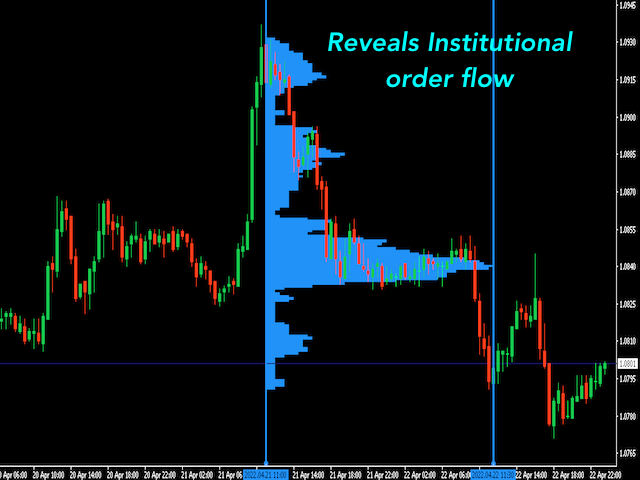
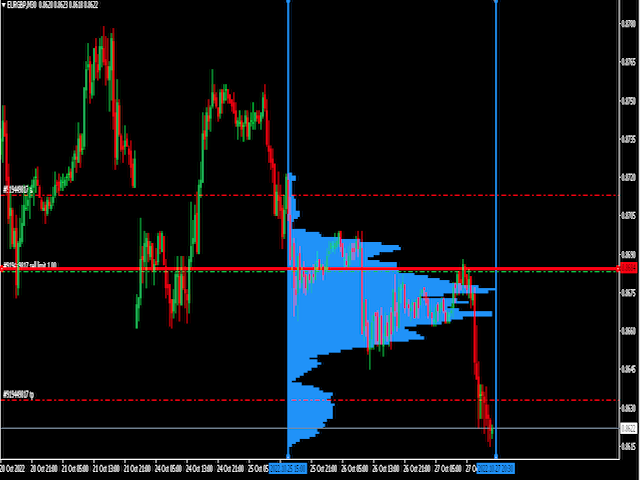
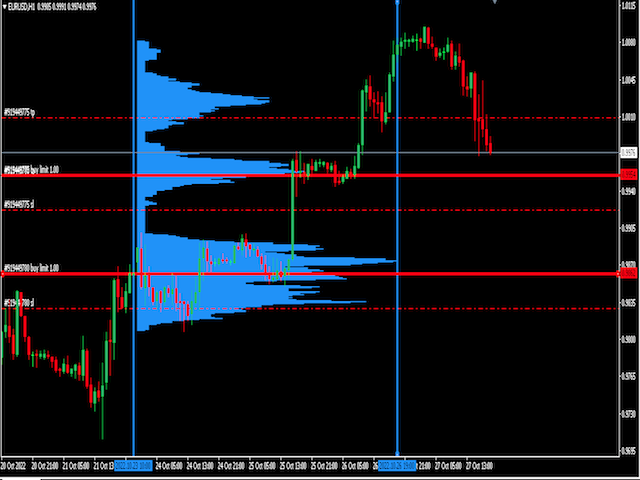
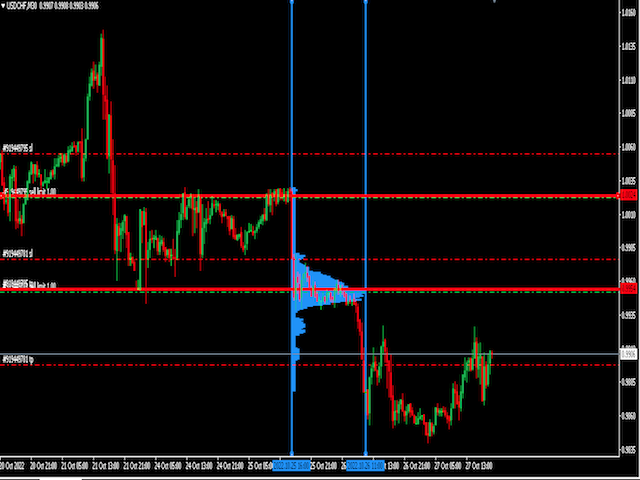
With Fixed Range Volume Profile,The traces left by the big players will not go unnoticed by you.
Professional Volume Profile Indicator reveals Institutional order flow. This advanced market indicator will teach you to spot the buying and selling. Dont want to say more because its well known by most professionals trader.
This Indicator :
- Quickly Identify the Strongest Institutional S/R Zones.
- Works with all Trading Instruments (Forex, Futures, Indexes, Commodities, Stocks, Cryptocurrency, etc).
- Works for all Timeframes (Day Trading, Swing Trading, Position Trading).
- Uses Precise Tick Volume Data.
- Extremely Fast & Very Easy to Use .
Attributes:
- Beautiful and simple graphics and user interface
- Easy to use
- High speed compared to other similar products (use advanced search algorithm)
- Ability to adjust the accuracy and speed of calculations
- Available in all markets (Forex, stock market and crypto market)
Indicator Parameters:
- Calculation Period: With this option, you can specify the deep search in a specific time-frame.
- M30 Minute: Calculation on M30 time-frame candles, Calculations with low accuracy and very fast (Recommended only in time-frame H30 and above).