Middle Volume

3.5

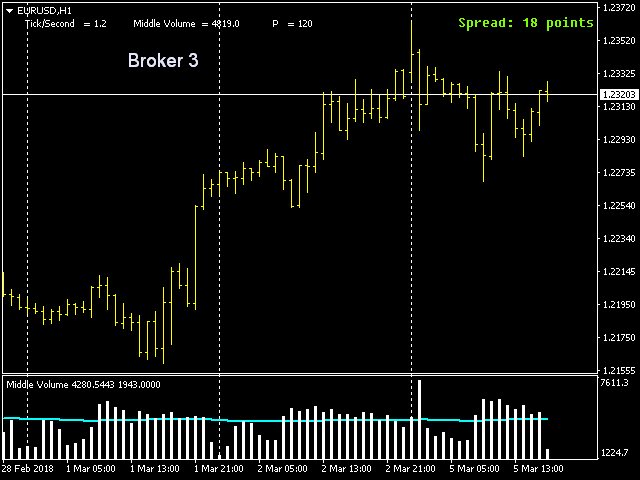
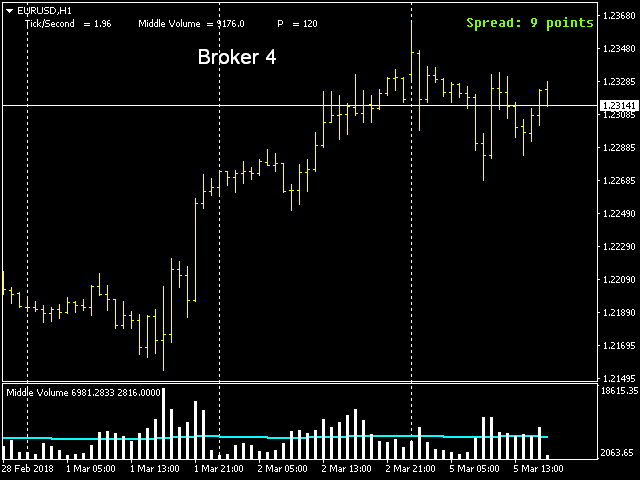
The indicator measures volumes on different charts and instruments.

Its main advantage is the ability to compare separate brokers.

The less Middle Volume and Tick / Second, the more reliable is the broker.

There is a comment in the upper left corner

Comment data:

  • Tick/Second — number of ticks per second for a selected instrument
  • Middle Volume — average volumes in the penultimate bar

This indicator allows tracking a relative market activity for different timeframes.

  • If the volumes are lower than the average middle line, the market is inactive;
  • If the volumes exceed the blue middle line, the market is trendy

How to configure the indicator?

  • Bar — dimension of the array where the indicator is calculated
  • P — volumes averaging period

To change the parameters, right-click on the chart, Charts => Indicators List => Midl Volume => Edit.

The indicator window will appear. Set the parameters.

Save the template: right-click on the chart, Charts => Template => Save Template.

评分 2
AdamSnailham
75
AdamSnailham 2021.06.04 07:16 
 

I found it useful on a 4 hour charts to see the best time to trade with good volume.

推荐产品
Market Profile 3
Hussien Abdeltwab Hussien Ryad
3 (2)
Market Profile 3 MetaTrader 4 indicator  — is a classic Market Profile implementation that can show the price density over time, outlining the most important price levels, value area, and control value of a given trading session. This indicator can be attached to timeframes between M1 and D1 and will show the Market Profile for daily, weekly, monthly, or even intraday sessions. Lower timeframes offer higher precision. Higher timeframes are recommended for better visibility. It is also possible t
FREE
The indicator allows you to trade binary options. The recommended time frame is М1 and the expiration time is 1,2,3 minutes. The indicator suitable for auto and manual trading. A possible signal is specified as a arrows above/under a candle. You should wait until the candle closes! Arrows are not re-painted Trade sessions: TOKYO section (Half-end) Currency pairs: USD/JPY Working time frame: M1 Expiration time: 1,2,3 minutes. The indicator also shows good results when using the martingale strateg
FREE
Hurst Buy and Sell Mt4
Victor Alfonso Molina Botello
Hurst Buy and Sell  This innovative indicator, inspired by xAI Grok intelligence, uses the Hurst exponent to identify the nature of the market and generate buy/sell signals. The EA for this indicator (Hurst Razer PRO EA MT5) is now available, you can see it by clicking here!  https://www.mql5.com/es/market/product/153441?source=Site+Profile+Seller  If you want more signals from the indicator, change the minimum number of bars between consecutive signals. The lower the value, the more signals it
FREE
Features: 1- Get OB/OS Levels from Golden MA Levels 2- Wait for Buy/Sell Start Level Cross 3- Optional: Should price cross Mid Level in earlier bars 4- Optional: Crossing bar High/Medium Volume 5- Optional: MA Stacked to check up/down trend for current TF 6- Optional: NRTR higher timeframes aligned Check Detailed blog post explained: https://www.mql5.com/en/blogs/post/758457 Levels with Buffers available here: Golden MA Levels Indicator: https://www.mql5.com/en/market/product/119515 Note: Arr
FREE
MT Scanner
Niravkumar Maganbhai Patel
4 (2)
This indicator helps you to Scan symbols which are in the Market Watch Window  and filter out trends with alerts. It works based on the effective indicator "SUPERTREND" which is used by many traders for trading: When box color changes to " Green " or " Red " color, it indicates you for trend change for long and short entry. And also you will get alerted on screen. When it changes to " Green ", it indicates you that trend is going upwards, and you can take the long entry. If the color changes to
FREE
Forex Market Profile and Vwap
Lorentzos Roussos
4.86 (7)
外汇市场概况(简称FMP) 这不是什么: FMP 不是经典的字母编码 TPO 显示,不显示整体图表数据配置文件计算,并且不将图表分段并计算它们。 它能做什么 : 最重要的是,FMP 指示器将处理位于用户定义频谱左边缘和用户定义频谱右边缘之间的数据。 用户只需用鼠标拉动指示器的每一端即可定义频谱。 当指标右边缘被拉到实时柱并进一步(到未来)时,指标被认为是“实时的”(它会更新新柱) 该指标将一个“锚点”对象放在它所附加的图表上,然后将该锚点与硬盘驱动器上的文件相关联。 这允许您在图表上运行一个持续的 FMP,您的设置在重新启动时持续存在,直到图表 - 或指标 - 关闭。 FMP 指标可以在一个图表上运行多个自身实例,并且您可以命名它们。(名称在指标数据中显示为半透明,以便您能够区分它们) 指标的数据窗口被快速切换控件包围,当它们的状态发生变化时,这些控件会更新该图表的指标设置的“内存”。 左手柄、右手柄和数据窗口的显示可以自定义。您可以从 13 种不同的样式组合中进行选择,或者选择每个部分的单独样式(从 13 种中选择)。 您可以选择显示与光谱左侧对齐、在中间对称居中、与光谱右侧
FREE
Smart FVG 指标 MT4 – MetaTrader 4 高级公平价值缺口检测 Smart FVG 指标为 MetaTrader 4 提供专业的公平价值缺口(Fair Value Gap,FVG)检测、监控和告警功能,所有信息都直接显示在图表上。它将基于 ATR 的过滤与结构感知逻辑相结合,帮助你去除噪音、适应流动性,并只保留最关键的不平衡区域,从而做出更加精确的交易决策。 主要优势 精准的 FVG 检测:识别真正的市场低效,而不仅仅是简单的 K 线价格跳空。 基于 ATR 的自适应精度:根据不同市场与周期自动过滤低质量信号。 实时有效性跟踪:当价格填补或突破缺口时,相关区域会被自动延伸、调整或删除。 高度可视化与自定义:可根据任何模板自定义颜色、线型和填充样式。 实用告警功能:对新出现、被填补或被突破的 FVG 提供实时通知。 性能优化:轻量化设计,适合多品种、多周期同时扫描。 工作原理 将指标加载到任意 MT4 品种与时间周期图表上。 算法会扫描历史与实时 K 线,标出当前有效的 FVG 区域。 ATR 逻辑会根据当前波动率和流动性动态调整检测条件。 当价格完全回补缺口
FREE
Simple Anchored VWAP is a lightweight yet powerful tool designed for traders who want precise volume-weighted levels without complexity. This indicator lets you anchor VWAP from any point on the chart and instantly see how price reacts around institutional volume zones. MT5 Version -  https://www.mql5.com/en/market/product/155321/ Join To Learn Market Depth -   https://www.mql5.com/en/channels/suvashishfx Using VWAP bands and dynamic levels, the tool helps you understand where real buying and s
FREE
Scorpion Scalper Pro
Mohamed Amine Talbi
In the age of speed, everyone wants to gets what he/she wants quickly. Trading is all about gaining money, and scalping is a way of doing it in a short time. The "Scorpion Scalper Pro" has been named on the scorpion because of its speed. The indicator serves to provide signals for the M15 timeframe. It also sends Alerts (window alert, email alert, push notification alert) whenever a buy/sell signal occurs, and the alerts are customizable (they can be turned ON or OFF). Indicator inputs : - Buy
Simple QM Pattern
Suvashish Halder
4.5 (2)
Simple QM Pattern is a powerful and intuitive trading indicator designed to simplify the identification of the Quasimodo (QM) trading pattern. The QM pattern is widely recognized among traders for effectively signaling potential reversals by highlighting key market structures and price action formations. This indicator helps traders easily visualize the QM pattern directly on their charts, making it straightforward even for those who are new to pattern trading. Simple QM Pattern includes dynamic
FREE
High Low Open Close MT4
Alexandre Borela
4.81 (21)
如果你象这个项目一样,就有5个饥饿审查。 这项指标采用了既定价格的公开、高、低价和关闭价格 可以对特定时间区加以调整。 许多机构和专业人士都认为这些是重要的。 贸易商可以为你了解他们可能更进一步的地点, 积极。 现有期间为: 前一日。 前一星期。 曾任Month。 曾任。 前一年。 或: 目前日。 目前周。 目前 Month。 目前配额。 今年。
FREE
Volume MA
Amirhossein Ghasemi Moroodi
After 7 years I decided to release some of my own indicators and EAs for free. If you find them useful please  Show support with a 5-star rating! Your feedback keeps the free tools coming! See other my free tools as well here _________________________________ Volume Moving Average (Volume MA) Indicator for Advanced Forex Market Analysis Introducing the Volume Moving Average (Volume MA) Indicator, meticulously developed in MQL4, a pivotal tool for enhancing your forex trading strat
FREE
Esse indicador mede o 1º Canal de referencia e a 1º  Zona Neutra * configurar o canal macro para verificar a frequencia MAIOR H1 H4 1D * configurar o canal micro para verificar a frequencia Menor 1M 5M 15M Como instalar o Indicador fimathe. E uma pré mentoria tem uma estrategia Secreta bonus nesse video . assitao o video para enteder as logicas que podemos iniciar com esse indicador. https://www.youtube.com/playlist?list=PLxg54MWVGlJzzKuaEntFbyI4ospQi3Kw2
FREE
Trend Rising SDEA MT4
Wan Mohd Safwan Bin Wan Daud
Trend Rising 是自定義 MT4 (Metatrader 4) 指標,最適合剝頭皮 TF M30 及以下,使用基於多個時間框架的 Bill William 指標分析趨勢和動量模式。結果,它確定了適用於大多數貨幣對的趨勢的開始和結束。 Trend Rising 指標是基於 Accelerator Oscillator 和 Awesome Indicator 開發的。 主要特徵  用顏色顯示趨勢的開始和結束。  使用 base-TF H1 輕鬆識別趨勢強度(強牛市和熊市)。 識別市場調整。 (當前圖表的弱勢和可能的逆轉)  當建議的條目發佈時,在圖表上繪製 SL 級別。  獲取圖表中發生的每一次趨勢變化的警報。 趨勢上升的優勢  使用所有貨幣對(外匯、加密貨幣、指數和商品) 使用所有時間範圍。 (推薦時段:M30及以下TF) 警報生成器。 (彈出警報、推送通知警報等) 未重新粉刷  100% 免費指標 接觸 如果您有任何疑問或需要幫助,請通過私信與我聯繫。 作者 Safwan Daud,馬來西亞貿易分析師。青年商品交易員(YCT)創始人
FREE
SMA Indicator
Nitu Brijesh Yadav
Arrow Indicator (Buy/Sell Alerts) – Simple Yet Powerful Tool!             Product Version: 1.01           Indicator Type: Trend Reversal Signals           Timeframes Supported: All (Recommended: H1, H4, D1)           Key Features: Buy Signal: Green upward arrow () appears below the candle  Sell Signal : Red downward arrow () appears above the candle Accurate Trend Reversal Detection – Based on tried and tested SMA strategy. ️ Clean Chart View – Minimalist, non-i
FREE
Rainbow MT4
Jamal El Alama
Rainbow MT4 is a technical indicator based on Moving average with period 34 and very easy to use. When price crosses above MA and MA changes color to green, it’s a signal to buy. When price crosses below MA and MA changes color to red, it’s a signal to sell. The Expert advisor ( Rainbow EA MT4) based on Rainbow MT4 indicator, as you can see in the short video below is now available here .
FREE
Point Of Week
Kristhara Tharaviriyadech
The **Point of Week Indicator** is a powerful MetaTrader 4 indicator that displays point values for multiple timeframes (W1, D1, H4, H1) directly on your chart. It calculates the position of the close price within the candle's range and displays it as a point value, along with the total range of the candle. ## Features - Displays point values for 4 timeframes: **Weekly (W1), Daily (D1), 4-Hour (H4), and Hourly (H1)** - Shows point value and total range in format: `"point_value/range_value
FREE
Super Auto Fibonacci
Muhammed Emin Ugur
Discover the power of precision and efficiency in your trading with the " Super Auto Fibonacci " MT4 indicator. This cutting-edge tool is meticulously designed to enhance your technical analysis, providing you with invaluable insights to make informed trading decisions. Key Features: Automated Fibonacci Analysis: Say goodbye to the hassle of manual Fibonacci retracement and extension drawing. "Super Auto Fibonacci" instantly identifies and plots Fibonacci levels on your MT4 chart, saving you tim
FREE
Renko bars builder
Navdeep Singh
4.2 (5)
The indicator builds a Renko chart in the sub window for the current symbol. The bars are formed from live data and the desired bar size can be set in the inputs tab. Most importantly, because the Renko chart only uses price to construct bars and ignores time, the indicator can be applied to any time frame and same results can be achieved. Recommended usage As Renko charts are famous for eliminating noise so traders can use this tool to see clear picture of the trend to help their analysis, entr
FREE
ADR Bands
Navdeep Singh
4.5 (2)
Average daily range, Projection levels, Multi time-frame ADR bands shows levels based on the selected time-frame. Levels can be used as projections for potential targets, breakouts or reversals depending on the context in which the tool is used. Features:- Multi time-frame(default = daily) Two coloring modes(trend based or zone based) Color transparency  
FREE
WH Price Wave Pattern MT4
Wissam Hussein
4.4 (5)
Welcome to our   Price Wave Pattern   MT4 --(ABCD Pattern)-- The ABCD pattern is a powerful and widely used trading pattern in the world of technical analysis. It is a harmonic price pattern that traders use to identify potential buy and sell opportunities in the market. With the ABCD pattern, traders can anticipate potential price movements and make informed decisions on when to enter and exit trades. EA Version : Price Wave EA MT4 MT5 version : Price Wave Pattern MT5 Features :  Automatic
FREE
枢轴点斐波那契 RSJ 是一个指标,它使用斐波那契汇率追踪当天的支撑线和阻力线。 这个壮观的指标使用斐波那契汇率通过枢轴点创建多达 7 个支撑位和阻力位。 价格如何尊重该支撑和阻力的每个水平真是太棒了,在那里可以感知操作的可能进入/退出点。 特征 多达 7 个支撑位和 7 个阻力位 单独设置级别的颜色 输入 枢轴类型 Pivot Fibo RSJ1 = Fibo ratio 1 计算 Pivot Fibo RSJ2 = Fibo ratio 2 计算 Pivot Fibo RSJ3 = Fibo ratio 3 计算 Pivot Fibo Classic = 经典枢轴计算 最低枢轴级别 旋转 3 个级别 旋转 4 个级别 旋转 5 个级别 枢轴 6 个级别 旋转 7 个级别 如果您仍有疑问,请通过直接消息与我联系: https://www.mql5.com/zh/users/robsjunqueira/
FREE
PZ Penta O MT4
PZ TRADING SLU
2.33 (3)
The Penta-O is a 6-point retracement harmonacci pattern which usually precedes big market movements. Penta-O patterns can expand and repaint quite a bit. To make things easier this indicator implements a twist: it waits for a donchian breakout in the right direction before signaling the trade. The end result is an otherwise repainting indicator with a very reliable trading signal. The donchian breakout period is entered as an input. [ Installation Guide | Update Guide | Troubleshooting | FAQ | A
FREE
Flat Reminder
Chi Sum Poon
Flat Reminder Overview Flat Reminder is a powerful technical analysis tool that identifies and highlights price consolidation zones on your chart. It detects when price action slows down and moves sideways, indicating potential reversal points, continuation setups, or key decision zones in the market. Key Features Consolidation Detection : Automatically identifies flat price zones where market momentum decreases Range Measurement : Calculates and displays the exact range of each consolidation in
FREE
Traditional MACD MT4
Daniel Lewis
4.58 (55)
MetaTrader 4/5 中的 MACD 指标看上去与其它许多图表软件里的 MACD 不同。这是因为 MetaTrader 4/5 版本的 MACD 显示 MACD 曲线作为直方图,而传统上显示为曲线。此外,MetaTrader 4/5 版本使用 SMA 计算信号线,而根据 MACD 的定义,它应该使用 EMA。MetaTrader 4/5 版本也不计算实际的 MACD 直方图 (即 MACD 与信号线之间的差异)。这可能对那些 MetaTrader 4/5 的新手带来困惑,因为将 MACD 线显示为直方图,而未提供实际的 MACD 直方图。 这款指标按照其创造者 (Gerald Appel) 的定义显示 MACD,如同其它图表软件里显示的那样。而 MACD 线的计算采用 "快速" EMA 和 "慢速" EMA 之间的差异。信号线是 MACD 线的 EMA。MACD 直方图是MACD 和信号线之间的差异 (MACD 直方图可自行作为可靠的用作背离信号)。 True/False 启用开关,您可以显示/隐藏 MACD/信号线,以及 MACD 直方图。
FREE
BoxInside MT4
Evgeny Shevtsov
4.83 (6)
This indicator calculates the volume profile and places labels that correspond to the VAH, VAL and POC levels, for each candle individually. Indicator operation features The indicator works on the timeframes from M5 to MN, but it uses the history data of smaller periods: M1 - for periods from M5 to H1, M5 - for the H4 period, M30 - for the D1 period, H4 - for the W1 period, D1 - for the MN period. The color and location of the VAL, VAH and POC labels on the current candle are considered to be c
FREE
Follow The Line
Oliver Gideon Amofa Appiah
3.94 (16)
FOLLOW THE LINE GET THE FULL VERSION HERE: https://www.mql5.com/en/market/product/36024 This indicator obeys the popular maxim that: "THE TREND IS YOUR FRIEND" It paints a GREEN line for BUY and also paints a RED line for SELL.  It gives alarms and alerts of all kinds. IT DOES NOT REPAINT and can be used for all currency pairs and timeframes. Yes, as easy and simple as that. Even a newbie can use it to make great and reliable trades. NB: For best results, get my other premium indicators for more
FREE
RSI with Bands
Amirhossein Ghasemi Moroodi
经过7年的发展,我决定免费发布我自己的一些指标和专家顾问(EA)。 如果您觉得它们有用,请给予 五星好评支持!您的反馈激励我继续提供免费工具。 也探索我的其他免费工具 这里 。 _________________________________ "带带子的RSI"指标 —— 更好的交易决策 "带带子的RSI"指标将经典的RSI与简单的带子相结合,更清楚地指示何时买入或卖出。它旨在帮助您发现进入和离开市场的最佳时机。 主要优势: 精准超买和超卖分析 : 通过添加带子来增强RSI,突出显示市场的真正极端,避免常见的误导信号。 清晰信号 : 轻松识别价格过高或过低的时刻,从而做出交易决策。 更好的时机 : 带子为常规RSI提供额外信息,帮助您找到采取行动的正确时刻。 如何使用: 用户友好设置 ️: 轻松将其添加到您的Metatrader 4中。几下点击即可根据您的需求进行调整。 易于阅读 : 关注指标,并用它来指导您何时买入或卖出。 "带带子的RSI"指标非常适合希望更智能而不是更辛苦交易的人,使用易于理解的信号。 联系方式 有问题或需要帮
FREE
Zig Zag 123
Stephen Reynolds
Zig Zag 123 tells us when a reversal or continuation is more likely by looking at the shift in supply and demand. When this happens a signature pattern appears known as 123 (also known ABC) will often break out in direction of higher low or lower high. Stop loss and take profit levels have been added. There is a panel that shows the overall performance of your trades for if you was to use these stop loss and take profit levels.  We get alerted if a pattern 123 appears and also if the price re
FREE
Virtual Targets
Hoang Van Dien
3.83 (6)
This indicator is very useful for day traders or short term traders. No need to calculate the number of pips manually, just look at the chart and you will see the Virtual Take Profit / Virtual Stop Loss target line and evaluate whether the entry point is feasible to reach the intended target or not. Enter the intended Take Profit / Stop Loss pips for your trade. The indicator will display Virtual Take Profit / Virtual Stop Loss lines for you to easily see if the target is feasible or not.
FREE
该产品的买家也购买
Gann Made Easy
Oleg Rodin
4.83 (153)
Gann Made Easy 是一个专业且易于使用的外汇交易系统,它基于使用先生理论的最佳交易原则。 W.D.江恩。该指标提供准确的买入和卖出信号,包括止损和获利水平。您甚至可以使用推送通知在旅途中进行交易。 购买后请联系我,免费获取交易提示、奖金和 GANN MADE EASY EA 助手! 您可能已经多次听说过江恩交易方法。通常 Gann 的理论不仅对于新手交易者而且对于那些已经有一定交易经验的人来说都是非常复杂的东西。这是因为江恩的交易方法在理论上并不那么容易应用。我花了几年时间来完善这些知识,并将最好的原则应用到我的外汇指标中。 该指标非常易于应用。您所需要的只是将其附加到您的图表并遵循简单的交易建议。该指标不断进行市场分析工作并寻找交易机会。当它检测到一个好的入口点时,它会为您提供一个箭头信号。该指标还显示止损和获利水平。 换句话说,当您像先生一样进行交易时,该指标会为您提供最佳江恩建议。江恩亲自告诉你此时此刻该做什么。但最好的部分是您不需要了解任何有关江恩交易原则的知识,因为该指标会为您完成整个市场分析工作。
Pulse Scalping Line - an indicator for identifying potential pivot points. Based on this indicator, you can build an effective Martingale system. According to our statistics, the indicator gives a maximum of 4 erroneous pivot points in a series. On average, these are 2 pivot points. That is, the indicator shows a reversal, it is erroneous. This means that the second signal of the indicator will be highly accurate. Based on this information, you can build a trading system based on the Martingale
Gold Signal Pro
Mohamed Hassan
5 (1)
First 25 copies at $80, after that price becomes $149 (3 copies left) Gold Signal Pro is a powerful MT4 indicator designed to help traders spot strong price reactions in the market. It focuses on clear wick rejections , showing when price strongly rejects a level and often continues in the same direction. Gold Signal Pro is mainly built for scalping gold (XAUUSD) and works best on lower timeframes like M5 and M15 , where timing matters most. That said, it can also be used on any forex pair, a
目前八折优惠! 对任何新手或专家交易者来说都是最好的解决方案! 这个仪表板软件适用于28种货币对。它基于我们的两个主要指标(高级货币强度28和高级货币冲动)。它对整个外汇市场提供了一个伟大的概述。它显示高级货币强度值,货币运动速度和28个外汇对在所有(9)时间段的信号。想象一下,当你可以使用图表上的单一指标观察整个市场,以确定趋势和或剥头皮的机会时,你的交易将得到改善 我们已经在这个指标中建立了一些功能,使你更容易识别强势和弱势货币,同时识别和确认潜在的交易。该指标以图形方式显示货币的强势或弱势是增加还是减少,以及它在所有时间段的表现。 增加的新功能是动态市场斐波那契水平,它适应当前的市场条件变化,这是一个已经在我们的高级货币强度28和高级货币冲动指标中使用的成熟的加分项。 在交易时,总是将弱势货币和强势货币配对,这个新指标将帮助你做到这一点。 用户手册:点击这里  https://www.mql5.com/en/blogs/post/708783 特点  显示每个时间段的ACS28和GAP-speed(冲动)的货币强度值。 列:颜色代码以7种颜色显示货币强度:强势
Smc Blast Signal
Mohit Dhariwal
5 (3)
NEW YEAR 2026 SALE OFFER PRICE AT JUST 75 DOLLARS FEW COPIES ONLY AT This price From 28th Jan -31th Jan MIDNIGHT Final offer GRAB YOUR COPY ON THIS New Year EVE last offer GRAB IT! Prices will be increased to 150 after the offer period ends Full Fledged EA and Alert plus for alerts will also be provided in this offer along with the purchase of Indicator. Limited copies only at this price and Ea too. Grab your copy soon Alert plus for indicator with set file is kept in comment section with the im
Volatility Trend System - a trading system that gives signals for entries. The volatility system gives linear and point signals in the direction of the trend, as well as signals to exit it, without redrawing and delays. The trend indicator monitors the direction of the medium-term trend, shows the direction and its change. The signal indicator is based on changes in volatility and shows market entries. The indicator is equipped with several types of alerts. Can be applied to various trading ins
Apollo SR Master
Oleg Rodin
5 (1)
Apollo SR Master 是一款支撑/阻力指标,其特殊功能使利用支撑/阻力区域进行交易更加便捷可靠。该指标通过检测局部价格顶部和底部,实时计算支撑/阻力区域,没有任何时间延迟。为了确认新形成的支撑/阻力区域,该指标会显示特殊信号,表明该支撑/阻力区域可以作为实际的卖出或买入信号。在这种情况下,支撑/阻力区域的强度会增强,因此从该区域进行交易的成功率也会更高。这正是该指标的核心理念。 SR区域也使止损和止盈的操作更加便捷。根据信号方向,可以将SR区域上方或下方的空间用作止损位。此外,相对的SR区域也可以用作潜在的止盈区域。 我还免费向所有 Apollo SR Master 指标的用户提供我的“Apollo 价格行为系统”指标。这两个指标结合使用将帮助您找到更好的入场点。 购买后请联系我,即可免费获得我的交易技巧以及我的“阿波罗价格行为系统”指标作为赠品!
Atomic Analyst
Issam Kassas
5 (3)
首先值得强调的是,该交易指标是非重绘、非延迟的指标,这使其成为手动和机器人交易的理想选择。 用户手册:设置、输入和策略。 Atomic Analyst是一种PA价格行动指标,利用价格的力量和动量来寻找市场上更好的机会。配备了高级过滤器,可帮助去除噪音和假信号,并提高交易潜力。使用多层复杂的指标,Atomic Analyst扫描图表,并将复杂的数学计算转化为任何初学者都能理解并用来做出一致交易决策的简单信号和颜色。 “Atomic Analyst”是专为新手和经验丰富的交易者量身定制的综合交易解决方案。它将高级指标和一流功能融合为一体的交易策略,使其成为所有类型交易者的多功能选择。 日内交易和剥头皮策略:专为快速准确的日内交易和短期交易而设计。 日内和摆动交易策略:可用作追求价格大幅波动的日内和摆动交易者的可靠工具。 多货币和市场:凭借其可靠的精度,在不同的工具和市场上运作。 多个时间框架:可在多个时间框架上使用,性能良好。 稳定性:所有指标均不重绘、不重绘和不滞后,确保可靠的信号。 信号清晰度:提供箭头信号,用于清晰的入场和出场点。 实时警报:通过交易入场、SL和TP警报通知交易者
Game Changer Indicator
Vasiliy Strukov
4.47 (15)
Game Changer 是一款革命性的趋势指标,适用于任何金融工具,可将您的 MetaTrader 平台升级为强大的趋势分析工具。该指标不会重绘,也不会出现滞后。它适用于任何时间范围,有助于识别趋势,发出潜在反转信号,可用作追踪止损机制,并提供实时警报,以便您快速做出市场反应。无论您是经验丰富的交易员、专业人士,还是寻求优势的初学者,这款工具都能帮助您自信、自律地进行交易,并清晰地了解潜在的趋势动态。 购买后立即联系我,即可获得个人奖励!您可以免费获得我们的强力支撑和趋势扫描指标,请私信我! 请注意,我不在 Telegram 上出售我的 EA 或特殊套件,它们仅适用于 MQL5,我的套件文件也仅在我的博客上提供。 请小心诈骗者 ,不要从其他人那里购买任何套件! 设置 启用趋势变化警报 - 真/假 - 趋势变化时在图表上显示警报 发送推送通知 - 真/假 - 启用手机推送警报通知 发送邮件通知 - 真/假 - 发送趋势变化的邮件通知到电子邮件
GOLD Impulse with Alert
Bernhard Schweigert
4.64 (11)
这个指标是我们2个产品 Advanced Currency IMPULSE with ALERT  +   Currency Strength Exotics 的一个超级组合。 它适用于所有时间框架,并以图形方式显示8种主要货币和一种符号的强势或弱势冲动! 该指标专门用于显示任何符号的货币强度加速,如黄金、异国货币对、商品、指数或期货。这是它的第一个指标,任何符号都可以被添加到第9行,以显示黄金、白银、石油、DAX、US30、MXN、TRY、CNH等的真实货币强度加速(冲动或速度)。 建立在新的基础算法上,它使识别和确认潜在的交易更加容易。这是因为它以图形方式显示了一种货币的强势或弱势是否正在加速,并测量了这种加速的速度--把它想象成你汽车中的速度表。当你加速时,事情显然会发生得更快,这在外汇市场上也是一样的,即如果你配对的货币正在向相反的方向加速,你就会发现一个潜在的有利可图的交易。 动态市场斐波那契28水平被用作警报触发器,将适应市场活动。如果冲动击中黄色触发线,你将收到警报。然后你就知道作为一个交易员应该做什么。货币对和方向已经给出。只需点击警报按钮,就可以切换到该货
Scalper Inside PRO
Alexey Minkov
4.74 (69)
An exclusive indicator that utilizes an innovative algorithm to swiftly and accurately determine the market trend. The indicator automatically calculates opening, closing, and profit levels, providing detailed trading statistics. With these features, you can choose the most appropriate trading instrument for the current market conditions. Additionally, you can easily integrate your own arrow indicators into Scalper Inside Pro to quickly evaluate their statistics and profitability. Scalper Inside
M1 Sniper
Oleg Rodin
4.89 (18)
M1 SNIPER 是一款易于使用的交易指标系统。它是一个专为 M1 时间框架设计的箭头指标。该指标可以作为独立的系统在 M1 时间框架下进行剥头皮交易,也可以作为您现有交易系统的一部分使用。虽然该交易系统专为 M1 时间框架交易而设计,但它也可以用于其他时间框架。我最初设计此方法是为了交易 XAUUSD 和 BTCUSD。但我发现这种方法在其他市场交易中也同样有用。 指标信号既可以顺势交易,也可以逆势交易。我教授一种特殊的交易技巧,帮助您利用指标信号进行双向交易。该方法基于使用特殊的动态支撑位和阻力位区域。 购买后,您可以立即下载 M1 SNIPER 箭头指标。此外,我还为所有 M1 SNIPER 工具用户免费提供下方屏幕截图所示的 Apollo Dynamic SR 指标!这两个指标的组合可以帮助您更轻松、更准确地利用 M1 时间框架进行交易。 购买后请联系我,免费获取交易提示和奖励指标! 祝您交易成功!
Trend indicator AI
Ramil Minniakhmetov
4.85 (78)
趋势人工智能指标是一个伟大的工具,将加强交易者的市场分析结合趋势识别与可操作的进入点和逆转警报。 该指标使用户能够自信和精确地驾驭外汇市场的复杂性 除了主要信号,趋势Ai指标识别在回调或回调期间出现的次要入口点,使交易者能够利用既定趋势内的价格修正。 重要优势: *MT4及MT5工程 *明确买入或卖出信号 ·不重绘 *适用于所有资产 小心我不卖EA或设置电报它骗局. 所有设置免费在这里的博客。  重要! 购买后立即与我联系,以获得指示和奖金! 真实的操作监控以及我的其他产品可以在这里找到: https://www.mql5.com/en/users/mechanic/seller&nbsp ; 设置和输入: 建议为所有资源设置默认设置。 第...
Currency Strength Wizard
Oleg Rodin
4.84 (55)
货币强度向导是一个非常强大的指标,为您提供成功交易的一体化解决方案。该指标使用多个时间范围内所有货币的数据来计算这个或那个外汇对的力量。此数据以易于使用的货币指数和货币电力线的形式表示,您可以使用它们来查看这种或那种货币的力量。 您所需要的只是将指标附加到您要交易的图表上,该指标将向您显示您交易的货币的真实强度。该指标还向您显示买卖量压力的极值,您可以在顺势交易时利用这些压力。该指标还显示了基于斐波那契的可能目标。该指标可用于各种交易时间范围。该指标支持各种货币对的交易。 该指标为您提供所有类型的警报,包括推送通知。 购买后请联系我。我将与您分享我的交易技巧,并免费为您提供丰厚的红利指标! 祝您交易愉快,获利丰厚!
RFI levels PRO
Roman Podpora
提前指示   确定市场反转水平和区域 ,让您可以等待价格回到该水平并在新趋势的开始阶段(而不是结束阶段)进入市场。 他展示了   逆转水平   市场确认方向转变并形成进一步走势。 该指标无需重绘即可运行,针对任何交易品种都进行了优化,并且与以下因素结合使用时可发挥其最大潜力:       趋势线专业版   指标。 适用于所有仪器的可逆结构扫描仪 自动跟踪所有交易工具,并立即识别所有 R 反转模式,显示 LOGIC AI 信号已经存在的位置以及其他有用的信息。 逻辑人工智能——一款显示入口点的助手 一种智能信号,用于确定最佳入场时机。它采用 TPSproSYSTEM 算法,分析价格走势、趋势以及主要参与者的活动。 当 LOGIC AI 出现时,意味着市场条件已完全准备好做出成功概率很高的交易决策。 (R1-PRO)模式,该模式使用趋势专业指标的趋势变化 使用来自 TPSpro TREND PRO 指标的趋势数据,并基于此构建 R 构造。 该系统自动分析趋势方向,识别反转点和关键市场结构,利用逻辑人工智能帮助交易者精准定位入场点。 (R1-BOS)        一种利用指标趋势变化的
Miraculous 指标 – 100% 不重绘的外汇和二元期权工具,基于江恩九方图 这个视频介绍的 Miraculous 指标 是一款专为外汇和二元期权交易者开发的高精度、强大交易工具。该指标的独特之处在于它建立在传奇的 江恩九方图 和 江恩振动法则 之上,使其成为现代交易中可用的最精确预测工具之一。 Miraculous 指标 完全不重绘 ,这意味着它的信号在 K 线收盘后不会改变或消失——你看到的就是你得到的。这为交易者提供了可靠且一致的基础,让他们能够自信地进出场交易。 主要特点: 基于江恩九方图和江恩理论构建 100% 不重绘的信号系统 适用于所有时间周期(M1、M5、H1、H4、日线、周线) 适用于外汇和二元期权交易 清晰的买卖信号,准确率高 可用于剥头皮、日内交易或波段交易 兼容大多数 MT4 平台 这款工具旨在帮助初学者和专业交易者做出更好、更明智的决策。无论您是交易货币、指数还是二元期权,Miraculous 指标都将为您在市场中提供所需的优势。
Currency Strength Exotics
Bernhard Schweigert
4.88 (33)
目前8折优惠! 对任何新手或专家交易者来说都是最好的解决方案! 这个指标是专门用来显示任何符号的货币强度,如异国货币对、商品、指数或期货。它是同类产品中的第一个,任何符号都可以添加到第9行,以显示黄金、白银、石油、DAX、US30、MXN、TRY、CNH等的真实货币强度。这是一个独特的、高质量的、负担得起的交易工具,因为我们已经纳入了一些专有的功能和一个新的公式。想象一下,你的交易将如何改善,因为你能够准确地确定新趋势或剥头皮机会的触发点? 用户手册:点击这里   https://www.mql5.com/en/blogs/post/708876 它适用于所有时间框架。你将很快能够看到TREND! 根据新的基础算法设计,它使识别和确认潜在交易变得更加容易。这是因为它以图形方式显示了8种主要货币和一种符号的强弱。 该指标显示了8种主要货币(澳元加元瑞士法郎欧元英镑日元新西兰美元)的强弱线,再加上一个符号! 该指标显示了符号的真实价值。例如:对于XAUUSD(黄金):价格以美元报价。如果黄金在上涨,你怎么能知道是黄金的强势还是美元的弱势?只有当黄金走强时,我们才会进行交易。该指
购买此指标即可免费获得我的专业交易管理器。 首先,值得强调的是,这个交易系统是一个非重绘、非重画和非滞后的指标,这使得它非常适合手动和机器人交易。 在线课程,手册和下载预设。 “智能趋势交易系统 MT5”是专为新手和经验丰富的交易者量身定制的综合交易解决方案。它结合了超过 10 个优质指标,具有 7 多个强大的交易策略,使其成为适用于各种市场条件的多功能选择。 趋势跟随策略:提供精确的入场和止损管理,以有效地跟随趋势。 反转策略:识别潜在的趋势反转,使交易者能够利用区域市场的机会。 剃头策略:专为快速准确的日内交易和短期交易而设计。 稳定性:所有指标都不会重绘、不会重画和不会滞后,确保可靠的信号。 定制:支持自定义策略,以满足个人交易偏好。超过 7 种策略和组合可帮助您找到最佳策略。 信号清晰度:提供箭头信号,以指示清晰的入场和退出点。 实时警报:通过交易进出警报使交易者保持了解。 深入分析:提供更高时间框架的趋势分析和实时交易监控。 自适应颜色编码:利用蜡烛颜色编码来显示成交量、趋势和反转蜡烛信号。通过蜡烛颜色分析市场方向。 “智能趋势交易系统 MT5”赋予交易者必要的工具,以便在
Advanced Currency IMPULSE with ALERT
Bernhard Schweigert
4.91 (489)
目前31%的折扣!! 对任何新手或专家交易者来说都是最好的解决方案! 这个指标是一个独特的、高质量的、负担得起的交易工具,因为我们已经纳入了一些专有的功能和一个秘密的公式。只需一张图表,它就能给出所有28种货币对的警报。想象一下,你的交易将如何改善,因为你能够准确地确定新趋势或剥头皮机会的触发点 建立在新的基础算法上,它使识别和确认潜在交易变得更加容易。这是因为它以图形方式显示了一种货币的强势或弱势是否正在加速,并测量了这种加速的速度--把它想象成你汽车中的速度表。当你加速时,事情显然会发生得更快,这在外汇市场上也是一样的,即如果你配对的货币正在向相反的方向加速,你就会发现一个潜在的有利可图的交易。 货币动量的垂直线和箭头将指导你的交易! 动态的市场斐波那契23水平被用作警报触发器,将适应市场活动。如果冲动触及黄色触发线,您将在MetaTrader或您的电子邮件或推送警报中收到警报。然后你就知道作为一个交易员应该做什么。货币对和方向已经给出。只要点击警报按钮,就可以切换到该货币对或打开一个新的图表,以便进一步分析。警报级别可以通过用户输入来改变,可以选择3个敏感度级别。 尽
IQ Gold Gann Levels
INTRAQUOTES
5 (4)
Presenting one-of-a-kind Gann Indicator for XAUUSD IQ Gold Gann Levels is a non-repainting, precision tool designed exclusively for XAUUSD/Gold intraday trading. It uses W.D. Gann’s square root method to plot real-time support and resistance levels, helping traders spot high-probability entries with confidence and clarity. William Delbert Gann (W.D. Gann) was an exceptional market analyst whose trading technique was based on a complex blend of mathematics, geometry, astrology, and ancient calcul
Basic Harmonic Patterns Dashboard
Mehran Sepah Mansoor
5 (3)
该仪表盘显示所选符号的最新可用谐波形态,因此您可以节省时间并提高效率 /  MT5 版本 。 免费指标:  Basic Harmonic Pattern 指标列 Symbol: 显示所选符号 Trend:   看涨或看跌 Pattern:  形态类型(Gartley、蝴蝶、蝙蝠、螃蟹、鲨鱼、Cypher 或 ABCD) Entry:   入口价格 SL: 止损价 TP1: 第一止盈价 TP2: 第二次获利价格 TP3: 第三次获利价格 Current price:  当前价格 Age (in bars): 最后绘制的模式的年龄 主要输入 Symbols : 从 "28 种主要货币对 "或 "选定符号 "中选择。 Selected Symbols : 希望监控的符号,用逗号分隔("EURUSD,GBPUSD,XAUUSD")。如果您的经纪商为货币对设置了后缀或前缀,您必须在以下两个参数中添加(货币对前缀或货币对后缀)。 Max Iteration: 调整模式的最大迭代次数(如果该值越小,则模式越少,性能越快;如果该值越大,则模式越多,性能越慢)。事实上,它的工作原理如下:如果该值
目前有26%的折扣!! 这个指标是我们两个主要指标( Advanced Currency Strength 28   &  Advanced Currency IMPULSE with ALERT )的一个超级组合。它显示了28个外汇对的TICK-UNITS货币强度值和警报信号。可以使用11种不同的Tick-Units。它们是1、2、3、4、5、6、10、12、15、20和30秒。子窗口中的Tick-Unit栏将被显示并向左移动,当在一秒钟的定时器中至少有一个Tick。 只用一个图表,你就可以剥28个外汇货币对的头皮!想象一下,你的剥头皮将如何提高。想象一下,你的剥头皮将如何改善,因为你能够准确地确定剥头皮机会的触发点? 这是市场上第一个在比1分钟更短的时间内工作的货币强度指标! 它是为那些希望快速进出并从市场中切出小点数的快速剥头皮者准备的。 用户手册:点击这里 https://www.mql5.com/en/blogs/post/727178 特点。 为28个货币对提供嘀嗒单位的卖出/买入警报,有一个按钮可以快速打开目标图表。 在3种敏感模式中选择一种(慢-中-快
Easy Breakout
Mohamed Hassan
4.71 (14)
After your purchase, feel free to contact me for more details on how to receive a bonus indicator called VFI, which pairs perfectly with Easy Breakout for enhanced confluence!    Easy Breakout is a powerful price action trading system built on one of the most popular and widely trusted strategies among traders: the Breakout strategy ! This indicator delivers crystal-clear Buy and Sell signals based on breakouts from key support and resistance zones. Unlike typical breakout indicators, it levera
Matrix Arrow Indicator MT4
Juvenille Emperor Limited
5 (3)
矩阵箭头指标 MT4 是一种独特的 10 合 1 趋势,遵循 100% 非重绘多时间框架指标 ,可用于所有符号/工具:外汇、商品、加密货币、指数、股票。  Matrix Arrow Indicator MT4 将在其早期阶段确定当前趋势,从多达 10 个标准指标中收集信息和数据,它们是: 平均定向运动指数 (ADX) 商品渠道指数 (CCI) 经典 Heiken Ashi 蜡烛 移动平均线 移动平均收敛散度 (MACD) 相对活力指数 (RVI) 相对强弱指数 (RSI) 抛物线SAR 随机振荡器 威廉姆斯的百分比范围 当所有指标给出有效的买入或卖出信号时,相应的箭头将打印在图表上,在下一根蜡烛/柱线开盘时,指示强劲的上升趋势/下降趋势。用户可以选择使用哪些指标,并可以单独调整每个指标的参数。 Matrix Arrow Indicator MT4 仅从选定的指标中收集信息,并仅根据其数据打印箭头。 Matrix Arrow Indicator MT4 还可以为所有新信号发送终端、推送通知或电子邮件警报。无论您是黄牛、日内交易者还是波段交易者, Matrix Arrow Indicat
介绍 F-16 飞机指标,这是一款领先的 MT4 工具,旨在革新您的交易体验。灵感来自于 F-16 战斗机无与伦比的速度和精准度,该指标结合了先进算法和尖端技术,在金融市场上提供卓越的性能。 通过 F-16 飞机指标,您将在竞争中腾飞,因为它提供实时分析并生成高度准确的交易信号。其动态功能旨在识别各种资产类别上的利润机会,让您能够自信地做出明智的决策。 配备用户友好的界面,F-16 飞机指标与热门的 MetaTrader 4 平台无缝集成,确保交易过程顺畅高效。无论您是初学者还是经验丰富的专业人士,该指标都可以轻松定制,以符合您独特的交易风格和偏好。 感受 F-16 飞机指标的威力,它以精确和敏捷的方式驾驭市场趋势。其先进的图表功能使您能够始终领先,检测关键的入场和出场点以实现最佳时机。掌控您的交易之旅,并凭借 F-16 飞机指标释放稳定盈利的潜力。 准备起飞,以这款出色的 MT4 指标将您的交易表现提升到新的高度。F-16 飞机指标是您在金融市场世界中的终极副驾驶员,让您以速度、精确度和自信取得成功。
BlueDigitsFx Easy 1 2 3 System
Ziggy Janssen
4.87 (299)
MT5 版本下载链接: https://www.mql5.com/en/market/product/50048 Telegram 频道和群组: https://t.me/bluedigitsfx V.I.P 群组访问: 发送任何付费产品的付款证明到我们的私信 推荐经纪商: https://bit.ly/BlueDigitsFxStarTrader BlueDigitsFx Easy 123 系统 — MT4 强大的反转和突破检测指标 一款适合新手和专家交易者的全能非重绘系统,用于识别市场反转和突破。 BlueDigitsFx Easy 123 系统通过直观的图形和提醒信号,帮助您轻松识别市场结构变化、突破和趋势反转。 该指标遵循“123”模式: 步骤 1: 在潜在的疲劳点,通过大箭头标示新的高点或低点 步骤 2: 当结构被突破时,发出信号,确认可能的趋势反转 步骤 3: 通过小箭头和支撑/阻力点确认入场时机 注意: 大箭头在当前K线收盘前可能会重绘(因实时监测结构变化)。 小箭头一旦出现,100% 不会重绘。 主要功能 大箭头:识别强烈的结构转变,提示潜在反转 小箭头:10
Advanced Supply Demand
Bernhard Schweigert
4.91 (296)
现在优惠 33%! 任何新手或专业交易者的最佳解决方案! 该指标是一款独特、高质量、且价格合理的交易工具,因为我们已经整合了许多专有功能和新公式。 依据此更新,您将能够显示双重时间帧区域。 您不仅可以显示一个较高的时间帧,还可以同时显示图表时间帧,加上更高的时间帧:显示嵌套时区。 供需双方所有交易者都会喜欢它。 :) 重要信息披露 高级供需的最大潜力,请访问 https://www.mql5.com/zh/blogs/post/720245   想象您的交易如何得以改善,是因为您能够精准定位入场或目标位吗? 构建于新的底层算法,它可以更轻松地识别出买卖双方之间的潜在失衡。 这是因为它以图形方式展示供需最强劲区域,及其过去的表现(显示旧区域)。 这些功能旨在帮助您更轻松地发现最佳入场区域和价位。 现在您可以针对您的交易品种和时间帧来优化和编辑区域强度! 高级供需指标适用于所有产品和时间帧。 它是一个新的公式,非常新的功能是两个区域强度函数可由用户输入进行调整! 这在交易中是一大优势。 当您学习如何使用专有功能,例如带有价格游离最小 X 因子的区域强度时,您能够判断该区域强劲与否。 供需
TPSpro RFI Levels
Roman Podpora
4.85 (27)
俄语说明 /  英文 说明   -  MT5 版本 主要功能: 显示卖家和买家的活跃区域! 该指标显示所有正确的买入和卖出的初始脉冲水平/区域。当这些水平/区域被激活时,即开始寻找入场点的位置,水平线会改变颜色,并填充特定颜色。此外,还会显示箭头,以便更直观地了解情况。 LOGIC AI - 激活模板时显示用于搜索入口点的区域(圆圈) 为了提高视觉清晰度,添加了使用人工智能搜索入口点的显示区域的功能。 显示更高时间范围内的级别/区域(MTF 模式) 新增使用更高时间间隔显示级别/区域的功能。此外,该指标还具有自动趋势检测功能 (   TPSproTREND PRO   )。 独立的专业分步交易算法 该算法专为顺势和逆势的日内交易而设计。每个活动模板均提供详细的说明。 适用于不同的时间范围 TPSpro RFI 水平指标可用于图表上的任何时间间隔,从分钟(M1)到每月(MN)。 图形和声音警报 该指标提供图形和声音提示,让您不会错过交易信号。 此外,还支持手机通知。 简单有效的活性模板扫描器 这是一个非常紧凑的主动模式扫描仪,当在一个方向上的所有时间间隔内激活模式时,它会自动发出警报并
FX Volume
Daniel Stein
4.63 (38)
FX Volume:从经纪商视角洞察真实市场情绪 简要概述 想要提升您的交易策略? FX Volume 可提供零售交易者和经纪商的持仓实时数据——远早于诸如 COT 之类的延迟报告。不论您希望获得持续稳定的收益,还是想在市场中多一分制胜的砝码, FX Volume 都能帮您识别重大失衡、确认突破以及完善风险管理。立即开启体验,让真实的成交量数据为您的交易决策带来革新! 1. 为什么 FX Volume 对交易者格外有用 极具准确度的早期预警 • 快速捕捉有多少交易者正在买入或卖出某个货币对——比大多数人提前一步。 • FX Volume 是 唯一 能够整合多家零售经纪商真实成交量数据并以简洁方式呈现的工具。 强力风险管理 • 及时识别多头或空头仓位的巨大不平衡,这往往预示着潜在的趋势反转,帮助您更自信地设置止损和目标位。 • 独家而真实的数据让每一次交易决策更具可靠性。 优化进场与出场点 • 发现“过度集中”的交易(大多数交易者都在同一方向),并通过真实成交量来确认突破。 • 避免依赖常见指标可能带来的误导信号,而是利用真实的实时成交量。 适配各种交易策略 • 将 FX
PRO Renko System
Oleg Rodin
5 (30)
PRO Renko Arrow Based System for trading renko charts.  准确的信号交易任何外汇工具. 另外,我将免费提供系统的附加模块! PRO Renko系统是RENKO图表上高度准确的交易系统。该系统是通用的。 该交易系统可应用于各种交易工具。 该系统有效地中和了所谓的市场噪音,打开了获得准确反转信号的通道。 该指标易于使用,只有一个参数负责产生信号。 您可以很容易地使算法适应您感兴趣的交易工具和renko酒吧的大小。 我很乐意通过提供任何咨询支持来帮助所有客户有效地使用该指标。 祝您交易成功!购买后,立即写信给我! 我将与您分享我的建议和我的renko发电机。 另外,我将免费提供系统的附加模块!
作者的更多信息
BB Classic
Stefan Stoyanov
4 (1)
Automated medium-term Expert Advisor. It is based on Bollinger Bands . The EA is optimized for EURUSD H1 . The robot should be optimized for use on other instruments. The Expert Advisor does not use hedging, martingale, grid, arbitrage etc. The results obtained in the strategy tester are identical to the results of real trading. Since the results for Control points are close to results of optimization in every tick mode, the EA allows for quick optimization using Control points . Parameters Mod
FREE
Maggi
Stefan Stoyanov
1 (1)
Fully automated and safe medium-term multicurrency trading robot based on a strategy consisting of several standard indicators. The LockerStop parameter activates the virtual protective stop logic. If LockerStop is not zero, and the loss of an open positions is greater than LockerStop , the EA opens an opposite protective position. The closure of two positions is based on interval virtual stop logic. It is recommended to use the H1 timeframe and the following currency pairs: EURUSD and GBPUSD. C
FREE
BB St Dev
Stefan Stoyanov
BB St Dev BB St Dev類似於布林線指標。 布林通道的上部和下部通過iStdDev計算。 iStdDev是МetaТrader4的標準指標。 移動平均線具有特殊的平滑算法。 設置      M - 移動平均線的周期      BandsDeviations參數 - 通道生成因子。 除了經典的布林帶外,BandsDeviations在這裡可以擁有任何價值。      Visio參數          如果Visio = False,則此指標將與布林帶指標一致。          如果Visio = True,此指標將顯示可能的訂單開倉點。 如何配置此指標      選擇:圖表=>指標列表=> BB和St Dev =>編輯。      將出現指標窗口。      設置參數。      創建模板:Charts => Template => Save Template。 Qiūjì zhékòu 50%=> 75 $ jǐn xiàn 35 měiyuán BB St Dev BB St Dev lèisì yú bù lín xià
Knight
Stefan Stoyanov
1 (1)
This indicator shows the market entry and exit points. It is good for both beginners and professional traders. The product works on any timeframe and financial instrument. The indicator is designed for scalping. It does not redraw. It is based on the divergence between two moving averages, which have a special smoothing algorithm. The first moving average is colored in Magenta . It indicates the general movement of the trend. The second moving average is colored in LawnGreen . It appears on the
Auto Pr
Stefan Stoyanov
This trading system ( Multi scalper EA) uses no indicators. The EA tracks positive and negative tick movements in real time. The program calculates the difference between highest and lowest price deviations and averages the results. If the averaging result exceeds price_slippage , it is replaced with the calculated value. If the tick volatility increases, then the value of price_slippage is also expected to rise. The EA calculates the differences between positive and negative price movements and
Merlin
Stefan Stoyanov
指標的算法基於價格被緩慢移動平均線吸引的事實 這同樣適用於在緩慢移動平均線附近移動的快速移動平均線 這些移動平均線具有特殊的平滑算法。 當快速移動平均線上升且低於慢速移動平均線時,我們有一個潛在信號可以開倉 - 買入 當快速移動平均線下降並且高於緩慢的移動平均線時,我們有一個潛在的信號來開倉 - 賣出 白色和藍色圓點表示市場潛在退出的位置 如果該點為白色 - 這是買入退出的建議。 如果該點為藍色 - 這是賣出退出的建議。 紅色鑽石標誌著潛在的止損 適用於所有儀器和圖表。 您可以同時使用許多工具。 指示燈不會覆蓋其信號 設置 條形數組的條形大小來計算指標 P期快速移動平均線 M期緩慢移動平均線 模式模式選項 如果mode = true,則可以在圖表上看到潛在的止損點 如果mode = false,則圖表上不會顯示潛在止損。 如何設置指標? 在圖表上運行指標 從終端窗口中選擇:Charts => Indicators List => Merlin => Edit 將出現在指標窗口中 配置設置 畢竟,創建一個模板:Charts => Template => Sa
筛选:
ekmql
194
ekmql 2021.06.26 20:20 
 

should have an alert to the cell phone with configurable level

AdamSnailham
75
AdamSnailham 2021.06.04 07:16 
 

I found it useful on a 4 hour charts to see the best time to trade with good volume.

回复评论