See the right pair
- 指标
- 版本: 1.0
- 激活: 5
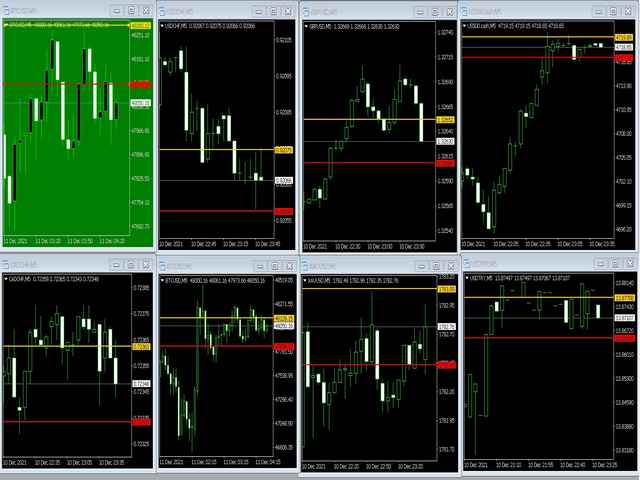
特别是如果您一次查看大量图表,您很容易错过价格走势的开始。该指标可帮助您根据汇率是否在某个范围内或离开该范围来更改图表的颜色。试想一下:例如,您有 30 个黑色图表,其中 1 个变为绿色。你一定要注意!
用法:将指标拖到图表上,设置所需的背景颜色,通过设置“向下”和“向上”线定义所需的波段。准备好!
跟着我!我定期放置新项目。
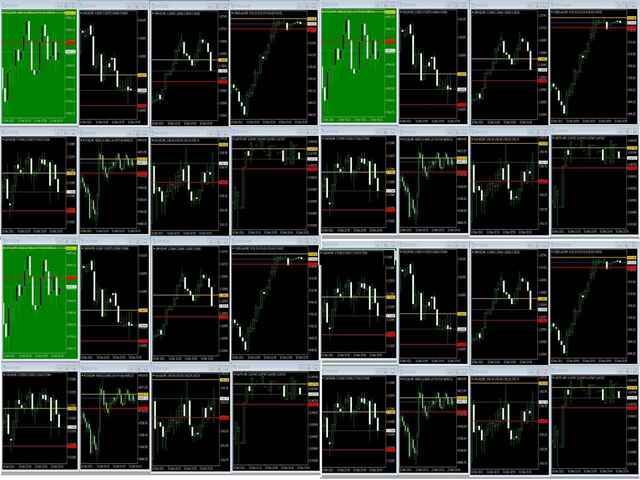
特别是如果您一次查看大量图表,您很容易错过价格走势的开始。该指标可帮助您根据汇率是否在某个范围内或离开该范围来更改图表的颜色。试想一下:例如,您有 30 个黑色图表,其中 1 个变为绿色。你一定要注意!
用法:将指标拖到图表上,设置所需的背景颜色,通过设置“向下”和“向上”线定义所需的波段。准备好!
跟着我!我定期放置新项目。