Trend Scanner Xtra
- 指标
- 版本: 2.0
- 更新: 3 十一月 2021
- 激活: 5

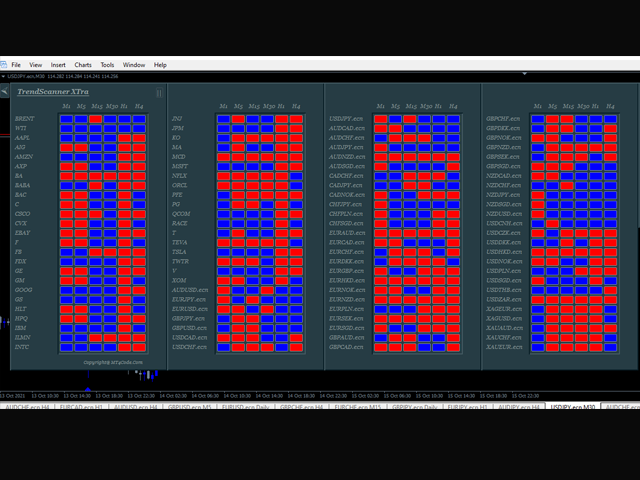
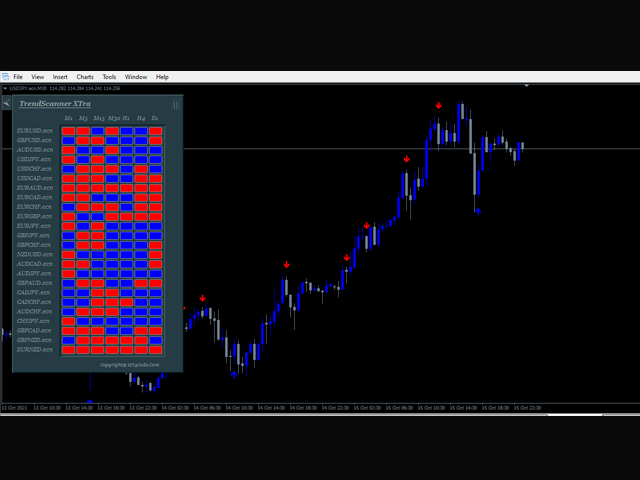
TrendScanner XTra scans market trends from Multi Symbols and Multi Timeframes with extra additional Entry Point Signals arrow on the current chart.
Features:
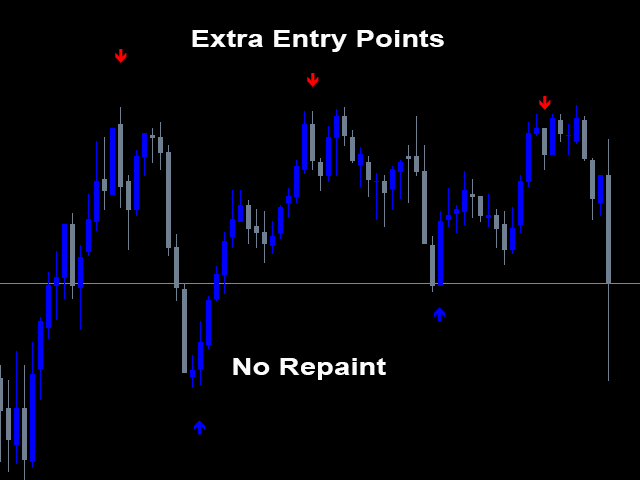
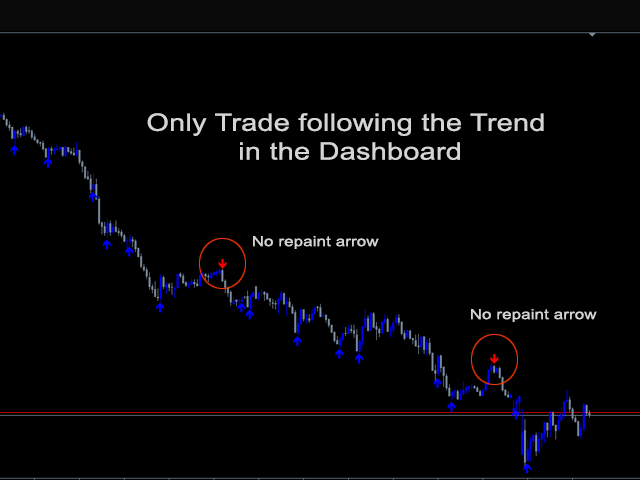
-Entry Point SIgnals : This is additional feature in the indicator. No repaint arrows. The Trading system in the single indicator. MTF Trend informations and Entry Signals. In order to make it easier for trader to get trading moments from a single chart and deciding entry time.
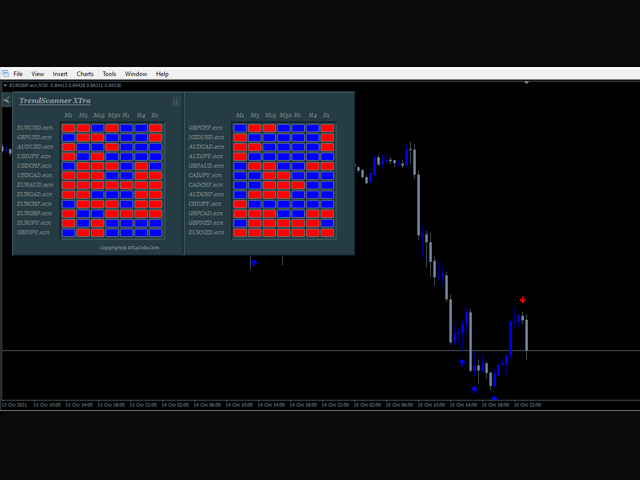
-Changeable Panel Display : Change the value of Max.Symbols/Panel and the indicator will adjust the dashboard display according to your input
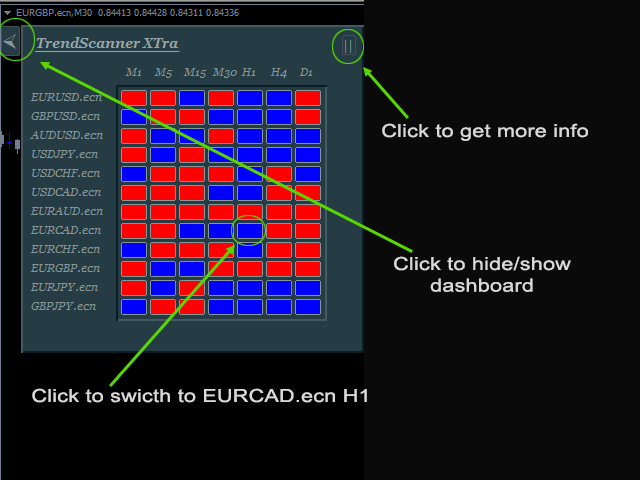
-Clickable Boxes: Click on the boxes to open appropriate Symbol and Timeframe. See image and video
- Hide/Show Dashboard: You can hide/show dashboard on the chart. In case you have some indicators in your chart and want to see them without being hindered by the dashboard then hide it. See button on the top left of the dashboard.
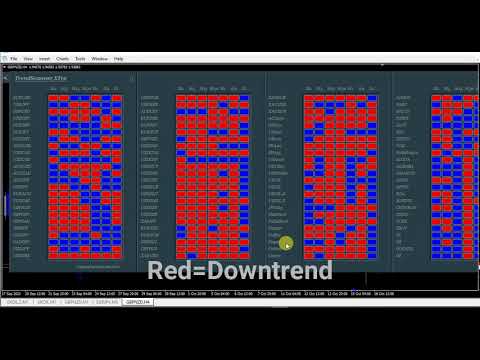
- Changeable color: If your setting , BUY color =Blue and SELL color = Red . Then Red color Boxes mean price in the appropriate symbol and timeframe is currently Downtrend and Blue is Uptrend. Red Arrows means SELL signals and Blue arrows means BUY signals.
Parameter Setting
- Max.Symbols/Panel = You can define the total symbols/panel here. the indicator will adjust the dashboard display according to your input.
- Trend Period=The Period of scanned Trend
- Trend shift= This is bar shift where the Trend will be scanned. Shift value is counted from right to left (Last to Past). And starting from value 0 that is current bar.
- Show Entry Point = If true, Indicator will draw Entry Point Arrows in the current chart otherwise false to hide arrows.
- Arrow Width = Arrow width
- BUY Color = The color of Entry Point BUY signal arrows and Uptrend boxes in the panel.
- SELL Color = The color of Entry Point SELL signal arrows and Downtrend boxes in the panel.
- Scan All Symbols selected in Market Watch = If true, Indicator will ignore symbol inputs and scan all symbol in the market watch otherwise false.
- Scans Symbols= If Scan All Symbols selected in Market Watch =false, define symbols input here. Separated by comma.
- Symbol Prefix= This is the characters before symbol if available otherwise leave it blank
- Symbol Suffix= This is the characters after symbol if available otherwise leave it blank. Example : EURUSD.ecn then you can fill in the column “.ecn” without quotes.
- Scan All Timeframes = If true, Indicator will ignore Timeframe inputs and scan all timeframe from M1-Monthly, otherwise false and define timeframe below
- Scans TimeFrames= If Scan All Timeframes = false, define timeframes input here.
- Entry Point Alert = Alerts for Entry Point Signal Arrows
- Minimum Total TFs to alert/symbol = Indicator will alert only if minimum total TFs is reached.
- PopUp Alert = If true and price is oversold or overbought, Indicator will Alert on the chart, otherwise false.
- Mobile Alert = If true and price is oversold or overbought, Indicator will Alert on the mt4 mobile platform, otherwise false.
- Email Alert = If true and price is oversold or overbought, Indicator will send email, otherwise false.
How to Trade
- Define Trading Timeframe
You decide the trading timeframe . Recommended Timeframe M5 and above.
Example :
Video - Finding Trend Setup
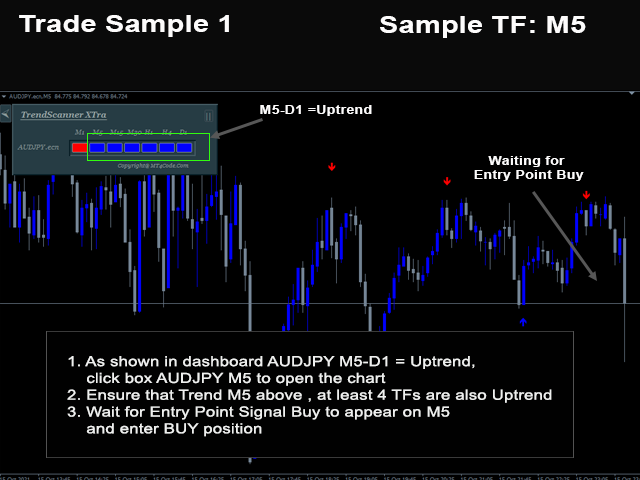
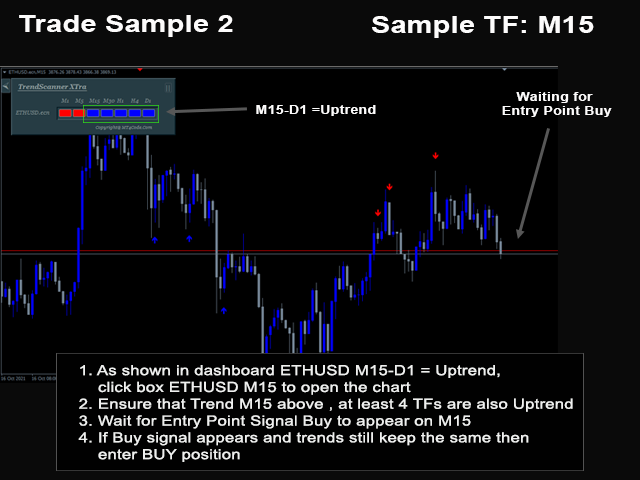
Eg.You want to trade on TF M5. At least 4 consecutive timeframes starting from M5 and above should have the same trends.
- Waiting for Entry Point
Open timeframe and symbol where you find proper trend setup in Point 2 above . Click box on the dashboard to switch the chart.
- Eg. BUY order , see that the last arrow is BUY arrow
- Confirm OverSold/Overbought
For BUY, at least 1 timeframe below trade timeframe is oversold. And Timeframes above Trade TF are not overbought.
Example :
BUY on TF M5. Then M30,H1 and H4 are not currently Overbought. And M1 is currently Oversold.
SELL on TF M5. Then M30,H1 and H4 are not currently OverSold. And M1 is currently overbought.
Waited for all 5 TF in the dashboard were the same color + got the arrow confirmation...20 trades...all losses. Money wasted with this...
Thanks for your review. Are you sure you understand and follow the rules? 20 trades and all losses, it sounds not make sense. Many traders already used it (It's not only sold here) and mostly they provide good feedback. Notice that the exit target is also important, It depends on the Trading TF and the current market condition. Good luck!