Moving Wizard Mt5
- 指标
- 版本: 1.0
- 激活: 5

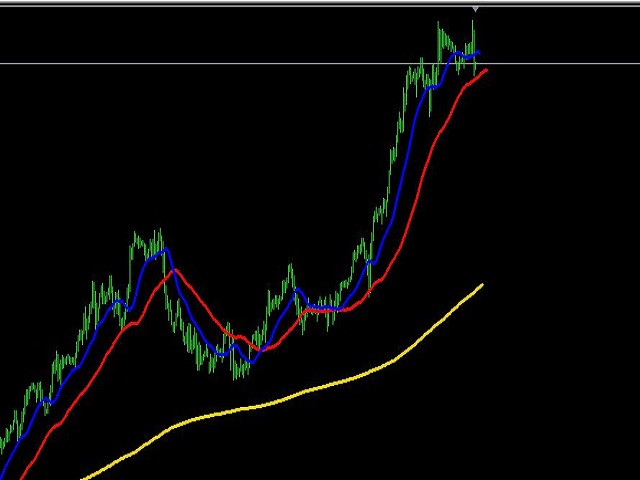
Moving Wizard indicator will guide you to work with Trend and give pure Entry point depending on crossing on the chart it work on all currency and all Timeframe you can use it daily or scalping or swing its good with all and This indicator you can make it your strategy i work on it on H1 Timframe and make a good money you can take alook on it and you see a great resault on chart
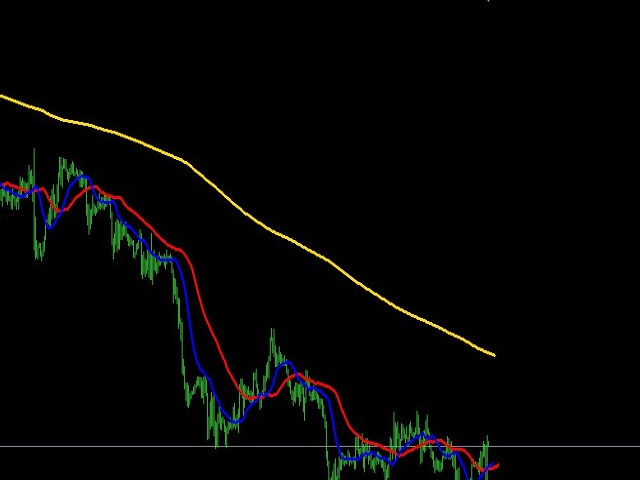
.Gold moving is to Know the Trend of price other moving below it mean we looking to sell orders . if above it we looking for a Buy orders
.Red and Blue we wait across happen to take an entry point and we already know the Direction from Gold moving
we take an order when Blue Moving cross Red moving