All TimeFrames PSAR MT5
- 指标
- 版本: 4.6
- 更新: 19 十一月 2021
- 激活: 5

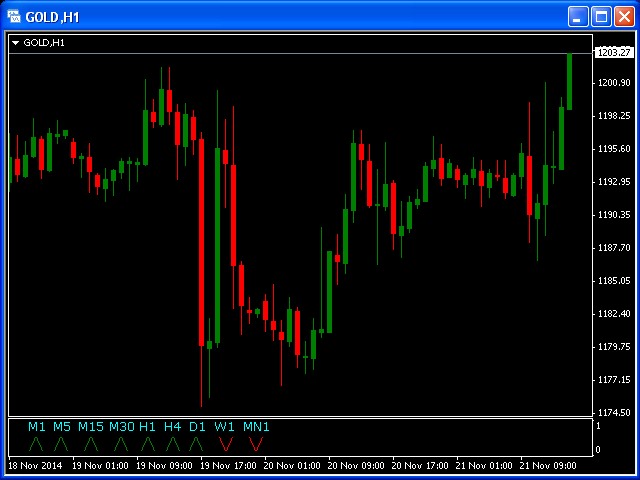
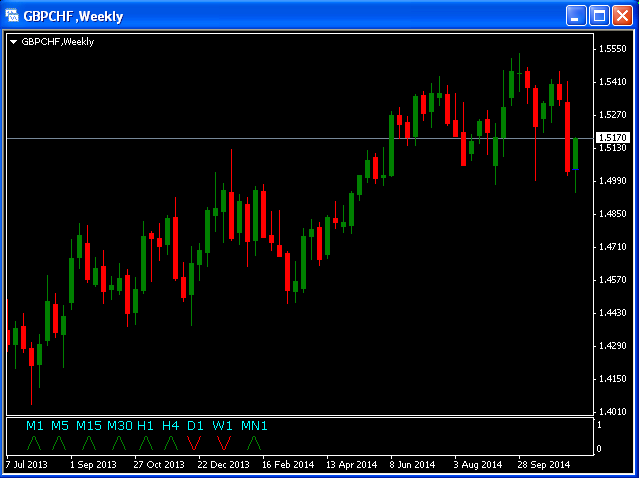
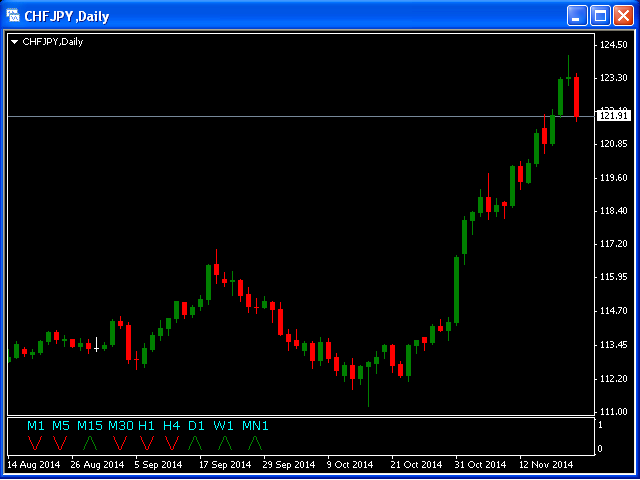
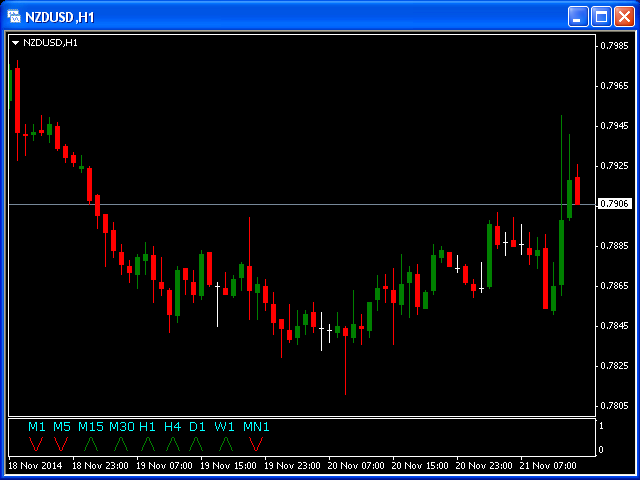
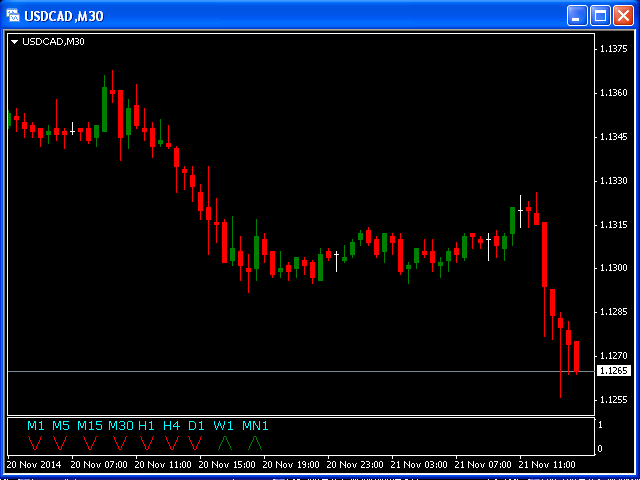
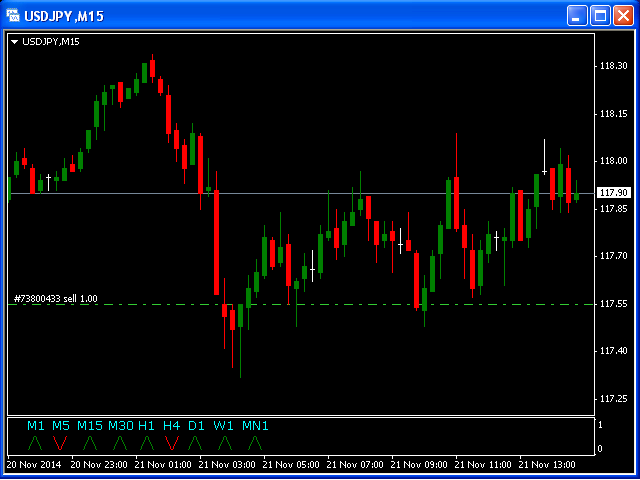
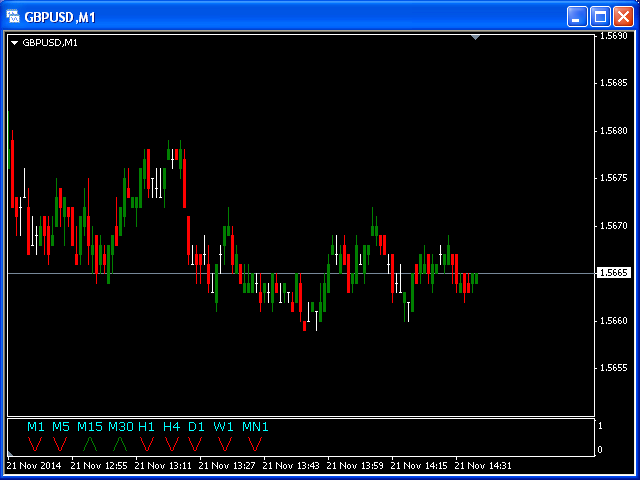
This indicator is based on the classical indicator Parabolic SAR and will be helpful for those who love and know how to use not a visual, but digital representation of the indicator. All TimeFrames PSAR MT5 indicator shows values from each timeframe (M1, M5, M15, M30, H1, H4, D1, W1 and MN1).
You will be able to change the main input parameters for each Stochastic from every TF.
Example for M1:
- sTF1 = M1
- pStep1 = 0.02
- pMax1 = 0.2