Tick Volume Chart
- 实用工具
- 版本: 3.3
- 更新: 25 二月 2021
- 激活: 20

Tick Volume Chart — fixed volume bars for MetaTrader 4.
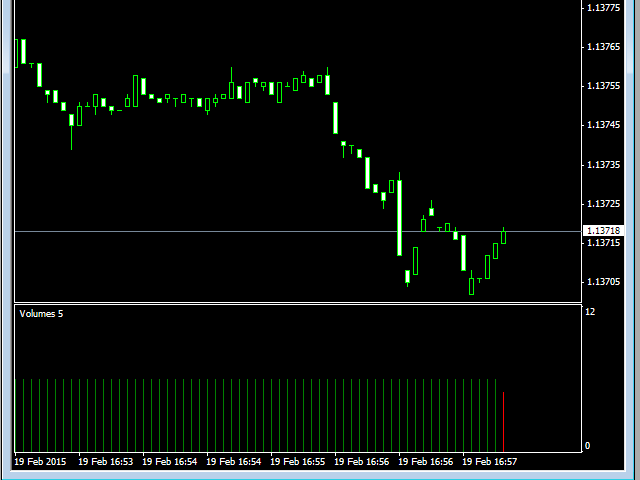
The tool creates charts on which each candle has a fixed tick volume. Data sampling is carried out not by time but by the tick volume. Each bar contains a given (fixed) tick volume. Tick volume can be adjusted by changing the value of the Volume parameter. You can apply indicators, Expert Advisors and scripts to the tick chart. You get a fully functional chart, on which you can work just as well as on a regular chart.
In the process of work, history accumulates. If necessary, you can reset (delete the accumulated history). It is useful in the formation of the chart with a different tick volume. To perform a reset, delete a global variable having the name of the appropriate trading tools. There is a special window in terminal that manages global variables. It can be opened by execution of the "Tools — Global Variables" menu command or by pressing F3.
At the same time the data is updated synchronously with the basic chart with no delays.
You can simultaneously create several charts.
Inputs
- Volume — tick volume.
- Chart — timeframe for a chart opened in a separate window. In case you are going to work with a single chart for the currency pair, the timeframe is irrelevant. Timeframe does not affect the calculations during the chart creation. This setup is created to open several charts for the same currency pair, but with different settings. In such case, different timeframes for each chart (for example, M2, M3, M4) should be set. You also need to set different timeframes when simultaneously running the Tick Volume Chart indicator and other tools that generate a synthetic chart on the same currency pair.
Launch
- Open the "Navigator" window.
- Find the "Tick Volume Chart" and drag it to the desired chart (any timeframe).
- Open the resulting chart by clicking the corresponding "Open chart" button.

























































really very good product for those who want to be precise in their entry and exit, or for scalpers