EchoIndicatorMT4
- 指标
- 版本: 1.1
- 更新: 29 三月 2020
- 激活: 5

ECHO INDICATOR V2.2 Update
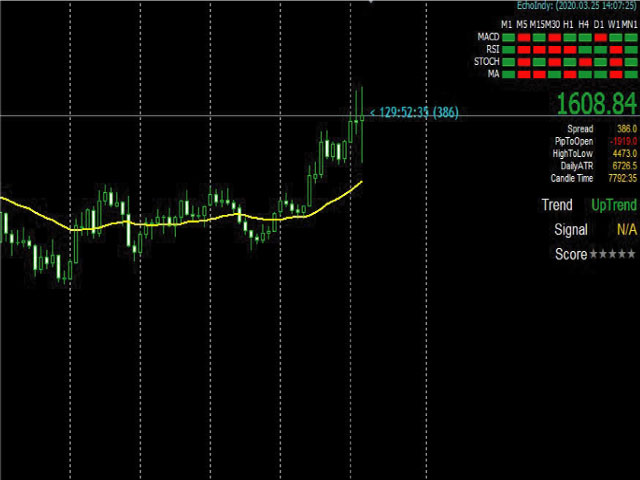
A top-quality indicator works with trend and pattern. The
tool is a good assistant for the traders use various levels in trading.
When price approaches a level, the
indicator produces a sound alert and (or) notifies in a pop-up message, or via push notifications.
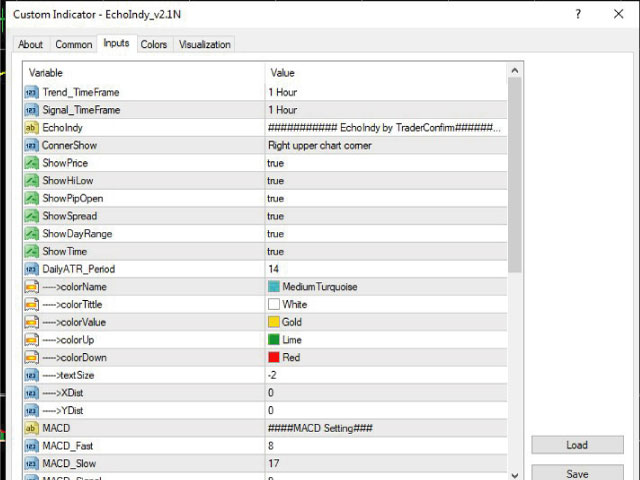
- A great decision making tool for opening orders.
- Can be used any timeframe and can be customized
- Easy to trade
- It implements alerts of all kinds
- It implements a multi-timeframe
- Trade with Trend + signal + Weight
Update :
- The standard of telling trend
- Updated conjugation variables in determining
- Solve the problem of showing values later than time.
- Improve the method of notification notification to be more accurate.
- etc.