Magic Pivot is a professional indicator for finding the support and resistance lines; it has been developed by a group of professional traders. The indicator plots three support lines and three resistance lines, where a price reversal is highly probable. Magic Pivot is an excellent tool for scalping and intraday trading. Advantages
High accuracy of signals. Suitable for scalping and intraday trading. The indicator does not redraw. Simple indicator setup, minimum parameters. Works on any financ
CRT Candle Range Theory HTF MT4. Ultimate CRT Indicator: Advanced ICT Concepts and Malaysian SnR Trading System Master the Market Maker's Footprints with the Most Advanced Candle Range Theory Indicator Unlock the true power of Smart Money Concepts (SMC) and trade precisely like the institutions with the Ultimate CRT Indicator . Built exclusively for serious traders, this indicator automates the highly effective Candle Range Theory (CRT) , a core pillar of ICT Concepts (Inner Circle Trader
Supplement for Alpha Trend Spotter (ATS) Indicator: https://www.mql5.com/en/market/product/8590 This indicator acts by price action. Use it when ATS shows clear Bullish or Bearish Trend for finding the strongest trend each day. Suitable for timeframes M5, H1, H4 and D1. Suitable for Binary Option 5 minutes signal. How to Use: RED Arrow means Sell
GREEN Arrow means Buy
Trend based indicator
Identify trends with this indicator
A simple-to-use trend indicator
No complicated settings
Attributes: Can be used in all symbols Can be used in all time frames Relatively high signals No complicated settings Specific to the trend Lifetime support
Settings: Alarm Show Alert: By activating these settings, after receiving the signal, you will receive an alarm in Metatrader
Alarm Show Notification: By activating these settings, after receiving the signal, you will receive a
Indicator. "Indicator wave or Indicator Ma".
Using 23 standard indicators and the author's algorithm, the levels of purchases (from 0 to +100) and sales (from 0 to -100) are calculated.
Then, using the calculated levels, the "Wave Indicator" draws a wave with 21 moving averages.
The wave number is equal to the averaging period of the calculated levels.
Waves # 1 - 7 Fast Moving Averages
Waves from No. 8 -14 moving averages
Waves from No. 15-21 slow moving averages
Looking at the figures drawn
Your Good Friends — this is not just an indicator, but your reliable trading assistant, designed for traders who value simplicity, clarity, and stability. It combines the best classic methods of technical analysis — support and resistance levels, reversal signals, visual cues — and presents them in the clearest, most user-friendly format possible. Suitable for both beginners and experienced traders — especially those who want to eliminate chaos, reduce stress, and trade based on clear signals.
If you are good at trading at levels This indicator is all you need levels to manage your trades Market is usually follow current trend when break out some levels or reverse
Trade at the Institutional traders level with the best supply and demand zone indicator available in MT4 and MT5 The Secret Profit Levels Signals indicator for MT4 is a complete trading system that provides traders with the entry price and 2 take profit levels. Technical analysts use support and resistance levels to identi
GTAS FidTdi is a trend indicator using combination of volatility and potential retracement levels. This indicator was created by Bernard Prats Desclaux, proprietary trader and ex-hedge fund manager, founder of E-Winvest.
Description The indicator is represented as a red or green envelope above or under prices.
How to use Trend detecting When the envelope is green, the trend is bullish. When it is red, the trend is bearish.
Trading Once a trade is opened, GTAS FibTdi shows retracement zones wh
Title: Best Trend Sniper Indicator - A Custom MQL4 Indicator for Spotting Potential Trends Description: Indicator Name: Best Trend Sniper Indicator Introduction: The "Best Trend Sniper Indicator" is a custom Meta Quotes Language 4 (MQL4) indicator designed to identify potential trends in financial markets. This indicator is intended to be used on Meta Trader 4 (MT4) trading platforms. Key Features: Non Repaint: The Best Trend Sniper Indicator is a non-repaint indicator, which means it does not
The First Dawn indicator uses a unique mechanism to search and plot signals.
This keeps searching for signals, making it a great indicator for scaping and identification of changes in direction, swing trading and trend trading.
The First Dawn helps you get early signals. The backtest gives the true picture of how the indicator works with real/demo accounts.
Although this is a tiny indicator it is packed with advantageous settings that will help you whether you desire to: Snap the Peaks and
Overview Happy Kangaroo is a trend-following tool designed to identify market direction and provide high-probability entry signals based on volatility. By combining price action with the Average True Range (ATR), it visualize a dynamic support and resistance level of the price. Key Features The indicator's power lies in its customizable parameters and mathematical precision: Dynamic Trend Detection: Uses the ATR period and factor to calculate the volatility bands. It identifies an Uptrend
Indicator. Zones of support and resistance levels The most reliable tool in the hands of any technical analyst is support and resistance levels.It is these levels that magically work in the market, because the price then bounces off them, on the contrary, gaining maximum acceleration, punching them and striving for a new price point.However, in practice, many beginners face enormous difficulties in building them.This is due to the fact that the price may react quite differently to them, and ofte
Overview Automated smart money market structure identification following smart money concept and inner circle trader concept, it gives an unprecedented edge on your smart money and market structure analysis by automatically identifies valid market structure using smart money concept: Identify impulsive and corrective moves Identify valid pullbacks built by impulsive and corrective market moves Idenitfy bearish or bullish leg and their inducements for smart money concept Identify valid market st
Indicator FiboZag - transfer the indicator to the chart and the Fibonacci levels will be built automatically on the last ZigZag turn. The main advantage lies in the correct construction of Fibonacci levels and markup of price levels. Simple, visual and effective use. The indicator is not redrawn and does not lag. Works on all currency pairs and on all timeframes.
ROC acceleration-deceleration is the manual system for medium-term scalping. Indicator based on custom ROC system which defines bullish/bearish market and especially acceleration-deceleration of tendention in the market's main direction. Buy arrow is plotted during bearish market when current trend decelerates and sell arrow is plotted during bullish market when current trend decelerates. Main Indicator's Features Signals are not repaint,non-late or disappear(exept cases when system recalculat
Contact me after payment to send you the User-Manual PDF File.
Triangle Pattern
Sometimes the price cannot make higher highs or lower lows and it moves in a converging price range and waves are shorter than before until the movement creates a geometric shape of a symmetrical triangle, which indicates It is maybe the end of the trend. The triangle pattern is a well-known in forex and the trading plan and strategy of many traders is based on it.
The Triangle Pattern Scanner Indicator It is usu
The indicator shows the potential trend direction by cyclical-wave dependence. Thus, all the rays of the intersection will be optimal rays, in the direction of which the price is expected to move, taking into account the indicator period. Rays can be used as a direction for potential market movement. But we must not forget that the approach must be comprehensive, the indicator signals require additional information to enter the market.
Channel Notifier is a universal indicator, which can plot different types of channels with the ability to send notifications about the channel breakouts. A breakout can be registered based on different rules, such as the price directly reaching a new level, a bar closing beyond the channel, the whole bar being outside the channel, etc. The notifications can be configured as alerts in the MetaTrader terminal, or as push notifications to mobile devices.
Input parameters
Indicator - type of the i
WPR by Profile, or WPR for Professionals Geo_WprPro is one of the well-known currency profile indicators. It simultaneously displays two WPR indicators with different parameters in the matrix form on all timeframes of multiple currency pairs forming the currency profile . As follows from the description, " WPR is a leading indicator that often goes ahead of the price chart. The oscillator frequently reaches extreme values before the price reversal as if anticipating that event: it almost always
Place the indicator on the chart, preferably with a timeframe of H1 or H4. If you are trading in the daily range or, conversely, on lower timeframes, you will need to adjust the RSI and ATR levels accordingly.
The blue arrows of the indicator will be a signal to open a long position, the red arrows will be a signal to open a short position:
1) Blue arrow for longs (growth) and red arrow for shorts (decline).
2) Two horizontal lines for current positions (one for entry and one for stop).
3
Trend formation channel is a set of lines. The two central lines of the indicator represent moving averages of the specified type and period, they also form a small channel. The large channel is formed - the central lines of the indicator plus / minus the standard deviation estimate, multiplied by the coefficient selected by the user. The basic rule for plotting is that about 5% of prices should be outside these lines, and 95% - inside. If the price crosses the upper or lower line too often, th
Prop Firm Sniper MT4 is a professional market structure indicator that automatically identifies high-probability BUY and SELL opportunities using BOS and CHoCH analysis.
Recommended Timeframes: For backtesting, use the indicator on M5 or M15 for Gold (XAUUSD), and M15 or H1 for more volatile Forex pairs such as GBPUSD, USDJPY, EURGBP , and similar markets.
CONTACT ME AFTER PURCHASE TO CLAIM YOUR FREE BONUSES!
Prop Firm Sniper is a professional market structure indicator designed t
Neuro Poseidon is a new indicator by Daria Rezueva. It combines precise trading signals with adaptive TP/SL levels - creating best possible trades as a result! Message me and get Neuro Poseidon Assistant as a gift to automize your trading process!
What makes it stand out?
1. Proven profitability on all assets and timeframes
2. Only confirmed BUY and SELL signals present on the chart
3. Adaptive TP & SL levels generated by the software for each trade
4. Easy to understand - suitable for all
Please contact us after your purchase and we will send you the complimentary indicators to complete the system Cycle Sniper is not a holy grail but when you use it in a system which is explained in the videos, you will feel the difference. If you are not willing to focus on the charts designed with Cycle Sniper and other free tools we provide, we recommend not buying this indicator. We recommend watching the videos about the indiactor and system before purchasing.
Videos, settings and descri
Gold Pro Scalper
Precise entry points for currencies, crypto, metals, stocks, indices! Indicator 100% does not repaint!!!
If a signal appeared, it does not disappear! Unlike indicators with redrawing, which lead to loss of deposit, because they can show a signal, and then remove it.
Trading with this indicator is very easy.
Wait for a signal from the indicator and enter the deal, according to the arrow
(Blue arrow - Buy, Red - Sell).
I recommend using it with the Trend Filter (download
Gold Signal Swing Pro XAUUSD with Auto TP SL (MT4) — 7层过滤器 + RR保证系统的XAUUSD摆动交易完整系统 无重绘。无重画。无延迟。所有信号在确认后锁定。 买家奖励:购买现货许可证可免费获得AI Zone Radar(价值$59)+ PDF手册。购买后在MQL5上向我发送消息。 AI Zone Radar: https://www.mql5.com/en/market/product/175834 MT5版本也已发售: https://www.mql5.com/en/market/product/170916?source=Site +Profile+Seller 在活跃的交易社区中被黄金交易者使用和信赖。专为精确度和易用性而构建。 这是为谁设计的 工作或生活太忙无法盯盘M5/M15的交易者 只想交易经过过滤的高质量信号的人 隔夜持仓或离开屏幕时持仓的交易者 想要每个信号获得更大波动的交易者(M30上$8-$25,H1上$15-$40,H4上$30-$150) 厌倦了猜测TP/SL设置位置的人 因低时间框架虚假信号而疲惫的交易者
Attention: beware of SCAMS, TRENDMAESTRO is only ditributed throught MQL5.com market place. note: this indicator is for METATRADER4, if you want the version for METATRADER5 this is the link: https://www.mql5.com/it/market/product/108106 TRENDMAESTRO ver 2.5 TRENDMAESTRO recognizes a new TREND from the start, he never makes mistakes. The certainty of identifying a new TREND is priceless. DESCRIPTION TRENDMAESTRO identifies a new TREND in the bud, this indicator examines the volatility, volumes a
PRO Renko Arrow Based System for trading renko charts. 准确的信号交易任何外汇工具. 另外,我将免费提供系统的附加模块! PRO Renko系统是RENKO图表上高度准确的交易系统。该系统是通用的。 该交易系统可应用于各种交易工具。 该系统有效地中和了所谓的市场噪音,打开了获得准确反转信号的通道。 该指标易于使用,只有一个参数负责产生信号。 您可以很容易地使算法适应您感兴趣的交易工具和renko酒吧的大小。 我很乐意通过提供任何咨询支持来帮助所有客户有效地使用该指标。 祝您交易成功!购买后,立即写信给我! 我将与您分享我的建议和我的renko发电机。 另外,我将免费提供系统的附加模块!
There is always a need to measure if the market is "quiet" or it is volatile. One of the possible way is to use standard deviations, but the issue is simple : We do not have some levels that could help us find out if the market is in a state of lower or higher volatility.
This indicator is attempting to do that : • values above level 0 are indicating state of higher volatility (=GREEN buffer) • values below level 0 are indicating state of lower volatility (=RED buffer)
脚本会在达到某个特定水平时将所有未结订单转移到收支平衡,如果您忘记了,则会在所有订单上设置止损,以免在您打开时(包括待处理的保证金)不冻结。
此外,脚本具有在反向ATS蜡烛上关闭订单的功能,具体取决于未完成的交易,M15或M5的选择,或者根本不自动关闭。
The script transfers all open orders to breakeven when a certain level is reached, puts stops on all orders if you forget, or so as not to bathe when you open, including on pending deposits.
Also, the script has the function of closing orders, on the reverse ATS candle, depending on the open transaction, the choice of M15 or M5, or not automatically close at all.
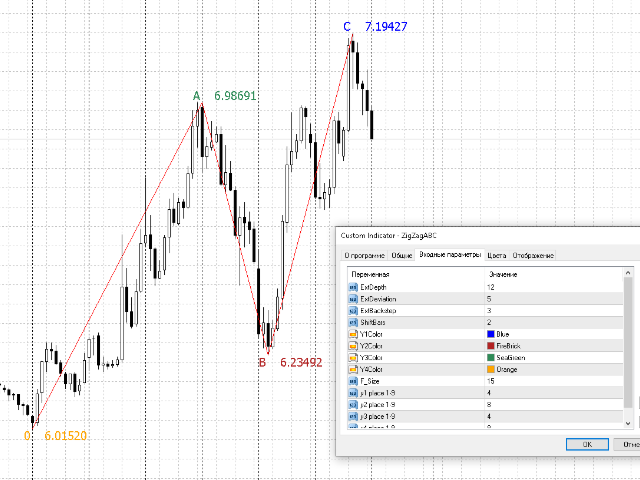
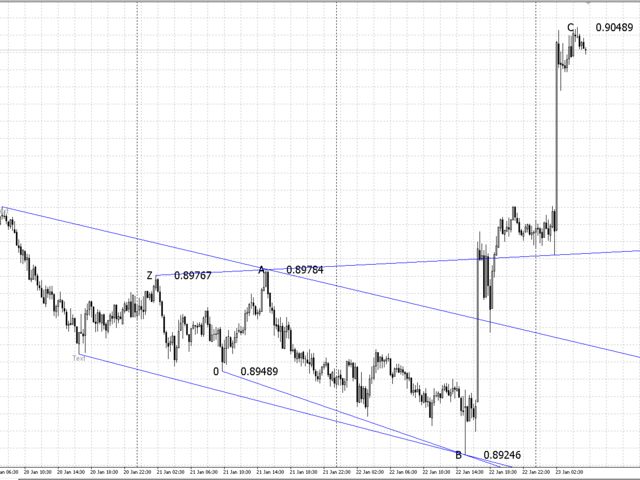
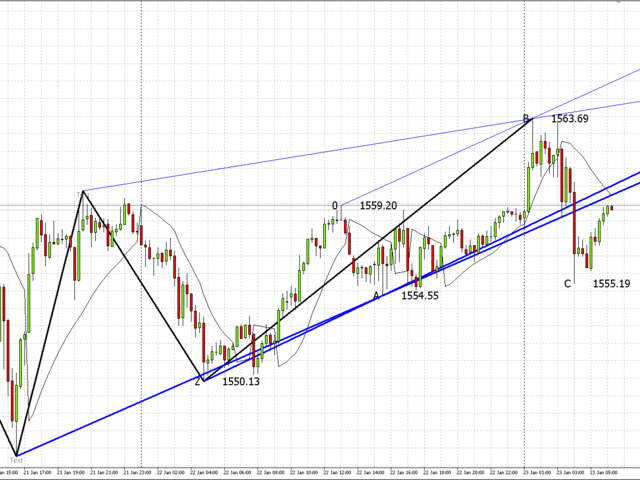
Another version of ZigZag with additional filters for drawing and finding peaks and lowlands. Well suited for manual trading, you can also use these peaks and lowlands for the adviser and calculate them. Also, all the functions of the original ZigZag remain. Additional filters are AO and Stochastic. Works on all instruments and timeframes.Works on all instruments and timeframes.
Pathetic in all ways and can't even get a refund ! Doesn't work, NO support to get answers as to why it doesn't and absolutely no documentation regarding the settings, some of which aren't even in English so difficult to have a guess at what they are or should be
Pathetic in all ways and can't even get a refund ! Doesn't work, NO support to get answers as to why it doesn't and absolutely no documentation regarding the settings, some of which aren't even in English so difficult to have a guess at what they are or should be