Macd Predictor
- 指标
- 版本: 1.2
- 更新: 30 一月 2020
- 激活: 5

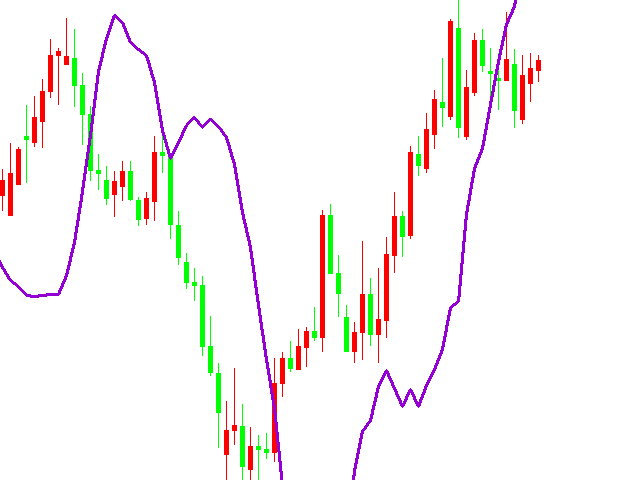
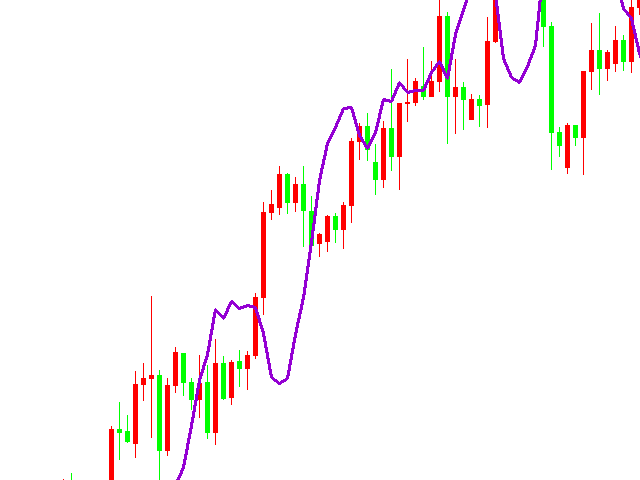
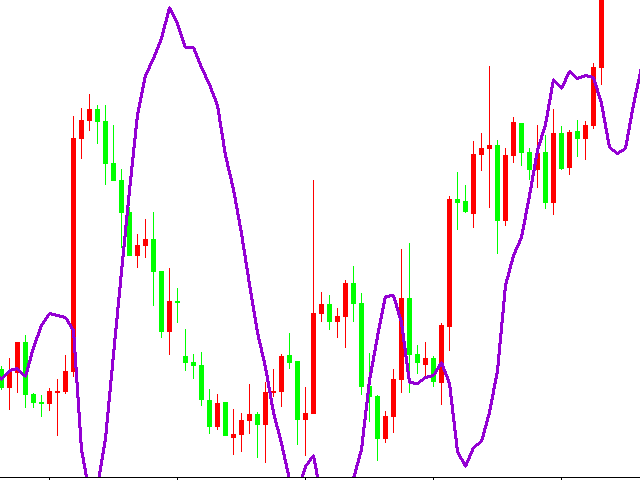
Macd 的主图指标
1.您可以提前一段确定MACD将从买入转为卖出的价格,反之亦然。它是振荡器预测器的表亲。如果你当时就知道一个仓位,那么确切的价格,当前和下一个(未来)柱将需要达到MACD交叉。在你的当前头寸受到下一个MACD交叉力量的帮助或阻碍之前,你还可以看到市场必须走的距离。您可以在所有时间范围内执行此操作,因为预测器会实时更新。
2.您可以通过MACD预测变量历史清楚地观察价格行为来确定市场上的“动态压力”,直接叠加在条形图上。动态压力是指市场对买卖信号的反应。如果你在MACD卖出30分钟并且市场持平,那么你就知道下一个买入信号很容易成为大赢家!这是我经常用标准的 MACD做的事情,但现在它更容易看到!
参数:
Fast EMA - period of the fast Moving Average.
Slow EMA - period of the slow Moving Average.
Signal EMA - period of the Signal line.