Macd Predictor
- 지표
- 버전: 1.2
- 업데이트됨: 30 1월 2020
- 활성화: 5

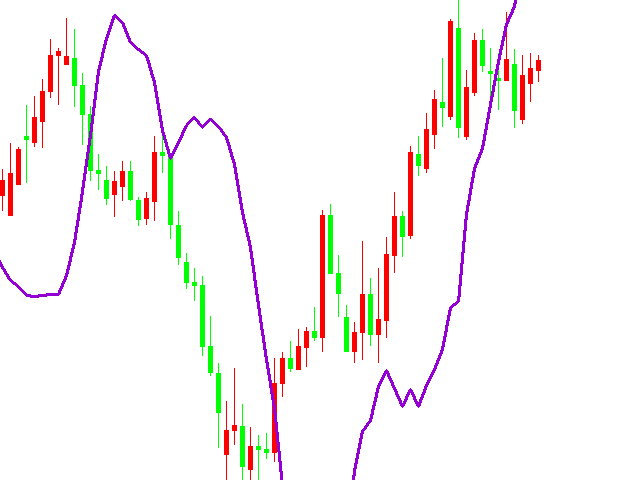
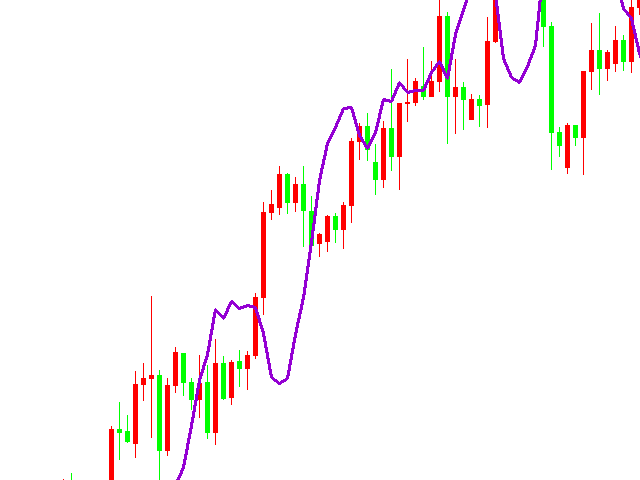
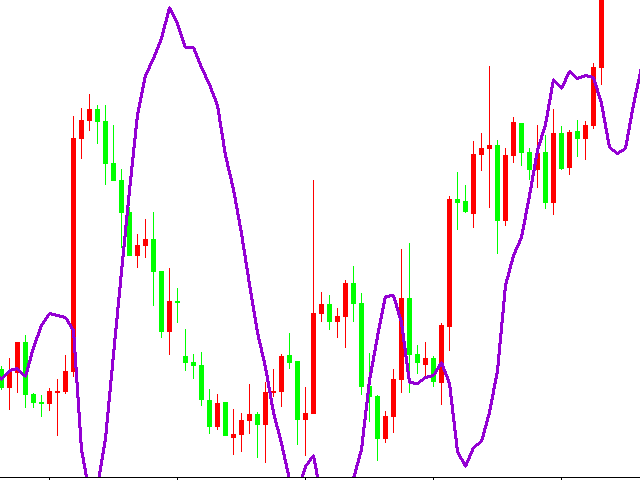
Macd's main chart indicator
1. You can determine the price at which the MACD will change from buy to sell, and vice versa. It is the cousin of the oscillator predictor. If you know a position at the time, then the exact price, current and next (future) columns will need to reach the MACD crossover. You can also see how far the market has to go before your current position is helped or blocked by the next MACD crossover force. You can do this in all time frames because the predictor is updated in real time.
2. You can determine the “dynamic pressure” on the market by clearly observing the price behavior through the MACD predictor history and superimposing it directly on the bar chart. Dynamic pressure refers to the market's reaction to buying and selling signals. If you sell at MACD for 30 minutes and the market is flat, then you know that the next buy signal can easily become a big winner! This is something I often do with the standard MACD, but now it's easier to see!
input:
Fast EMA - period of the fast Moving Average.
Slow EMA - period of the slow Moving Average.
Signal EMA - period of the Signal line.