Macd Predictor
- インディケータ
- バージョン: 1.2
- アップデート済み: 30 1月 2020
- アクティベーション: 5

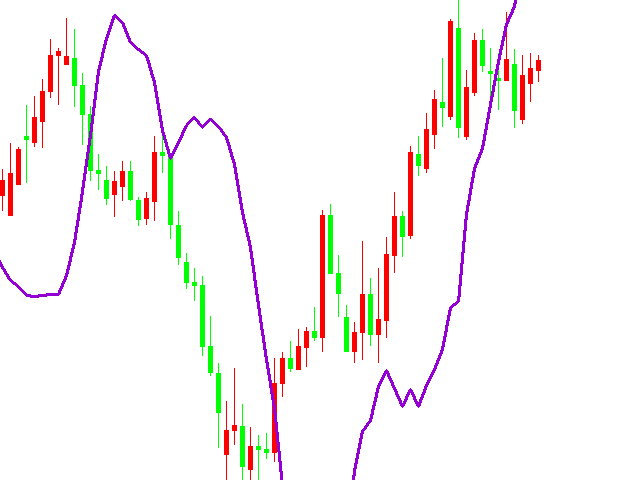
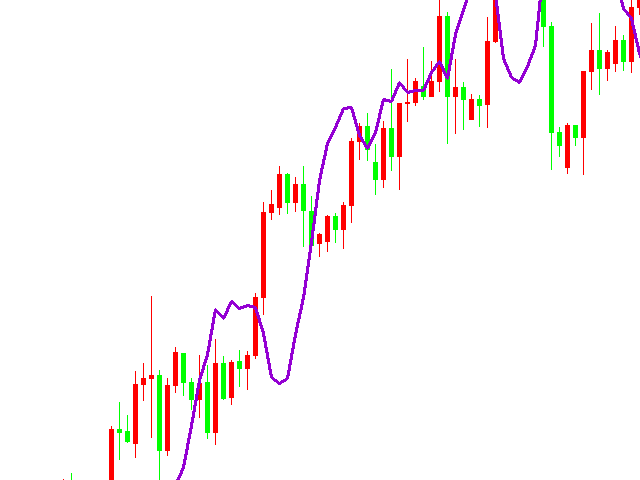
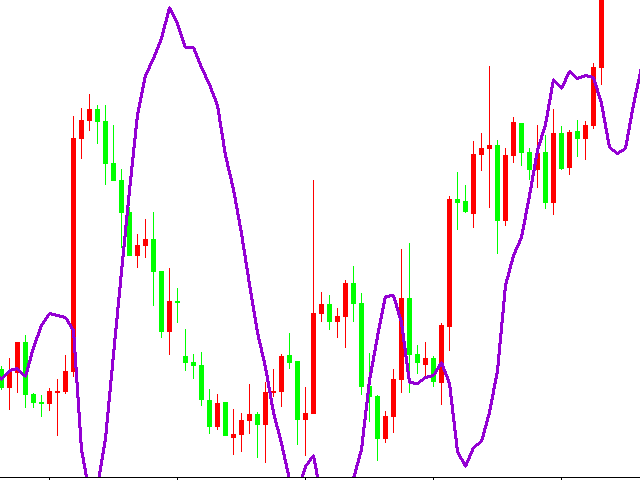
Macdのメインチャートインジケータ
1. MACDが買いから売りに変わる価格を決定することができます。逆も同様です。 これはオシレータの予測子のいとこです。 当時のポジションを知っていれば、正確な価格、現在および次の(将来の)列はMACDクロスオーバに到達する必要があります。 あなたは、現在のポジションが次のMACDクロスオーバーフォースによって助けられたりブロックされたりする前に、市場がどのくらい離れていなければならないかを見ることもできます。 プレディクタはリアルタイムで更新されるため、すべての時間枠でこれを行うことができます。
2. MACD予測変数の履歴を使って価格行動を明確に観察し、棒グラフに直接重ねることで、市場の「動圧」を決定できます。 ダイナミックな圧力とは、信号を売買する市場の反応を指します。 MACDで30分間販売していて、市場が平坦であれば、次の購入信号が簡単に大きな勝者になることがわかります! これは私がよく標準MACDで行うことですが、今は見やすいです!
input:
Fast EMA - period of the fast Moving Average.
Slow EMA - period of the slow Moving Average.
Signal EMA - period of the Signal line.