• 概述
  • 评论
  • 评论
  • 新特性

Draw Line

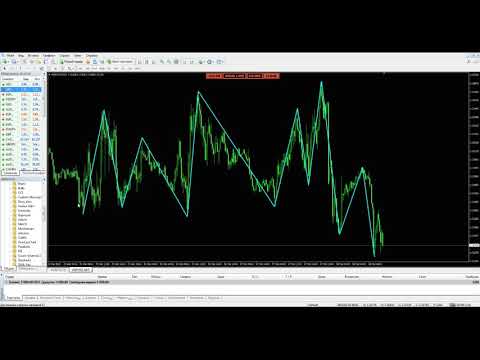
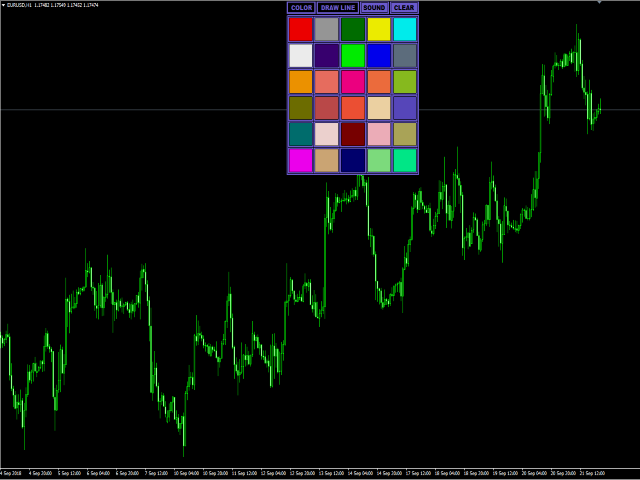
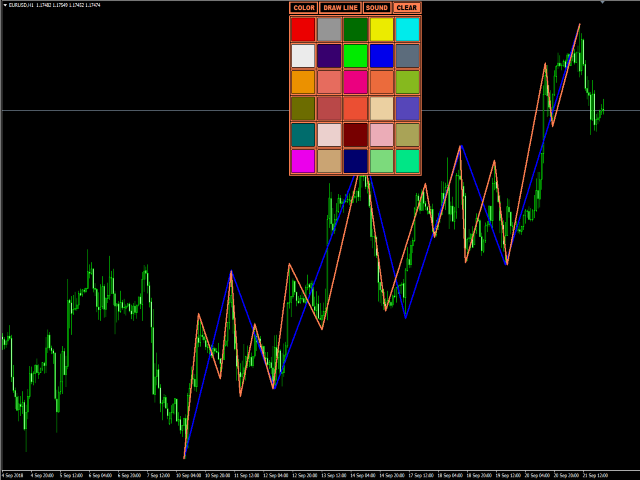
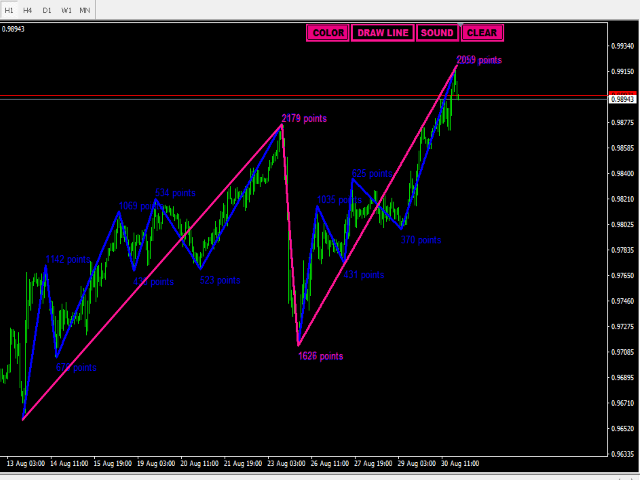
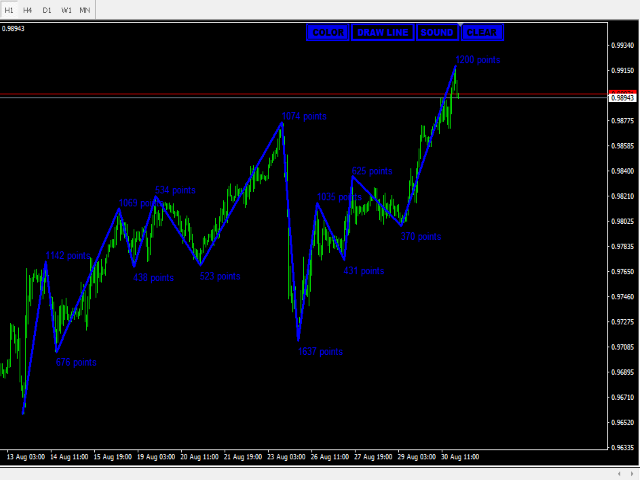
Indicator Draw Line, is a utility for drawing in the chart trend lines, connecting together and following one after another. It will be especially useful for traders who use in their trading wave analysis. Above the graph are buttons for switching the basic settings: Calling the color bar, Turning the indicator on and off, Turning the sound on and off, Clearing the chart from the created objects. With the rest of the settings will not be difficult to understand. Use your health!


推荐产品
该指标自动计算并绘制斐波那契支撑位和阻力位 - 最有效的市场分析工具之一。 计算使用所选期间和时间范围的平均价格数据。此期间的最小值和最大值被视为运动的开始和结束。 斐波那契水平让您可以看到潜在的参考点,围绕这些点价格走势可以放缓或逆转,也就是说,它们用于预测进一步的走势,以及设置止损和限价单。 参数: PartsShow - 从当前柱状图显示的历史级别数 CalcPeriod - 价格平均周期 SmoothingMethod - 价格平均法(26 个选项) TF - 用于计算的时间范围 LevelColor - 水平线的颜色 ZeroLevelColor - 零级颜色 ShowVerticalLine - 启用/禁用水平之间的垂直线的显示 VLineStyle - 垂直线的样式 VLineColor - 垂直线的颜色 ShowInfo - 启用以标签形式显示有关级别百分比值的信息,否则以对象描述的形式显示 InfoFontSize - 信息字体大小 InfoColor - 信息字符串的颜色 FiboLevels - 显示水平的百分比值
Oscillator helps determine the direction of the market Shows the direction of the price movement and is painted in the appropriate color. Allows you to conduct trend and counter trend trading It works on all timeframes, on any currency pairs, metals and cryptocurrency Can be used when working with binary options Distinctive features Does not redraw; Simple and clear settings; It works on all timeframes and on all symbols; Suitable for trading currencies, metals, options and cryptocurrency (Bitco
FREE
PABT Pattern Indicator - it's classical system one of the signal patterns. Indicator logic - the Hi & Lo of the bar is fully within the range of the preceding bar, look to trade them as pullback in trend. In the way if indicator found PABT pattern it's drawing two lines and arrow what showing trend way.  - First line - it's entry point and drawing at: 1. On the high of signal bar or on middle of the signal bar (depending from indicator mode) for buy; 2. On the low of signal bar or on middle of t
Rsi Aligator
Dmitriy Konogorov
The indicator do have inside two a tehnical its "RSI" and "Aligator" indicators with histogram for technical analysis of the market, currencies, currency pairs, precious metals and oil, and you can also analyze various cryptocurrencies such as Bitcoin and Ethereum. The indicator analyzes quotes and, based on their data, displays its icons on the chart for trading analysis. The indicator works very well, does not freeze and does not slow down even a weak processor in the computer, and is also no
Fibox4
Denny Muhammad Zein
5 (2)
Fibox4 indicator displays Fibonacci Retracement, Pivot Point, and many other useful information for analysis. The interface is improved by providing clickable button on chart to switch on/off H4, daily, weekly, monthly swing retracement level. In addition, fibox4 displays Current Daily Range and Weekly Range. This version can be used for all pairs..
Square Dashboard is a new generation indicator that has the task of simplifying the technical analysis of the market and speeding up access to the charts. The logic of this indicator is really simple but effective, you can observe the daily, weekly and monthly opening values. The confluence of these values leads to the generation of the warning, red to identify bearish conditions, green to identify bullish conditions, while the gray color identifies the lateral condition. Having the whole market
This is an arrow indicator without a future function,developed based on the most advanced profit trading algorithms.It has the most innovative and advanced dual trend analysis module, as well as the latest and highly effective market trend prediction algorithm.Trends are your friends, and following larger trends can earn the maximum profit in foreign exchange. This indicator helps traders identify current trends and track them. Someone once made a profit of 10 times in a week by relying on it.No
Owl smart levels
Sergey Ermolov
4.63 (54)
MT5版本  |  FAQ Owl Smart Levels Indicator   是一個完整的交易系統,包含   Bill Williams   的高級分形、構建正確的市場波浪結構的 Valable ZigZag 以及標記準確入場水平的斐波那契水平等流行的市場分析工具 進入市場和地方獲利。 策略的详细说明 指示灯使用说明 顾问-贸易猫头鹰助手助理 私人用户聊天 ->购买后写信给我,我会将您添加到私人聊天中,您可以在那里下载所有奖金 力量在於簡單! Owl Smart Levels   交易系統非常易於使用,因此適合專業人士和剛開始研究市場並為自己選擇交易策略的人。 策略和指標中沒有隱藏的秘密公式和計算方法,所有策略指標都是公開的。 Owl Smart Levels 允許您快速查看進入交易的信號,突出顯示下訂單的水平並向您發送有關已出現信號的通知。 優點很明顯: 清楚地顯示主要和更高時間框架的趨勢方向。 指示儀器信號的出現。 標記開單、止損設置和固定利潤的水平。 沒有多餘的,只有必要的結構! ZigZag   表示全球趨勢的方向,因此也表示貿易方向。 市場反轉點的短線清楚地表明在
Gold Phoenix
Yaroslav Varankin
The perfect tool for Scalng in the Forex markets You can trade both from signal to signal and using take profit  The algorithm does not use Zigzag!  No redrawing!  This is a channel instrument that uses a moving average as a filter. Moving Average  There are 2 parameters for the settings Ma Period = 5 period Moving Average  Channel 1.0 distance of channel lines from the chart Price Signal Filter - calculation of signal opening and filter There is a complete set of Alert There is a multi-timefram
HC ARROW
Cuong Pham
The indicator shows you buy/sell signals and does not repaint. It works well with almost all pairs, while the best ones are GBPUSD, XAUUSD and EURUSD. The product works better on H1 and H4. You can change the parameters in the inputs tab to get the best signals and the best trade results on each pair. You can enable/disable alerts when signal appears. The indicator is easy to use. Parameters barstrip & Sensitive: amount of bars to process the highest and lowest prices (relates to the internal
Crosskalp1
Mikhail Bilan
Добрый День уважаемые трейдеры!  Вашему вниманию индикатор созданный и работающий на базе трендовика ADX,  для торговли на смене направления движения который учитывает коррекцию и даёт возможность на ней заработать.  Применяю этот индикатор для скальпинга. Рекомендую таймфреймы от 15 ти минутного(М15) до часового (Н1) периодов.  Красный кружок сигнал на продажу- Sell) Зелёный кружок  сигнал на покупку Buy) Чем меньше ваш таймфрейм тем меньше пунктов вы зарабатываете.   Важно выставлять стопы! !В
这是一个预测蜡烛收盘价的指标。 该指标主要用于 D1 图表。 该指标适用于传统外汇交易和二元期权交易。 该指标可以用作独立的交易系统,也可以作为您现有交易系统的补充。 该指标分析当前蜡烛,计算蜡烛本身内部的某些强度因素,以及前一根蜡烛的参数。 因此,该指标预测市场走势的进一步方向和当前蜡烛的收盘价。 由于这种方法,该指标既适用于短期盘中交易,也适用于中长期交易。 该指标允许您设置指标在分析市场情况期间将产生的潜在信号的数量。 在指标设置中有一个特殊的参数。 此外,该指标可以通过图表上的消息、电子邮件以及推送通知的形式通知新信号。感谢您的关注!交易愉快! 购买后一定要写信给我! 我会给你我的交易指标的建议! 还可以获得奖金!
Trend Ray
Andriy Sydoruk
The indicator shows the potential trend direction by cyclical-wave dependence. Thus, all the rays of the intersection will be optimal rays, in the direction of which the price is expected to move, taking into account the indicator period. Rays can be used as a direction for potential market movement. But we must not forget that the approach must be comprehensive, the indicator signals require additional information to enter the market.
The Th3Eng PipFinite indicator is based on a very excellent analysis of the right trend direction with perfect custom algorithms. It show the true direction and the best point to start trading. With StopLoss point and Three Take Profit points. Also it show the right pivot of the price and small points to order to replace the dynamic support and resistance channel, Which surrounds the price. And Finally it draws a very helpful Box on the left side on the chart includes (take profits and Stop loss
BPSPanel
Remi Passanello
BPS Panel Breakout Pro Scalper Solution Panel This indicator is part of the   RPTrade Pro Solutions  systems. BPS Panel   is a daily trend indicator using Price Action, Dynamic Support and Resistances. It's designed to be used by anyone, even the absolute beginner in trading can use it. NEVER repaints . Indications are given   from close to close . Designed to   be used alone , no other indicators are required. Gives you the trend and potential Take Profit at the beginning of the day. How
Price Statistics
Miguel Antonio Rojas Martinez
This indicator works only 5 digits Brokers. It is impossible to talk about the study of the Forex market or any market without considering of that market statistics. In this case, our indicator "price statistics" we have a new way to study our chart, giving information of the price in a range of pips you want to study for example, can we know how many times the price closes or opens into spaces 10, 20, 30, 50, 100 pips or more; and know them not only in numbers but also draws this relationship a
Infinity Trend Pro
Yaroslav Varankin
1 (1)
This is a trend indicator without redrawing Developed instead of the binary options strategy (by the color of the Martingale candlestick) Also works well in forex trading When to open trades (binary options) A signal will appear in the place with a candle signaling the current candle It is recommended to open a deal for one candle of the current timeframe M1 and M5 When a blue dot appears, open a deal up When a red dot appears, open a trade down. How to open trades on Forex. When a signal is rec
Pivot Points Multi
Professoft Limited
Pivot Points Indicator Features: Send alerts when a pivot line is hit Displays Daily, Weekly, Monthly Indicators at the same time on the chart Restricting the time during the day when the alerts are sent Adjust the styling settings for the Pivot lines Settings: Show Daily Pivots Show Weekly Pivots Show Monthly Pivots Weekly Pivots Hit Notification Enabled Monthly Pivots Hit Notification Enabled Hit Check Frequency Time Restriction Enabled From Hour To Hour PP Color R1 Color R2 Color R3 Color S1
Insider Scalper Binary This tool is designed to trade binary options. for short temporary spends. to make a deal is worth the moment of receiving the signal and only 1 candle if it is m1 then only for a minute and so in accordance with the timeframe. for better results, you need to select well-volatile charts.... recommended currency pairs eur | usd, usd | jpy .... the indicator is already configured, you just have to add it to the chart and trade .... The indicator signals the next can
FREE DOWNLOAD  Understanding Support & Resistance Support and Resistance are critical levels used by market participants in making decisions. This level is used to determine whether the price will continue or reverse direction. If this Support and Resistance is combined with candlestick forms, it is believed that it will be able to determine the next movement.  Economic support can be interpreted as a level where supply begins to decrease and demand increases so that if that happens, prices will
Trend PA
Mikhail Nazarenko
5 (3)
The Trend PA indicator uses   Price Action   and its own filtering algorithm to determine the trend. This approach helps to accurately determine entry points and the current trend on any timeframe. The indicator uses its own algorithm for analyzing price changes and Price Action. Which gives you the advantage of recognizing, without delay, a new nascent trend with fewer false positives. Trend filtering conditions can be selected in the settings individually for your trading style. The indicator
For sure, this indicator has become very popular amongst traders. Through coding this indicator will give you the most accurate levels possible for your trading analysis. We have also added in the ability for you to receive alerts when the price breaks above or below a Support or Resistance lines! HOW TO USE The red rectangles represent your resistance/supply zone. The green rectangles represent your support/demand zone.  BONUS FEATURES We coded this indicator with the ability to switch between
Strong Retracement Points Pro demo edition! SRP (Strong Retracement/Reversal Points) is a powerful and unique support and resistance indicator. It displays the closest important levels which we expect the price retracement/reversal! If all level are broken from one side, it recalculates and draws new support and resistance levels, so the levels might be valid for several days depending on the market! If you are still hesitating to start using this wonderful tool, you can check this link to see h
PZ Support Resistance
PZ TRADING SLU
3.33 (3)
厌倦了绘制支撑线和阻力线? 支撑阻力 是一个多时间指标,可以自动检测并绘制图表中的支撑线和阻力线,并具有非常有趣的变化:随着时间的推移测试价格水平及其重要性的提高,线变得越来越粗。 [ 安装指南 | 更新指南 | 故障排除 | 常见问题 | 所有产品 ] 一夜之间增强您的技术分析 无需浏览图表即可检测重要的价格水平 一目了然地识别所有价格水平的相对优势 每次交易最多可节省半小时的绘图线 指标显示所有价格水平的期限 指示器不重涂 过去和现在的价格水平因接近程度而崩溃,并根据当前的市场行为进行了调整。在动作发生的地方绘制了线条,而不一定在峰值处绘制了线条。 价格水平随着时间的推移而被拒绝,变得越来越暗 定期清除不重要的价格水平以避免噪音 可自定义的时间范围选择和崩溃因子 它实现了电子邮件/声音/推送警报的突破 输入参数 指标设置:指标将从当前时间段读取价格,但您可以选择另一个。例如,您可以在H4图表中显示D1支撑线和阻力线。您还可以使用 价格水平密度 参数选择在图表上显示多少价格水平。 颜色设置:根据重要性输入所需的支撑线和阻力线颜色。 标签设置:(可选)可以在指示器
Trend Sensor MT4
Yuriy Lyachshenko
该指标显示最合适的进入和退出点。它还显示所有信号的统计数据,以便更好地分析交易。 在这个指标的帮助下,你将能够更好地了解市场。 一旦趋势的力量开始减弱(这将显示在面板上),趋势线将引向水平位置 - 这是退出交易的信号。或者你可以在达到平均/中值利润水平时退出。 该指标是我自2010年以来的交易经验的结晶。 MT5的指标版本 特点 这个指标不会重新绘制。印在历史图表上的东西也将被实时打印出来。 它可以用于交易任何资产:加密货币、股票、金属、指数、商品和货币。 在所有的时间框架上都可以工作。 进入的信号出现在新蜡烛的开端。 退出交易的信号是暂定的,因为通常你可以用更大的利润关闭交易。 在左上方有一个详细的交易统计面板,它可以被最小化。 在M1到W1的时间框架上,一次显示趋势的方向和它的力量。 有一个轻量级的代码,所以它不需要加载,也不会降低终端的速度。 使用一个特殊的公式计算移动平均线,它决定了趋势的方向。 为了不错过交易的信号,你可以在警报窗口和推送中收到通知。 适用于所有级别的用户,从初学者到专家。 统计小组 取自信号历史的天数。 提供统计的信号总数。 盈利和亏损信号
This is a new strategy for SUPPLY DEMAND areas It is based on a calculation using the tick volume to detect the big price action in market for both bear /bull actions this smart volume action candles are used to determine the supply and demand areas prices in between main supply and demand lines indicate sideway market  up arrows will be shown when prices moves above the main supply and the secondary supply lines Down arrows will be shown when prices moves below the main demand and the secondary
Wave Wolf MT4
Andrei Salanevich
Wave Wold MT4外汇指标旨在搜索狼波并将其显示在交易终端的当前窗口中。 对于在交易中使用狼波的交易者来说,这是一个很好的指标。 它在交易策略中的应用将显着提高其效率和盈利能力。 有关指标的信息 与其他Wolf wave指标不同,Wave Wold MT4外汇指标具有许多显着提高其有效性的功能: 第一个是打开的Windows5point参数(真值)提供信息支持,即扩展了狼波出现在其上的图表的窗口。 例如,如果EURUSD、AUDUSD和GBPUSD图表是开放的,并且每个图表都安装了Wave WOLD MT4指标,那么如果检测到欧元模型,相应的图表将自动被带到其他图表的顶部,这在交易大量工具时变得非常方便。  第二个功能是MACD上的内置发散分析,用户可以自己选择参数(默认设置(12,26,9))。 顺便说一下,通常振荡器的值不显示在工作窗口上,只反映在形成点(5)时的价格标签的颜色上,特别是,如果标签的颜色是蓝色,则没有发散,如果颜色是红 如何使用指标 Wave WOLD MT4指标显示第4个形成点的假设Wolf模型和第5个点的形成区域(所谓的甜区,以黄色显示)。
Buy sell sig
Eliud Icharia
BUY SELL SIG. Utilizing unique price calculations BUY SELL SIG . generates high quality signals Now Features easy to use and Buy and Sell signals for Pro and Novice traders Supports Multi-currency Best results viewed on H1,H4 ,D1 and W1 Timeframes Supports audio alerts and notifications. No complex input parameters just notifications and the indicator style properties
Indicator. "Indicator wave or Indicator Ma". Using 23 standard indicators and the author's algorithm, the levels of purchases (from 0 to +100) and sales (from 0 to -100) are calculated. Then, using the calculated levels, the "Wave Indicator" draws a wave with 21 moving averages. The wave number is equal to the averaging period of the calculated levels. Waves # 1 - 7 Fast Moving Averages Waves from No. 8 -14 moving averages Waves from No. 15-21 slow moving averages Looking at the figu
该产品的买家也购买
Gann Made Easy
Oleg Rodin
4.95 (43)
Gann Made Easy 是一个专业且易于使用的外汇交易系统,它基于使用先生理论的最佳交易原则。 W.D.江恩。该指标提供准确的买入和卖出信号,包括止损和获利水平。您甚至可以使用推送通知在旅途中进行交易。 购买后请联系我!我将免费与您分享我的交易技巧和丰厚的红利指标! 您可能已经多次听说过江恩交易方法。通常 Gann 的理论不仅对于新手交易者而且对于那些已经有一定交易经验的人来说都是非常复杂的东西。这是因为江恩的交易方法在理论上并不那么容易应用。我花了几年时间来完善这些知识,并将最好的原则应用到我的外汇指标中。 该指标非常易于应用。您所需要的只是将其附加到您的图表并遵循简单的交易建议。该指标不断进行市场分析工作并寻找交易机会。当它检测到一个好的入口点时,它会为您提供一个箭头信号。该指标还显示止损和获利水平。 换句话说,当您像先生一样进行交易时,该指标会为您提供最佳江恩建议。江恩亲自告诉你此时此刻该做什么。但最好的部分是您不需要了解任何有关江恩交易原则的知识,因为该指标会为您完成整个市场分析工作。
引入神奇外汇指标:释放精准交易的力量 你是否厌倦了寻找在所有时间框架上都能取得出色结果的完美外汇指标?别再继续寻找了!神奇外汇指标已经来到,改变您的交易体验,将您的利润推向新的高度。 神奇外汇指标基于尖端技术和多年的精心开发,堪称外汇市场上的强大和精确的巅峰之作。这个卓越的工具旨在满足各个层次的交易者需求,在追求持续盈利性方面提供无与伦比的优势。 神奇外汇指标的独特之处在于其无与伦比的适应性。无论您是日内交易者、波段交易者还是更喜欢长期持仓,该指标都经过优化,能在所有时间框架上取得出色的结果。然而,当在1小时时间框架上使用时,它的准确性和捕捉市场复杂走势的能力得到真正展示。 准备好对神奇外汇指标的准确性和可靠性感到惊讶。其先进的算法无缝结合了强大的指标、统计分析和趋势识别,实时为您提供全面的市场视图。指标的智能和动态信号使您能够自信地做出明智的交易决策,最大限度地提高获胜交易的机会。 不再犹豫和迷茫。神奇外汇指标消除了交易的猜测,使您在市场参与者中具有独特的优势。其用户友好的界面和直观的设计使得无论是经验丰富的专业人士还是初学者都能轻松掌握这一卓越工具的力量。 有了神奇外汇指标的支持,
目前八折优惠! 对任何新手或专家交易者来说都是最好的解决方案! 这个仪表板软件适用于28种货币对。它基于我们的两个主要指标(高级货币强度28和高级货币冲动)。它对整个外汇市场提供了一个伟大的概述。它显示高级货币强度值,货币运动速度和28个外汇对在所有(9)时间段的信号。想象一下,当你可以使用图表上的单一指标观察整个市场,以确定趋势和或剥头皮的机会时,你的交易将得到改善 我们已经在这个指标中建立了一些功能,使你更容易识别强势和弱势货币,同时识别和确认潜在的交易。该指标以图形方式显示货币的强势或弱势是增加还是减少,以及它在所有时间段的表现。 增加的新功能是动态市场斐波那契水平,它适应当前的市场条件变化,这是一个已经在我们的高级货币强度28和高级货币冲动指标中使用的成熟的加分项。 在交易时,总是将弱势货币和强势货币配对,这个新指标将帮助你做到这一点。 用户手册:点击这里  https://www.mql5.com/en/blogs/post/708783 特点  显示每个时间段的ACS28和GAP-speed(冲动)的货币强度值。 列:颜色代码以7种颜色
Atomic Analyst
Issam Kassas
5 (1)
首先值得强调的是,该交易指标是非重绘、非延迟的指标,这使其成为手动和机器人交易的理想选择。 Atomic Analyst是一种PA价格行动指标,利用价格的力量和动量来寻找市场上更好的机会。配备了高级过滤器,可帮助去除噪音和假信号,并提高交易潜力。使用多层复杂的指标,Atomic Analyst扫描图表,并将复杂的数学计算转化为任何初学者都能理解并用来做出一致交易决策的简单信号和颜色。 “Atomic Analyst”是专为新手和经验丰富的交易者量身定制的综合交易解决方案。它将高级指标和一流功能融合为一体的交易策略,使其成为所有类型交易者的多功能选择。 日内交易和剥头皮策略:专为快速准确的日内交易和短期交易而设计。 日内和摆动交易策略:可用作追求价格大幅波动的日内和摆动交易者的可靠工具。 多货币和市场:凭借其可靠的精度,在不同的工具和市场上运作。 多个时间框架:可在多个时间框架上使用,性能良好。 稳定性:所有指标均不重绘、不重绘和不滞后,确保可靠的信号。 信号清晰度:提供箭头信号,用于清晰的入场和出场点。 实时警报:通过交易入场、SL和TP警报通知交易者。 多个利润水平:使用
TPSproTREND PrO
Roman Podpora
5 (15)
TPSpro TRENDPRO  - is a trend indicator that automatically analyzes the market and provides information about the trend and each of its changes, as well as giving signals for entering trades without redrawing! The indicator uses each candle, analyzing them separately. referring to different impulses - up or down impulse. Exact entry points into transactions for currencies, crypto, metals, stocks, indices!  -  Version MT5               DETAILED DESCRIPTION        /       TRADING SETUPS           
Advanced Currency Strength28 Indicator
Bernhard Schweigert
4.9 (662)
目前26%的折扣 任何新手或专家交易者的最佳解决方案! 这个指标是一个独特的、高质量的、可负担得起的交易工具,因为我们纳入了一些专有的功能和一个新的公式。只需一个图表,你就可以读出28个外汇对的货币强度!想象一下,你的交易将如何得到改善,因为你的交易是在你的手中进行的。想象一下,你的交易将如何改善,因为你能够准确地确定新趋势或剥头皮机会的触发点? 用户手册:点击这里  https://www.mql5.com/en/blogs/post/697384 这是第一本,原版的! 不要买一个毫无价值的崇拜者的克隆品。 特别的 子窗口中的箭头显示强劲的货币势头GAP将指导你的交易! 当基础货币或报价货币处于超卖/超买区域(外盘斐波那契水平)时,在个人图表的主窗口中出现警告信号。 当货币力量从外围区间回落时,回撤/反转警报。 十字星模式的特别警报 可选择多个时间框架,以快速查看趋势! 货币强度线在所有的时间框架中都非常平稳,当使用较高的时间框架来识别总体趋势,然后使用较短的时间框架来确定精确的入口时,效果非常好。你可以根据自己的意愿选择任何时间框架。每个时间框架都由其自身进
TPSpro RFI Levels
Roman Podpora
5 (13)
A key element in trading is zones or levels from which decisions to buy or sell a trading instrument are made. Despite attempts by major players to conceal their presence in the market, they inevitably leave traces. Our task was to learn how to identify these traces and interpret them correctly. Reversal First Impulse levels (RFI)   -  Version MT5                INSTRUCTIONS                 RUS                 ENG                                       R ecommended to use with an indicator   -  
Scalper Inside PRO
Alexey Minkov
4.75 (55)
An exclusive indicator that utilizes an innovative algorithm to swiftly and accurately determine the market trend. The indicator automatically calculates opening, closing, and profit levels, providing detailed trading statistics. With these features, you can choose the most appropriate trading instrument for the current market conditions. Additionally, you can easily integrate your own arrow indicators into Scalper Inside Pro to quickly evaluate their statistics and profitability. Scalper Inside
Quantum Trend Sniper Indicator MT4
Bogdan Ion Puscasu
4.59 (39)
介绍   量子趋势狙击指标 ,突破性的 MQL5 指标,正在改变您识别和交易趋势反转的方式!由拥有超过13年交易经验的资深交易员团队开发,     量子趋势狙击指标   旨在通过其创新的方式以极高的准确度识别趋势反转,将您的交易之旅推向新的高度。 ***购买量子趋势狙击指标,即可免费获得量子突破指标!*** 当量子突破指标识别出趋势反转时,它会向您发出警报和信号箭头,并建议您三个止盈水平。 它既适合新手交易者,也适合专业交易者。 量子 EA 通道:       点击这里 MT5版本:       点击这里 建议: 时间范围:  所有时间范围。为了获得最佳结果,我们建议在 M15、M30 和 H1 时间范围内使用它。 货币对:欧元兑美元、英镑兑美元、澳元兑美元、欧元兑英镑, EURAUD, XAUUSD 账户类型:ECN、Raw 或 Razor,点差极低 经纪时间:任意 经纪商:IC Markets、Pepperstone with Raw 和 Razor 的点差最低 建议止损:50 点 建议止盈水平:20 点、50 点和 1
TrendMaestro
Stefano Frisetti
5 (2)
note: this indicator is for METATRADER4, if you want the version for METATRADER5 this is the link: TRENDMAESTRO recognizes a new TREND in the bud, he never makes mistakes. The certainty of identifying a new TREND is priceless. DESCRIPTION TRENDMAESTRO identifies a new TREND in the bud, this indicator examines the volatility, volumes and momentum to identify the moment in which there is an explosion of one or more of these data and therefore the moment in which prices have strong probability of f
首先,值得强调的是,这个交易工具是非重绘、非重画和非滞后的指标,非常适合专业交易。 智能价格行动概念指标是一个非常强大的工具,既适用于新手,也适用于经验丰富的交易者。它将超过20个有用的指标合并到一个指标中,结合了高级交易思想,如内圈交易员分析和智能资金概念交易策略。该指标侧重于智能资金概念,提供有关大型机构交易方式的见解,帮助预测它们的动向。 它在流动性分析方面尤其擅长,有助于理解机构的交易方式。它擅长预测市场趋势,并仔细分析价格波动。通过将您的交易与机构策略对齐,您可以更准确地预测市场走向。该指标多才多艺,擅长分析市场结构,识别重要的订单区块,并识别各种模式。 它擅长识别BOS和CHoCH等模式,理解动量的转变,并突出显示供需强劲的关键区域。它还擅长发现强大的不平衡,并分析价格创造更高高点或更低低点的模式。如果您使用斐波那契回撤工具,该指标可以满足您的需求。它还可以识别相等的高点和低点,分析不同的时间框架,并通过仪表板显示数据。 对于使用更高级策略的交易者,该指标提供了工具,如公平价值差指标和优惠和折扣区域的识别。它特别关注高时间框架订单区块,并在较长时间框架内彻
Trend Screener
STE S.S.COMPANY
4.83 (86)
趋势指标,趋势交易和过滤的突破性独特解决方案,所有重要趋势功能都内置在一个工具中! 它是 100% 非重绘多时间框架和多货币指标,可用于所有符号/工具:外汇、商品、加密货币、指数、股票。 趋势筛选器是有效的指标趋势跟踪指标,它在图表中提供带有点的箭头趋势信号。 趋势分析器指标中可用的功能: 1.趋势扫描仪。 2. 具有最大利润分析的趋势线。 3.趋势货币强度计。 4. 带有警报的趋势反转点。 5. 带有警报的强趋势点。 6. 趋势箭头 每日分析示例,每日信号表现...等与我们的趋势筛选指标,可以在这里找到: 点击这里 限时优惠:Trend Screener Indicator 仅售 50 美元且终身可用。原价 125$) 通过访问我们的 MQL5 博客,您可以找到我们所有的高级指标以及分析示例、每日信号表现...等。 : 点击这里 我们的趋势系统由 2 个指标组成: 1. Trend Screener Indicator:显示趋势仪表盘、图表中的趋势线、入场点...等。 2. Trend Line Map Indicator:显示买卖作为仪表板,活动信号盈利/亏损
FX Power MT4 NG
Daniel Stein
5 (8)
通过 mql5 和 Telegram 上 的晨间简报获取每日市场更新,包括详细信息和屏幕截图 ! FX Power MT4 NG 是我们长期以来非常受欢迎的货币强度计算器 FX Power 的下一代产品。 这款下一代强度计算器能提供什么?您所喜爱的原版 FX Power 的所有功能 附加功能 黄金/XAU 强度分析 更精确的计算结果 可单独配置的分析周期 可自定义计算限制,以获得更好的性能 为希望查看更多信息的用户提供特殊的多实例设置 无尽的图形设置,可在每个图表中设置您最喜欢的颜色 无数的通知选项,让您再也不会错过任何重要信息 采用 Windows 11 和 macOS 风格的全新圆角设计 神奇的移动指标面板 FX Power 主要功能 所有主要货币的完整强势历史 所有时间框架内的货币强弱历史 所有经纪商和图表的计算结果完全相同 100% 可靠的实时计算 -> 无重绘 可通过下拉列表选择分析时段 通过自定义模式单独配置分析时段 可在一个图表中使用多个实例 可移动 FX Power 显示屏(通过拖放) 适用于高分辨率 QHD、UHD 和 4K 显示器 自动终端配置 针对平板电脑
Currency Strength Wizard
Oleg Rodin
4.91 (44)
货币强度向导是一个非常强大的指标,为您提供成功交易的一体化解决方案。该指标使用多个时间范围内所有货币的数据来计算这个或那个外汇对的力量。此数据以易于使用的货币指数和货币电力线的形式表示,您可以使用它们来查看这种或那种货币的力量。 您所需要的只是将指标附加到您要交易的图表上,该指标将向您显示您交易的货币的真实强度。该指标还向您显示买卖量压力的极值,您可以在顺势交易时利用这些压力。该指标还显示了基于斐波那契的可能目标。该指标可用于各种交易时间范围。该指标支持各种货币对的交易。 该指标为您提供所有类型的警报,包括推送通知。 购买后请联系我。我将与您分享我的交易技巧,并免费为您提供丰厚的红利指标! 祝您交易愉快,获利丰厚!
Quantum Breakout Indicator PRO
Bogdan Ion Puscasu
4.96 (26)
介绍     Quantum Breakout PRO   ,突破性的 MQL5 指标,正在改变您交易突破区域的方式!   Quantum Breakout PRO 由拥有超过 13 年交易经验的经验丰富的交易者团队开发,旨在通过其创新和动态的突破区域策略将您的交易之旅推向新的高度。 量子突破指标将为您提供带有 5 个利润目标区域的突破区域的信号箭头,以及基于突破框的止损建议。 它既适合新手交易者,也适合专业交易者。 量子 EA 通道:       点击这里 MT5版本:   点击这里 重要的!购买后请私信我领取安装手册。 建议: 时间范围:M15 货币对:GBPJPY、EURJPY、USDJPY、NZDUSD、XAUUSD 账户类型:ECN、Raw 或 Razor,点差极低 经纪商时间:GMT +3 经纪商:IC Markets、Pepperstone with Raw 和 Razor 的点差最低 规格: 不重漆! 最多 5 个建议利润目标区域 建议止损水平 可定制的盒子。您可以设置自己的 Box Time Start 和 Box Time E
XQ Indicator MetaTrader 4
Marzena Maria Szmit
3 (2)
Step into the realm of Forex trading with confidence and precision using XQ, a cutting-edge Forex indicator designed to elevate your trading game to unprecedented heights. Whether you're a seasoned trader or just stepping into the world of currency exchange,   XQ Forex Indicator   empowers you with the insights and signals needed to make informed trading decisions. The signal conditions are a combination of three indicators, and XQ Forex Indicator only display  medium and long-term trends . The
使用我们的自定义MT4指标发现成功外汇交易的秘诀! 您是否曾经想过如何在外汇市场上取得成功,一贯赚取利润,同时降低风险? 这是您一直在寻找的答案! 允许我们介绍我们的专有MT4指标,该指标将彻底改变您的交易方法。 独特的多功能性 我们的指标专为喜欢Renko和Rangebar Candle编队的用户而设计。 我们了解到,这些图表类型受到许多经验丰富的交易者的青睐,这就是为什么我们的指标与它们无缝集成,从而提供无与伦比的市场分析。 清晰的趋势信号 忘记复杂的分析! 我们的指标利用鲜艳的色彩和清晰的点结构来明确指示市场趋势。 红色和蓝色的点毫无疑问地对价格变动的方向留下了疑问,从而可以在您的交易中快速决策。 与HH/HL HL/LL策略对齐 如果您正在寻求一个指标,该指标无缝地与基于HH/HL和HL/LL结构的策略无缝合作,则不需要更多。 我们的工具不仅确定了这些形式,而且还促进了它们在投资过程中的有效利用。 绝对的清晰度和简单性 我们的首要任务是为您提供一种不仅有效而且易于使用的工具。 我们的指标是为了清晰而设计的,使您可以专注于做出投资决策,而不是
PRO Renko System
Oleg Rodin
5 (24)
PRO Renko Arrow Based System for trading renko charts.  准确的信号交易任何外汇工具. 另外,我将免费提供系统的附加模块! PRO Renko系统是RENKO图表上高度准确的交易系统。该系统是通用的。 该交易系统可应用于各种交易工具。 该系统有效地中和了所谓的市场噪音,打开了获得准确反转信号的通道。 该指标易于使用,只有一个参数负责产生信号。 您可以很容易地使算法适应您感兴趣的交易工具和renko酒吧的大小。 我很乐意通过提供任何咨询支持来帮助所有客户有效地使用该指标。 祝您交易成功!购买后,立即写信给我! 我将与您分享我的建议和我的renko发电机。 另外,我将免费提供系统的附加模块!
Advanced Supply Demand
Bernhard Schweigert
4.92 (310)
现在优惠 33%! 任何新手或专业交易者的最佳解决方案! 该指标是一款独特、高质量、且价格合理的交易工具,因为我们已经整合了许多专有功能和新公式。 依据此更新,您将能够显示双重时间帧区域。 您不仅可以显示一个较高的时间帧,还可以同时显示图表时间帧,加上更高的时间帧:显示嵌套时区。 供需双方所有交易者都会喜欢它。 :) 重要信息披露 高级供需的最大潜力,请访问 https://www.mql5.com/zh/blogs/post/720245   想象您的交易如何得以改善,是因为您能够精准定位入场或目标位吗? 构建于新的底层算法,它可以更轻松地识别出买卖双方之间的潜在失衡。 这是因为它以图形方式展示供需最强劲区域,及其过去的表现(显示旧区域)。 这些功能旨在帮助您更轻松地发现最佳入场区域和价位。 现在您可以针对您的交易品种和时间帧来优化和编辑区域强度! 高级供需指标适用于所有产品和时间帧。 它是一个新的公式,非常新的功能是两个区域强度函数可由用户输入进行调整! 这在交易中是一大优势。 当您学习如何使用专有功能,例如带有价格游离最小 X 因子的区域强度时,您能够判断该区域强劲与否。 供
Scalper Vault
Oleg Rodin
5 (27)
Scalper Vault 是一个专业的剥头皮系统,为您提供成功剥头皮所需的一切。该指标是一个完整的交易系统,可供外汇和二元期权交易者使用。推荐的时间范围是 M5。 该系统为您提供趋势方向的准确箭头信号。它还为您提供顶部和底部信号以及江恩市场水平。无论您拥有何种交易经验,该系统都易于使用。您只需要遵循简单的规则并每天重复该过程。 建议将此系统用于主要货币对。感谢您的关注! 请注意,该指标在策略测试器中可能无法正常工作。因此,我建议仅在模拟或真实账户的真实交易条件下使用该系统。 指示器提供所有类型的警报,包括推送通知。 购买指标后请与我联系。我将免费与您分享我的个人交易建议和出色的奖励指标! 祝您交易愉快,盈利!
Quantum Heiken Ashi PRO MT4
Bogdan Ion Puscasu
4.43 (7)
介绍     Quantum Heiken Ashi PRO 图表 Heiken Ashi 蜡烛旨在提供对市场趋势的清晰洞察,以其过滤噪音和消除虚假信号的能力而闻名。告别令人困惑的价格波动,迎接更流畅、更可靠的图表表示。 Quantum Heiken Ashi PRO 的真正独特之处在于其创新公式,它将传统烛台数据转换为易于阅读的彩色条。红色和绿色条分别优雅地突出了看跌和看涨趋势,让您能够以非凡的精度发现潜在的进入和退出点。 量子 EA 通道:       点击这里 MT5版本:       点击这里 这一卓越的指标具有以下几个关键优势: 增强清晰度:通过平滑价格波动,Heiken Ashi 金条可以更清晰地反映市场趋势,使您更容易识别有利的交易机会。 减少噪音:告别经常导致错误信号的不稳定价格变动。 Quantum Heiken Ashi 指标可过滤噪音,使您能够做出更明智的交易决策 无缝集成:Heiken Ashi 指标专为 MetaTrader 开发,可无缝集成到您的交易平台中。它用户友好、高度可定制,并且与您的其他交易指标和过滤器兼容 无论您是寻求新优势的经验
介绍 ON Trade Waves Patterns Harmonic Elliot Wolfe,这是一款高级指标,旨在使用手动和自动方法检测各种市场模式。以下是它的工作原理: 谐波模式: 该指标可以识别出现在您图表上的谐波模式。这些模式对于练习谐波交易理论的交易者非常重要,正如Scott Carney的书《谐波交易第1卷和第2卷》所描述的那样。无论您是手动绘制它们还是依赖自动检测,ON Trade Waves Patterns都可以胜任。 控制面板: 我们配备了一个用户友好的控制面板,它会保存您的图表和时间帧设置,使您可以轻松切换不同配置。您甚至可以最小化它以最大化图表空间。如果您更喜欢使用其他分析工具,只需单击关闭按钮即可隐藏所有指标数据。 模板保存: 当您自定义设置或添加其他指标,如移动平均线或布林带时,该指标会自动保存您的模板。这意味着您可以随时轻松加载您喜欢的设置。 优化显示: 对于Windows 10用户,我们建议调整您的DPI设置以获得高清设备上的最佳屏幕体验。右键单击MetaTrader图标,选择“兼容性”,然后选择“更改高DPI设置”,将其设置为“系统(增强)”。
Advanced Currency IMPULSE with ALERT
Bernhard Schweigert
4.91 (493)
目前31%的折扣!! 对任何新手或专家交易者来说都是最好的解决方案! 这个指标是一个独特的、高质量的、负担得起的交易工具,因为我们已经纳入了一些专有的功能和一个秘密的公式。只需一张图表,它就能给出所有28种货币对的警报。想象一下,你的交易将如何改善,因为你能够准确地确定新趋势或剥头皮机会的触发点 建立在新的基础算法上,它使识别和确认潜在交易变得更加容易。这是因为它以图形方式显示了一种货币的强势或弱势是否正在加速,并测量了这种加速的速度--把它想象成你汽车中的速度表。当你加速时,事情显然会发生得更快,这在外汇市场上也是一样的,即如果你配对的货币正在向相反的方向加速,你就会发现一个潜在的有利可图的交易。 货币动量的垂直线和箭头将指导你的交易! 动态的市场斐波那契23水平被用作警报触发器,将适应市场活动。如果冲动触及黄色触发线,您将在MetaTrader或您的电子邮件或推送警报中收到警报。然后你就知道作为一个交易员应该做什么。货币对和方向已经给出。只要点击警报按钮,就可以切换到该货币对或打开一个新的图表,以便进一步分析。警报级别可以通过用户输入来改变,可以选择3个敏感度级别
首先值得强调的是,这个交易系统是一个不重绘、不重画和不滞后的指标,这使它非常适合专业交易。 “智能支撑和阻力交易系统”是专为新手和经验丰富的交易者量身定制的先进指标。它赋予交易者在外汇市场上精确和自信的能力。这个综合系统结合了7+种策略、10个指标和各种交易方法,包括日内交易策略、波段交易策略、支撑和阻力策略、蜡烛图模式策略、VWAP策略、多时间段趋势策略等。它提供箭头信号、入场和出场点、交易警报、更高时间框架的趋势分析、实时交易监控以及见解深刻的趋势和成交量蜡烛染色。通过自动支撑和阻力检测,这是一个多面手的指标,帮助交易者在不同的市场条件下做出明智的决策。 “智能支撑和阻力交易系统”是一个强大的技术分析方法,融合了一套高端和强大的指标和工具。在其核心,这个系统识别关键的支撑和阻力水平,这些水平作为潜在市场反转或延续的关键区域。该系统无缝集成了多时间框架趋势面板,增强了交易者在不同时间框架下评估当前趋势方向的能力。此外,蜡烛图模式检测器扫描价格图表以获取重要的蜡烛图模式,为潜在的市场走势提供宝贵的见解。此外,VWAP(成交量加权平均价格)的加入帮助交易者评估市场情绪和日内趋势
TrendDecoder Premium
Christophe, Pa Trouillas
5 (2)
确定范围和下一步可能的走势   |  获得早期信号和趋势强度   |  在反转之前获得明确的退出   |  了解价格将测试哪些斐波水平 非重绘、非延迟指标 - 手动和自动交易的理想选择 - 适用于所有资产和所有时间单位 限时优惠 >>   50% OFF 购买后,  请联系我的频道  获取推荐设置 MT5   版本: 点击此处 使用   BladeSCALPER   和   PowerZONES   获取我们的完整方法 它是什么? TrendDECODER 集多种创新于一身,使趋势监测变得简单易行。 投射趋势线(Projective TrendLine)--快速参考即将到来的趋势 实时趋势线(RealTime TrendLine)与投射趋势线(Projective TrendLine)的对比 - 与之前的同方向走势相比,市场是加速还是放缓? 实时趋势线交叉 - 趋势正在偏离轨道 使用 GreyBox - 市场不再是趋势并进入新的过渡序列 使用 DecoderSignals 和 Blue/Orange Clouds - 利用作为动态支撑/阻力的 Blue/Orange
介绍 Zeus 指标:您的终极利润突破交易工具。 该指标简化了交易,消除了使用突破策略进行深入分析的需要。它会根据您预设的时间框架自动绘制区域,建议止损(SL)、获利点(TP)和跟踪止损水平。 当价格接近买入或卖出入场点时,Zeus 指标会迅速通知您并显示信号箭头。它还提供了四个不同获利点和各种跟踪止损选项的建议。 这个工具适用于初学者和经验丰富的交易者。 频道支持: 点击这里 商店 : 点击这里 MT5 版本: 点击这里 建议: 时间框架:M5 或 M15 货币对:与所有货币对兼容 帐户类型:与任何类型的帐户兼容 建议止损:使用 Zeus 指标提供的 SL 建议 建议获利点:使用 Zeus 指标的 TP 建议 规格: 根据您预设的时间框架自动绘制区域 自动建议买入和卖出入场点 自动建议跟踪止损以保护利润 自动且易于看到的止损和获利点 包括警报通知 提供用于回测结果的面板 为每个货币对提供可自定义选项 能够调整区域边界以满足每个货币对的具体需求 以及更多功能! 联系方式: 如果您有任何问题或需要帮助,请随时通过私信与我们联系。
AW Trend Predictor
AW Trading Software Limited
4.74 (39)
一个系统中趋势和故障水平的组合。先进的指标算法过滤市场噪音,确定趋势、进入点以及可能的退出水平。指标信号记录在统计模块中,您可以选择最合适的工具,显示信号历史的有效性。该指标计算获利和止损标记。 手册和说明 ->   这里 / MT5 版本 ->   这里 如何使用指标进行交易: 使用趋势预测器进行交易只需三个简单的步骤: 第 1 步 - 开仓 收到买入信号,成功率超过 70% 第 2 步 - 确定止损 通过相反的信号选择中继线 第 3 步 - 定义止盈策略 策略一:达到 TP1 时平仓 策略 2:达到 TP1 时平仓 50%,达到 TP2 时平仓剩余 50% 策略三:在趋势反转时平仓 好处: 从不重绘结果,信号严格位于蜡烛收盘时 它可以在顾问中使用 获利和止损标记 对交易策略或独立策略的重要补充 市场噪音过滤算法 适用于任何工具 统计模块: 为了更好地选择配对,请使用内置的统计计算。 计算交易 - 给出统计数据的信号总数 成功评级 - 达到 TP1 的信号百分比,或反转那些正获利的信号时的百分比 TakeProfit1 Hit - 达到 TP1 的信号百分比 TakeProfit2
TakePropips Donchian Trend Pro
Eric John Pajarillaga Aldana
4.82 (17)
TakePropips Donchian Trend Pro   (MT4) 是一款功能强大且有效的工具,可使用 Donchian 通道自动检测趋势方向,并为您提供进场和退场交易信号! 这个多功能指标包括趋势扫描器、交易信号、统计面板、筛选器、交易时段和警报历史仪表板。它旨在为您提供交易信号并节省您分析图表的时间! 您可以在我们的博文中下载用户手册和安装指南:   https   :// www.mql5.com/en/blogs/post/751368 今天立减 50%!价格从 98 美元降到 49 美元! 您可以在 Strategy Tester 上测试该指标(启用可视模式)。如果您喜欢在实时图表上进行测试,也可以给我发消息以获取 7 天试用版。 视频教程也可在说明下方获得更多详细信息。 如果您有任何问题或需要任何帮助,请与我联系。 TakePropips Donchian Trend Pro 指标适用于所有外汇对、金属、商品、指数和加密货币。 主要特点 交易信号 - 检测多个时间范围内所有货币对的买卖机会。它将为您提供警报并在图表上绘制交易信号,最多 3 个止盈价和一个止
ADR Reversal Indicator
LEE SAMSON
4.21 (14)
ADR 反轉指標一目了然地顯示當前價格相對於其正常平均每日範圍的交易位置。當價格超過您選擇的平均範圍和高於它的水平時,您將通過彈出窗口、電子郵件或推送獲得即時警報,以便您可以快速跳入回調和反轉。該指標在圖表上在平均每日範圍極值處繪製水平線,並在這些水平之上延伸,這些水平附加了價格超過它們的數學概率。下面的更多細節...... ADR 警報儀表板補充指標並監控所有配對也可在此處獲得: https://www.mql5.com/en/market/product/62756 MT5 版本也可在此處獲得: https://www.mql5.com/en/market/product/64477/ 大約 60% 的時間價格在其正常的平均每日範圍 (ADR) 內交易並推高這些水平通常是價格急劇波動的指標,通常會出現回調(獲利了結)走勢。您可以通過交易從每日範圍的頂部或底部回落到最近的支撐位或阻力位來利用這些急劇波動。 收集了超過 20 年的歷史數據,以找出主要外匯對和一系列交叉盤的價格超出特定 ADR 水平的平均百分比。該數據表明價格僅在 3% 的時間內超過其 ADR 的 20
Support Resistance screnner
STE S.S.COMPANY
4.86 (36)
支撑和阻力筛选器是 MetaTrader 的一个级别指标,它在一个指标内提供多种工具。 可用的工具有: 1. 市场结构筛选器。 2. 看涨回调区。 3. 看跌回调区。 4.每日枢轴点 5.每周枢轴点 6. 每月枢轴点 7. 基于谐波形态和成交量的强大支撑和阻力。 8. 银行级区域。 限时优惠:HV 支撑和阻力指示器仅售 50 美元且终生可用。 (原价 125$) 您想尝试不受 Metatrader Backtester 限制的指标吗? 单击此处下载演示版本。 主要特点 基于谐波和音量算法的强大支撑和阻力区域。 基于谐波和成交量算法的看涨和看跌回调区域。 市场结构筛选器 每日、每周和每月的枢轴点。 文档 所有支持和阻力筛选器文档(说明)和策略详细信息均可在我们 MQL5 博客的这篇文章中找到: 单击此处。 接触 如果您有任何问题或需要帮助,请通过私信联系我。 作者 SAYADI ACHREF,金融科技软件工程师,Finansya 创始人。
作者的更多信息
Candle Inside
Yuriy Vins
5 (1)
Candle Inside indicator - draws Japanese candlesticks of a higher timeframe on the chart. Now, after loading the indicator, it is possible to see what is happening inside each candle. In addition to the standard buttons for selecting the timeframe in the MT-4 terminal, additional buttons are added, when clicked, an older period is selected to display Japanese candles or zones. For example, if you select the standard period M1 and the period of the indicator M5, then the chart will display minute
Mini Assistant is a small training tool in the strategy tester. A minimal set of buttons provides ease of use. There are no external parameters; they are simply not needed here. All you need is right on the screen. Before opening a position, in the special input windows, specify the required volume, as well as Stop Loss and Take Profit levels. To close a position, select it by ticket in the lower window. The program was written quickly, and also does not have a special uniqueness, so I post it i
FREE
The FX Secretary indicator is a mini assistant for MT-4. His functional duties include - notifying the trader about closing deals with profit or at a loss. In the settings there is only one parameter in which you can change the language of the voice message. So far, the indicator speaks only two languages. In the future, it is possible to expand the functionality with an increase in languages and a set of words. Use for health!
FREE
ZZ Snake
Yuriy Vins
5 (1)
The ZZ Snake indicator is a small entertainment utility and does not have any benefit for trading. Made on the indicator ZigZag, so the parameters will be easy to figure out. If you set it on a graph, you can see a serpent monster that moves across the screen, changing the dimensions of the head and torso in movement. Just connect it to the schedule and let yourself crawling. Careful, he can bite! ) P.S. For a more dynamic movement of the snake, it is recommended to run it in the strategy test
FREE
Good old snake with various options. You can play directly on the chart. And you can play in a separate window. You can not play at all, but set her speed of movement and run it on the machine, the snake itself will chase and devour apples. You can turn on different sounds of eating apples, or you can completely turn off all sounds. You can set the maximum length of the snake, and you can also set the number of dice on the game board. In short - a lot of things are possible. Enjoy.. )
FREE
The Find Levels utility scans the range of prices and bars indicated by you on the chart, finds the levels most often related to High and Low prices and provides a full report. The color of the level line depends on the number of touches and changes in the program settings. The level is drawn in the event that if the shadow of the High or Low candle was at least two touches during the period specified in the parameters. The characteristics of the candle, namely, what should be its parameters for
WaveAnalyzer works on the basis of the ZagZag indicator. When a wave formation appears on the chart, which can be chosen from the list in the program settings, it informs the trader in the following ways: - Starts Alert. - Informs by voice. - Sends a letter. - Sends a push notification to a smartphone. - Makes a screenshot, which can be viewed in the MQL4 / Files folder. In the future we plan to expand the functionality of this indicator. Thus, by placing on the chart several indic
Wave Slope
Yuriy Vins
Wave Slope - works on the basis of the ZigZag indicator and is designed to measure the slope of the current wave, in degrees. The sharper the angle of inclination, the stronger the trend. And on this you can build a trading system. In the settings, you can connect the ZigZag indicator, set the color and width of the slope line. And you can also turn on and off the sound signal, which is triggered in case of a change in the slope of the wave.
Signal AO is a simple informational utility. It gives a signal about crossing the zero mark by the Awesome Oscillator (AO) indicator. Signals will be received depending on the chart on which the utility is located. The settings are pretty simple: SYGNAL TYPE: ALERT - The signal gives alert. SOUND - Voice notification. ALERT_AND_SOUND - Alert together with voice notification. LANGUAGE: Select the language in which the Signal AO will communicate.
筛选:
无评论
回复评论
版本 1.5 2019.09.02
Small corrections are made in the indicator settings.
版本 1.4 2019.09.01
Added functions showing wavelength in points and in bars. They can be enabled in the settings. Disabled by default.
版本 1.3 2018.09.22

Added a color bar. Now the color of the lines can be selected directly on the graph. Only 30 colors. The remaining colors can be selected in the standard settings.
版本 1.2 2018.09.18
Added, for convenience, three more buttons on the graph: Sound button, the button for switching colors (in random order), the button for clearing the graph from all created objects. Pleasant use!