HLOCTrend
- 指标
- 版本: 1.11
- 激活: 5

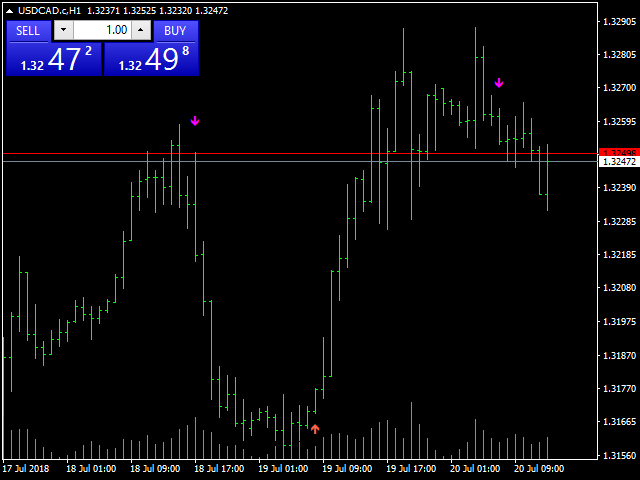
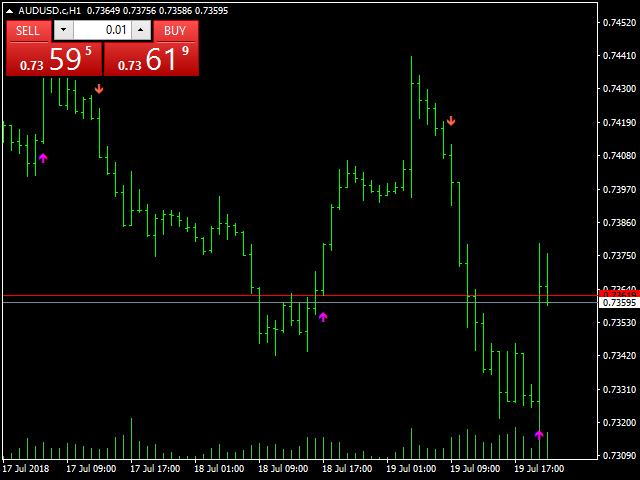
HLOC Trend Indicator
This indicator helps you to determine trend direction on your trade.
Default parameters for H1 time frame. You can use this indicator both bigger time frame and smaller time frame to open a trade.
The calculation is based on high, low, opening and closing price values of each bar in the selected time period.
When the values found in the Indicator custom formula are exceeded, the buy or sell signal falls on the screen.
There are two extern inputs;
- RiskFactor: Early but risky signals or slightly later but more reliable signals.
- BarsCounted: Counted bars amount.
Happy trades.