• 概述
  • 评论
  • 评论
  • 新特性

PivotSupportResistance

PivotSupportResistance

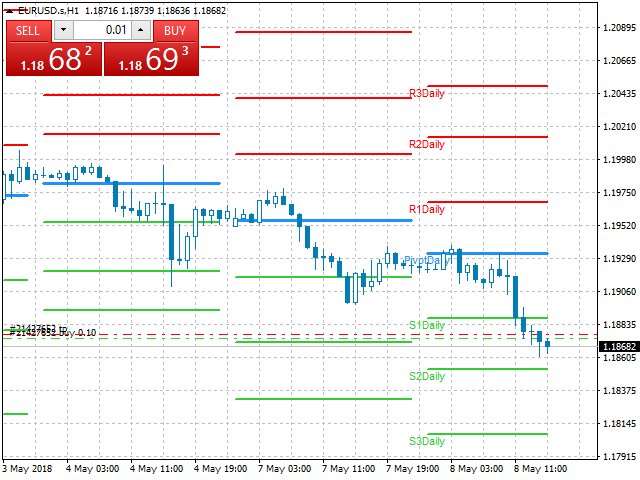
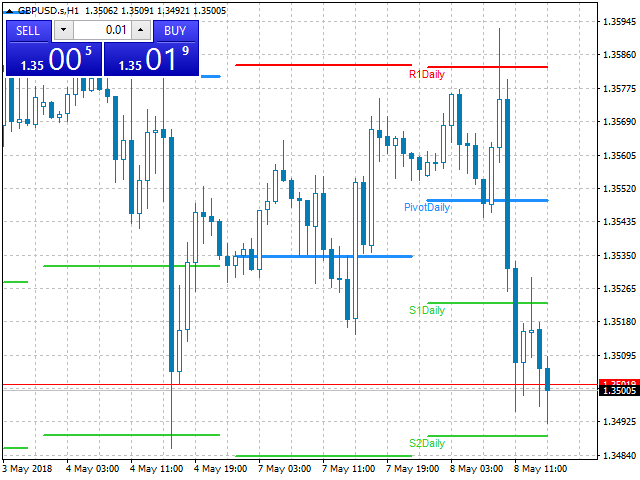
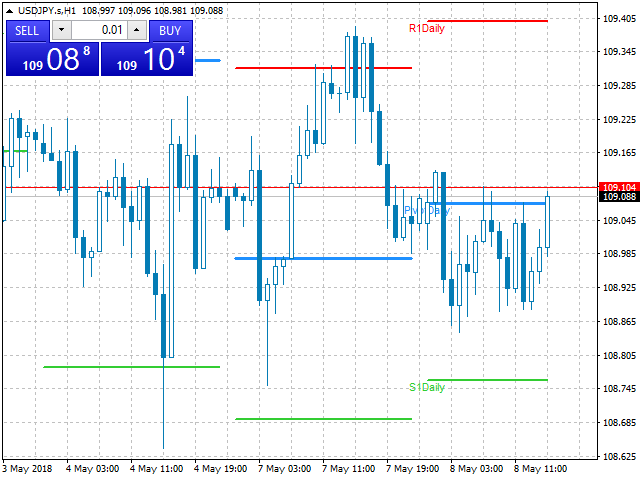
  • This indicator plots horizontal lines at daily pivot levels R3, R2, R1, Pivot, S1, S2, S3, where R means Resistance and S means Support.
  • This indicator can be applied to any chart period, although daily pivots on charts with long periods are meaningless (if you switch your chart timeframe greater than daily chart, you will get alert and indicator will not work).
  • Labels are shown for the most recent day's levels.
  • There are no external inputs, so it is easy to use.
  • Please refresh your history data before attaching the indicator to your chart.


推荐产品
VR Cub
Vladimir Pastushak
VR Cub 这是获得高质量切入点的指标。该指标的开发是为了促进数学计算并简化对仓位入场点的搜索。多年来,该指标所针对的交易策略已被证明其有效性。交易策略的简单性是其巨大的优势,即使是新手交易者也能成功进行交易。 VR Cub 计算开仓点以及获利和止损目标水平,这显着提高了效率和易用性。查看使用以下策略进行交易的屏幕截图,了解简单的交易规则。 设置、设置文件、演示版本、说明、问题解决,可以从以下位置获取 [博客] 您可以在以下位置阅读或撰写评论 [关联] 版本为 [MetaTrader 5] 计算入场点的规则 开仓 要计算入场点,您需要将 VR Cub 工具从最后一个高点拉伸到最后一个低点。 如果第一个点在时间上早于第二个点,交易者等待柱线收于中线上方。 如果第一个点在时间上晚于第二个点,交易者等待柱线收于中线下方。 根据上述条件,严格在 柱线收盘 后建仓。 换句话说,如果我们在小时图上进行交易,那么从最高点到最低点的时间距离必须超过24小时,最高点和最低点之间的点数必须大于或等于平均价格变动每天。 维持和改变市场地位 可以有多个未平仓头寸;每个头寸都可以单独修改。 VR Cu
Owl smart levels
Sergey Ermolov
4.63 (54)
MT5版本  |  FAQ Owl Smart Levels Indicator   是一個完整的交易系統,包含   Bill Williams   的高級分形、構建正確的市場波浪結構的 Valable ZigZag 以及標記準確入場水平的斐波那契水平等流行的市場分析工具 進入市場和地方獲利。 策略的详细说明 指示灯使用说明 顾问-贸易猫头鹰助手助理 私人用户聊天 ->购买后写信给我,我会将您添加到私人聊天中,您可以在那里下载所有奖金 力量在於簡單! Owl Smart Levels   交易系統非常易於使用,因此適合專業人士和剛開始研究市場並為自己選擇交易策略的人。 策略和指標中沒有隱藏的秘密公式和計算方法,所有策略指標都是公開的。 Owl Smart Levels 允許您快速查看進入交易的信號,突出顯示下訂單的水平並向您發送有關已出現信號的通知。 優點很明顯: 清楚地顯示主要和更高時間框架的趨勢方向。 指示儀器信號的出現。 標記開單、止損設置和固定利潤的水平。 沒有多餘的,只有必要的結構! ZigZag   表示全球趨勢的方向,因此也表示貿易方向。 市場反轉點的短線清楚地表明在
This is a new strategy for SUPPLY DEMAND areas It is based on a calculation using the tick volume to detect the big price action in market for both bear /bull actions this smart volume action candles are used to determine the supply and demand areas prices in between main supply and demand lines indicate sideway market  up arrows will be shown when prices moves above the main supply and the secondary supply lines Down arrows will be shown when prices moves below the main demand and the secondary
这是一个预测蜡烛收盘价的指标。 该指标主要用于 D1 图表。 该指标适用于传统外汇交易和二元期权交易。 该指标可以用作独立的交易系统,也可以作为您现有交易系统的补充。 该指标分析当前蜡烛,计算蜡烛本身内部的某些强度因素,以及前一根蜡烛的参数。 因此,该指标预测市场走势的进一步方向和当前蜡烛的收盘价。 由于这种方法,该指标既适用于短期盘中交易,也适用于中长期交易。 该指标允许您设置指标在分析市场情况期间将产生的潜在信号的数量。 在指标设置中有一个特殊的参数。 此外,该指标可以通过图表上的消息、电子邮件以及推送通知的形式通知新信号。感谢您的关注!交易愉快! 购买后一定要写信给我! 我会给你我的交易指标的建议! 还可以获得奖金!
Super Gator
Agustinus Biotamalo Lumbantoruan
This indi shows the following 1. Supertrend 2. Alligator (Not a regular alligator) 3. ZigZag 4. Moving Average 5. Trend Continuation/Mini correction Signal (plotted in X) (See screenshots in green background color 6. Early Signal Detection (See screenshots in green background color) You may treat Alligator as the lagging indicator The leading indicator is the supertrend. The zig zag is based on the leading indicator where it gets plotted when the leading indicator got broken to the opposite.
该指标自动计算并绘制斐波那契支撑位和阻力位 - 最有效的市场分析工具之一。 计算使用所选期间和时间范围的平均价格数据。此期间的最小值和最大值被视为运动的开始和结束。 斐波那契水平让您可以看到潜在的参考点,围绕这些点价格走势可以放缓或逆转,也就是说,它们用于预测进一步的走势,以及设置止损和限价单。 参数: PartsShow - 从当前柱状图显示的历史级别数 CalcPeriod - 价格平均周期 SmoothingMethod - 价格平均法(26 个选项) TF - 用于计算的时间范围 LevelColor - 水平线的颜色 ZeroLevelColor - 零级颜色 ShowVerticalLine - 启用/禁用水平之间的垂直线的显示 VLineStyle - 垂直线的样式 VLineColor - 垂直线的颜色 ShowInfo - 启用以标签形式显示有关级别百分比值的信息,否则以对象描述的形式显示 InfoFontSize - 信息字体大小 InfoColor - 信息字符串的颜色 FiboLevels - 显示水平的百分比值
Infinity Trend Pro
Yaroslav Varankin
1 (1)
This is a trend indicator without redrawing Developed instead of the binary options strategy (by the color of the Martingale candlestick) Also works well in forex trading When to open trades (binary options) A signal will appear in the place with a candle signaling the current candle It is recommended to open a deal for one candle of the current timeframe M1 and M5 When a blue dot appears, open a deal up When a red dot appears, open a trade down. How to open trades on Forex. When a signal is rec
Noize Absorption Index MT4
Ekaterina Saltykova
5 (1)
Noize Absorption Index - is the manual trading system that measures the difference of pressure between bears forces and bulls forces. Green line - is a noize free index that showing curent situation. Zero value of index shows totally choppy/flat market.Values above zero level shows how powerfull bullish wave is and values below zero measures bearish forces.Up arrow appears on bearish market when it's ready to reverse, dn arrow appears on weak bullish market, as a result of reverse expectation. S
RSX Signal 2 AM
Andriy Matviyevs'kyy
The indicator displays the signals of the RSX oscillator on the price chart. (To display these signals in a separate window, along with the oscillator, another indicator is used -  RSX Osc 4 AM ). It is optimal to use the indicator signals as signals to open a trade when the price overcomes the maximum or minimum of the bar at which the signal was given. An opposite signal cancels the previous signal. Settings: Data period for indicator calculation - data period for indicator calculation; Data
FREE
Master scalping M1
Nataliia Marchuk
Master Scalping M1 is an innovative indicator that uses an algorithm to quickly and accurately determine the trend.The indicator calculates the time of opening and closing positions, the indicator's algorithms allow you to find the ideal moments to enter a deal (buy or sell an asset), which increase the success of transactions for most traders. Benefits of the indicator: Easy to assemble, does not overload the chart with unnecessary information. Can be used as a filter for any strategy. Works on
The indicator detects and displays 3 Drives harmonic pattern (see the screenshot). The pattern is plotted by the extreme values of the ZigZag indicator (included in the resources, no need to install). After detecting the pattern, the indicator notifies of that by a pop-up window, a mobile notification and an email. The indicator highlights the process of the pattern formation and not just the complete pattern. In the former case, it is displayed in the contour triangles. After the pattern is com
Gvs Undefeated Trend   indicator is designed for trend and signal trading. This indicator generates trend signals.  It uses many algorithms and indicators to generate this signal. It tries to generate a signal from the points with the highest trend potential. This indicator is a complete trading product. This indicator does not need any additional indicators.  You can only trade with this indicator. The generated signals are displayed on the graphical screen.  Thanks to the alert features you ca
Trend Bilio
Ivan Simonika
Trend Bilio - an arrow indicator without redrawing shows potential market entry points in the form of arrows of the corresponding color: upward red arrows suggest opening a buy, green down arrows - selling. The entrance is supposed to be at the next bar after the pointer. The arrow indicator Trend Bilio visually "unloads" the price chart and saves time for analysis: no signal - no deal, if an opposite signal appears, then the current deal should be closed. It is Trend Bilio that is considered
这是一个 MTF 指标,它基于 带有价格标签的 Advanced ZigZag Dynamic 和/或 Extended Fractals 指标极值(可以禁用)。可以为 MTF 模式选择更多更高的 TF。默认情况下,级别是基于 ZigZag 指标点生成的。分形指标点也可以与 ZigZag 一起使用或代替它。为了简化使用并节省 CPU 时间,每根柱线在开盘时执行一次计算。 参数: ForcedTF - 水平计算的图表时间范围(可能等于或超过当前时间) MinPipsLevelWidth   - 以点为单位的最小关卡宽度(用于非常紧凑的关卡) Use ZigZag Extremums points - 启用/禁用使用 ZigZag 峰值计算支撑/阻力水平 Fixed pips range - 计算 ZigZag 指标的最小值和最大值之间的距离 UseDynamicRange   - 启用/禁用 ZigZag 指标最小值和最大值之间距离的动态计算 Dynamic volatility period - 用于计算 ZigZag 指标最小值和最大值之间的动态距离的波动期 Dynamic vola
The indicator displays the data of the Stochastic oscillator from a higher timeframe on the chart. The main and signal lines are displayed in a separate window. The stepped response is not smoothed. The indicator is useful for practicing "manual" forex trading strategies, which use the data from several screens with different timeframes of a single symbol. The indicator uses the settings that are identical to the standard ones, and a drop-down list for selecting the timeframe. Indicator Parame
Quantum Heiken Ashi PRO MT4
Bogdan Ion Puscasu
4.43 (7)
介绍     Quantum Heiken Ashi PRO 图表 Heiken Ashi 蜡烛旨在提供对市场趋势的清晰洞察,以其过滤噪音和消除虚假信号的能力而闻名。告别令人困惑的价格波动,迎接更流畅、更可靠的图表表示。 Quantum Heiken Ashi PRO 的真正独特之处在于其创新公式,它将传统烛台数据转换为易于阅读的彩色条。红色和绿色条分别优雅地突出了看跌和看涨趋势,让您能够以非凡的精度发现潜在的进入和退出点。 量子 EA 通道:       点击这里 MT5版本:       点击这里 这一卓越的指标具有以下几个关键优势: 增强清晰度:通过平滑价格波动,Heiken Ashi 金条可以更清晰地反映市场趋势,使您更容易识别有利的交易机会。 减少噪音:告别经常导致错误信号的不稳定价格变动。 Quantum Heiken Ashi 指标可过滤噪音,使您能够做出更明智的交易决策 无缝集成:Heiken Ashi 指标专为 MetaTrader 开发,可无缝集成到您的交易平台中。它用户友好、高度可定制,并且与您的其他交易指标和过滤器兼容 无论您是寻求新优势的经验
ZhiBiCCI MT4
Qiuyang Zheng
5 (1)
【ZhiBiCCI】指标适合所有的周期使用,也适合所有的市场品种。 【ZhiBiCCI】绿色实线是逆转看涨背离。绿色虚线是经典的看涨背离。 【ZhiBiCCI】向红色实线是反向看跌背离。红色虚线是古典看跌背离。 【ZhiBiCCI】可以在参数里面设置(Alert、Send mail、Send notification),设置为(true)就可以发送即时信号到警报窗口、电子邮件、即时消息。 参数设置说明: 【displayAlert】:这是警报开关,设置成true,如果出现箭头就会自动警报提示;设置成false,则不会警报提示。 【sendmail_NO_OFF】:这是发送邮件的开关,设置成true,如果出现箭头就会发送邮件到你在MT4设置好的邮箱里面;设置成false,则不会发邮件。 【sendnotification_NO_OFF】:这是发送即时消息的开关,设置成true,如果出现箭头就会发送消息到你的移动设备;设置成false,则不会发消息。 更多好用的指标网址: https://www.mql5.com/en/users/zhengqiuyang/seller
Trendiness Index
Libertas LLC
5 (3)
"The trend is your friend" is one of the best known sayings in investing, because capturing large trendy price movements can be extremely profitable. However, trading with the trend is often easier said than done, because many indicators are based on price reversals not trends. These aren't very effective at identifying trendy periods, or predicting whether trends will continue. We developed the Trendiness Index to help address this problem by indicating the strength and direction of price trend
Monster Harmonic Indicator
Paul Geirnaerdt
4.61 (31)
Monster Harmonics Indicator is a harmonic pattern indicator. It recognizes Gartley, Bat, Crab, Butterfly, Cypher, White Swan, Black Swan, Shark and several other patterns. Projected patterns that are not yet completed are recognized, too. Monster even shows the PRZ (Potential Reversal Zone). Users can add their own user defined patterns to Monster. Besides the current pattern, Monster also shows all patterns in the symbols history. Monster will provide alerts for developing patterns. Introduced
The Th3Eng PipFinite indicator is based on a very excellent analysis of the right trend direction with perfect custom algorithms. It show the true direction and the best point to start trading. With StopLoss point and Three Take Profit points. Also it show the right pivot of the price and small points to order to replace the dynamic support and resistance channel, Which surrounds the price. And Finally it draws a very helpful Box on the left side on the chart includes (take profits and Stop loss
RTrends
Nikolay Likhovid
The RTrends indicator does two things: first, it automatically draws the layout of the price chart by plotting trend lines and, secondly, it produces bearish and bullish signals. The layout reflects the fractal nature of the market. Trends from different time horizons are applied simultaneously on the chart. Thus, from a single chart a trader can see trend lines of higher timeframes. The lines, depending on the horizon, differ in color and width: the older the horizon, the thicker the line is. T
Gold Bricks FX Gold
Sayan Vandenhout
Gold Bricks FX USES THE TREND WAVE INDICATOR AND IT CAN IDENTIFY THE BEGINNING AND THE END OF A NEW WAVE TREND MOVEMENT. AS AN OSCILLATOR, THE INDICATOR IDENTIFIES THE OVERBOUGHT AND OVERSOLD ZONES. IT WORKS GREAT TO CATCH THE SHORT TERM PRICE REVERSALS AND USES A MARTINGALE STRATEGY TO CLOSE ALL TRADES IN PROFIT. USE DEFAULT SETTINGS ON H1 OR HIGHER TIME FRAME ON ANY PAIR FOR MORE ACCURATE TRADES WHY THIS EA : Smart entries calculated by 4 great strategies The EA can be run on even a
KT Renko Patterns MT4
KEENBASE SOFTWARE SOLUTIONS
2.33 (3)
KT Renko Patterns scans the Renko chart brick by brick to find some famous chart patterns that are frequently used by traders across the various financial markets. Compared to the time-based charts, patterns based trading is easier and more evident on Renko charts due to their uncluttered appearance. KT Renko Patterns features multiple Renko patterns, and many of these patterns are extensively explained in the book titled Profitable Trading with Renko Charts by Prashant Shah. A 100% automate
Insider Scalper Binary This tool is designed to trade binary options. for short temporary spends. to make a deal is worth the moment of receiving the signal and only 1 candle if it is m1 then only for a minute and so in accordance with the timeframe. for better results, you need to select well-volatile charts.... recommended currency pairs eur | usd, usd | jpy .... the indicator is already configured, you just have to add it to the chart and trade .... The indicator signals the next can
Trend Ray
Andriy Sydoruk
The indicator shows the potential trend direction by cyclical-wave dependence. Thus, all the rays of the intersection will be optimal rays, in the direction of which the price is expected to move, taking into account the indicator period. Rays can be used as a direction for potential market movement. But we must not forget that the approach must be comprehensive, the indicator signals require additional information to enter the market.
Introducing the "Magic Trades" for MetaTrader 4 – your ultimate tool for precision trading in dynamic markets. This innovative indicator revolutionizes the way you perceive market trends by harnessing the power of advanced analysis to detect subtle changes in character, paving the way for optimal trading opportunities. The Magic Trades Indicator is designed to empower traders with insightful entry points and well-defined risk management levels. Through its sophisticated algorithm, this indica
In the stock market technical analysis, support and resistance is a concept that the movement of the price of a security will tend to stop and reverse at certain predetermined price levels. Support and resistance levels can be identified on any timeframe. However, the most significant ones are found on the higher time frames, such as daily, weekly, and monthly. This indicator using the weekly OHLC data to identify the relevant levels. This is a support and resistance indicator and providing majo
Introduction It is common practice for professional trades to hide their stop loss / take profit from their brokers. Either from keeping their strategy to the themselves or from the fear that their broker works against them. Using this indicator, the stop loss / take profit points will be drawn on the product chart using the bid price. So, you can see exactly when the price is hit and close it manually.  Usage Once attached to the chart, the indicator scans the open orders to attach lines fo
Signal From Level
Yaroslav Varankin
Binary Options Support Resistance Indicator This indicator is designed for binary options trading and effectively shows retracements from support and resistance levels. Signals appear on the current candle. A red arrow pointing downwards indicates a potential selling opportunity, while a blue arrow pointing upwards suggests buying opportunities. All that needs adjustment is the color of the signal arrows. It is recommended to use it on the M1-M5 timeframes as signals are frequent on these timef
TWO PAIRS SQUARE HEDGE METER INDICATOR Try this brilliant 2 pairs square indicator It draws a square wave of the relation between your two inputs symbols when square wave indicates -1 then it is very great opportunity to SELL pair1 and BUY Pair2 when square wave indicates +1 then it is very great opportunity to BUY pair1 and SELL Pair2 the inputs are : 2 pairs of symbols         then index value : i use 20 for M30 charts ( you can try other values : 40/50 for M15 , : 30 for M30 , : 10 for H1 ,
该产品的买家也购买
Atomic Analyst
Issam Kassas
5 (1)
首先值得强调的是,该交易指标是非重绘、非延迟的指标,这使其成为手动和机器人交易的理想选择。 Atomic Analyst是一种PA价格行动指标,利用价格的力量和动量来寻找市场上更好的机会。配备了高级过滤器,可帮助去除噪音和假信号,并提高交易潜力。使用多层复杂的指标,Atomic Analyst扫描图表,并将复杂的数学计算转化为任何初学者都能理解并用来做出一致交易决策的简单信号和颜色。 “Atomic Analyst”是专为新手和经验丰富的交易者量身定制的综合交易解决方案。它将高级指标和一流功能融合为一体的交易策略,使其成为所有类型交易者的多功能选择。 日内交易和剥头皮策略:专为快速准确的日内交易和短期交易而设计。 日内和摆动交易策略:可用作追求价格大幅波动的日内和摆动交易者的可靠工具。 多货币和市场:凭借其可靠的精度,在不同的工具和市场上运作。 多个时间框架:可在多个时间框架上使用,性能良好。 稳定性:所有指标均不重绘、不重绘和不滞后,确保可靠的信号。 信号清晰度:提供箭头信号,用于清晰的入场和出场点。 实时警报:通过交易入场、SL和TP警报通知交易者。 多个利润水平:使用
Advanced Currency Strength28 Indicator
Bernhard Schweigert
4.9 (662)
目前26%的折扣 任何新手或专家交易者的最佳解决方案! 这个指标是一个独特的、高质量的、可负担得起的交易工具,因为我们纳入了一些专有的功能和一个新的公式。只需一个图表,你就可以读出28个外汇对的货币强度!想象一下,你的交易将如何得到改善,因为你的交易是在你的手中进行的。想象一下,你的交易将如何改善,因为你能够准确地确定新趋势或剥头皮机会的触发点? 用户手册:点击这里  https://www.mql5.com/en/blogs/post/697384 这是第一本,原版的! 不要买一个毫无价值的崇拜者的克隆品。 特别的 子窗口中的箭头显示强劲的货币势头GAP将指导你的交易! 当基础货币或报价货币处于超卖/超买区域(外盘斐波那契水平)时,在个人图表的主窗口中出现警告信号。 当货币力量从外围区间回落时,回撤/反转警报。 十字星模式的特别警报 可选择多个时间框架,以快速查看趋势! 货币强度线在所有的时间框架中都非常平稳,当使用较高的时间框架来识别总体趋势,然后使用较短的时间框架来确定精确的入口时,效果非常好。你可以根据自己的意愿选择任何时间框架。每个时间框架都由其自身进
TPSproTREND PrO
Roman Podpora
5 (15)
TPSpro TRENDPRO  - is a trend indicator that automatically analyzes the market and provides information about the trend and each of its changes, as well as giving signals for entering trades without redrawing! The indicator uses each candle, analyzing them separately. referring to different impulses - up or down impulse. Exact entry points into transactions for currencies, crypto, metals, stocks, indices!  -  Version MT5               DETAILED DESCRIPTION        /       TRADING SETUPS           
Quantum Trend Sniper Indicator MT4
Bogdan Ion Puscasu
4.59 (39)
介绍   量子趋势狙击指标 ,突破性的 MQL5 指标,正在改变您识别和交易趋势反转的方式!由拥有超过13年交易经验的资深交易员团队开发,     量子趋势狙击指标   旨在通过其创新的方式以极高的准确度识别趋势反转,将您的交易之旅推向新的高度。 ***购买量子趋势狙击指标,即可免费获得量子突破指标!*** 当量子突破指标识别出趋势反转时,它会向您发出警报和信号箭头,并建议您三个止盈水平。 它既适合新手交易者,也适合专业交易者。 量子 EA 通道:       点击这里 MT5版本:       点击这里 建议: 时间范围:  所有时间范围。为了获得最佳结果,我们建议在 M15、M30 和 H1 时间范围内使用它。 货币对:欧元兑美元、英镑兑美元、澳元兑美元、欧元兑英镑, EURAUD, XAUUSD 账户类型:ECN、Raw 或 Razor,点差极低 经纪时间:任意 经纪商:IC Markets、Pepperstone with Raw 和 Razor 的点差最低 建议止损:50 点 建议止盈水平:20 点、50 点和 1
Scalper Inside PRO
Alexey Minkov
4.75 (55)
SALE NOW! Limited Time Offer! An exclusive indicator that utilizes an innovative algorithm to swiftly and accurately determine the market trend. The indicator automatically calculates opening, closing, and profit levels, providing detailed trading statistics. With these features, you can choose the most appropriate trading instrument for the current market conditions. Additionally, you can easily integrate your own arrow indicators into Scalper Inside Pro to quickly evaluate their statistics and
Advanced Supply Demand
Bernhard Schweigert
4.92 (310)
现在优惠 33%! 任何新手或专业交易者的最佳解决方案! 该指标是一款独特、高质量、且价格合理的交易工具,因为我们已经整合了许多专有功能和新公式。 依据此更新,您将能够显示双重时间帧区域。 您不仅可以显示一个较高的时间帧,还可以同时显示图表时间帧,加上更高的时间帧:显示嵌套时区。 供需双方所有交易者都会喜欢它。 :) 重要信息披露 高级供需的最大潜力,请访问 https://www.mql5.com/zh/blogs/post/720245   想象您的交易如何得以改善,是因为您能够精准定位入场或目标位吗? 构建于新的底层算法,它可以更轻松地识别出买卖双方之间的潜在失衡。 这是因为它以图形方式展示供需最强劲区域,及其过去的表现(显示旧区域)。 这些功能旨在帮助您更轻松地发现最佳入场区域和价位。 现在您可以针对您的交易品种和时间帧来优化和编辑区域强度! 高级供需指标适用于所有产品和时间帧。 它是一个新的公式,非常新的功能是两个区域强度函数可由用户输入进行调整! 这在交易中是一大优势。 当您学习如何使用专有功能,例如带有价格游离最小 X 因子的区域强度时,您能够判断该区域强劲与否。 供
TPSpro RFI Levels
Roman Podpora
5 (13)
A key element in trading is zones or levels from which decisions to buy or sell a trading instrument are made. Despite attempts by major players to conceal their presence in the market, they inevitably leave traces. Our task was to learn how to identify these traces and interpret them correctly. Reversal First Impulse levels (RFI)   -  Version MT5                INSTRUCTIONS                 RUS                 ENG                                       R ecommended to use with an indicator   -  
TrendMaestro
Stefano Frisetti
5 (2)
note: this indicator is for METATRADER4, if you want the version for METATRADER5 this is the link: TRENDMAESTRO recognizes a new TREND in the bud, he never makes mistakes. The certainty of identifying a new TREND is priceless. DESCRIPTION TRENDMAESTRO identifies a new TREND in the bud, this indicator examines the volatility, volumes and momentum to identify the moment in which there is an explosion of one or more of these data and therefore the moment in which prices have strong probability of f
目前八折优惠! 对任何新手或专家交易者来说都是最好的解决方案! 这个仪表板软件适用于28种货币对。它基于我们的两个主要指标(高级货币强度28和高级货币冲动)。它对整个外汇市场提供了一个伟大的概述。它显示高级货币强度值,货币运动速度和28个外汇对在所有(9)时间段的信号。想象一下,当你可以使用图表上的单一指标观察整个市场,以确定趋势和或剥头皮的机会时,你的交易将得到改善 我们已经在这个指标中建立了一些功能,使你更容易识别强势和弱势货币,同时识别和确认潜在的交易。该指标以图形方式显示货币的强势或弱势是增加还是减少,以及它在所有时间段的表现。 增加的新功能是动态市场斐波那契水平,它适应当前的市场条件变化,这是一个已经在我们的高级货币强度28和高级货币冲动指标中使用的成熟的加分项。 在交易时,总是将弱势货币和强势货币配对,这个新指标将帮助你做到这一点。 用户手册:点击这里  https://www.mql5.com/en/blogs/post/708783 特点  显示每个时间段的ACS28和GAP-speed(冲动)的货币强度值。 列:颜色代码以7种颜色
引入神奇外汇指标:释放精准交易的力量 你是否厌倦了寻找在所有时间框架上都能取得出色结果的完美外汇指标?别再继续寻找了!神奇外汇指标已经来到,改变您的交易体验,将您的利润推向新的高度。 神奇外汇指标基于尖端技术和多年的精心开发,堪称外汇市场上的强大和精确的巅峰之作。这个卓越的工具旨在满足各个层次的交易者需求,在追求持续盈利性方面提供无与伦比的优势。 神奇外汇指标的独特之处在于其无与伦比的适应性。无论您是日内交易者、波段交易者还是更喜欢长期持仓,该指标都经过优化,能在所有时间框架上取得出色的结果。然而,当在1小时时间框架上使用时,它的准确性和捕捉市场复杂走势的能力得到真正展示。 准备好对神奇外汇指标的准确性和可靠性感到惊讶。其先进的算法无缝结合了强大的指标、统计分析和趋势识别,实时为您提供全面的市场视图。指标的智能和动态信号使您能够自信地做出明智的交易决策,最大限度地提高获胜交易的机会。 不再犹豫和迷茫。神奇外汇指标消除了交易的猜测,使您在市场参与者中具有独特的优势。其用户友好的界面和直观的设计使得无论是经验丰富的专业人士还是初学者都能轻松掌握这一卓越工具的力量。 有了神奇外汇指标的支持,
Entry Points Pro
Yury Orlov
4.7 (224)
这是一款 MT4 的趋势指标,可提供准确的入场交易信号,且无重绘或延迟。 它可应用在任何金融资产:外汇、加密货币、贵金属、股票、指数。 最好的结果出现在 M15+ 的时间帧内。 指标的 MT5 版本 重要! 购买后请联系我,以便获取详细指南和奖励。 视频 (6:22) - 一个信号赢取的利润等于指标价格的三倍。 视频 (4:44) - 它如何在测试器中工作,我的提示和技巧。 视频 (1:44) - 有关它如何处理加密货币和指数的几句话。 大多数交易者在 Entry Points Pro 指标的帮助下,在第一个交易周内就改善了他们的交易结果。 Entry Points Pro 指标的益处 入场信号无重绘或延迟 如果信号出现,并得到确认(如果信号所在烛条已收盘),则它不会再消失;不像是重绘指标,它会导致重大的财产损失,因为它们可以在显示信号后再将其删除。 无差错开仓 指标算法可令您找到入场交易(买入或卖出资产)的理想时机,从而提高每位交易者的成功率。 Entry Points Pro 可操作任何资产 它允许您在 MT4 平台上交易任何经纪商提供的加密货币、股票、
Quantum Breakout Indicator PRO
Bogdan Ion Puscasu
4.96 (26)
介绍     Quantum Breakout PRO   ,突破性的 MQL5 指标,正在改变您交易突破区域的方式!   Quantum Breakout PRO 由拥有超过 13 年交易经验的经验丰富的交易者团队开发,旨在通过其创新和动态的突破区域策略将您的交易之旅推向新的高度。 量子突破指标将为您提供带有 5 个利润目标区域的突破区域的信号箭头,以及基于突破框的止损建议。 它既适合新手交易者,也适合专业交易者。 量子 EA 通道:       点击这里 MT5版本:   点击这里 重要的!购买后请私信我领取安装手册。 建议: 时间范围:M15 货币对:GBPJPY、EURJPY、USDJPY、NZDUSD、XAUUSD 账户类型:ECN、Raw 或 Razor,点差极低 经纪商时间:GMT +3 经纪商:IC Markets、Pepperstone with Raw 和 Razor 的点差最低 规格: 不重漆! 最多 5 个建议利润目标区域 建议止损水平 可定制的盒子。您可以设置自己的 Box Time Start 和 Box Time E
FX Power MT4 NG
Daniel Stein
5 (8)
通过 mql5 和 Telegram 上 的晨间简报获取每日市场更新,包括详细信息和屏幕截图 ! FX Power MT4 NG 是我们长期以来非常受欢迎的货币强度计算器 FX Power 的下一代产品。 这款下一代强度计算器能提供什么?您所喜爱的原版 FX Power 的所有功能 附加功能 黄金/XAU 强度分析 更精确的计算结果 可单独配置的分析周期 可自定义计算限制,以获得更好的性能 为希望查看更多信息的用户提供特殊的多实例设置 无尽的图形设置,可在每个图表中设置您最喜欢的颜色 无数的通知选项,让您再也不会错过任何重要信息 采用 Windows 11 和 macOS 风格的全新圆角设计 神奇的移动指标面板 FX Power 主要功能 所有主要货币的完整强势历史 所有时间框架内的货币强弱历史 所有经纪商和图表的计算结果完全相同 100% 可靠的实时计算 -> 无重绘 可通过下拉列表选择分析时段 通过自定义模式单独配置分析时段 可在一个图表中使用多个实例 可移动 FX Power 显示屏(通过拖放) 适用于高分辨率 QHD、UHD 和 4K 显示器 自动终端配置 针对平板电脑
Advanced Currency IMPULSE with ALERT
Bernhard Schweigert
4.91 (493)
目前31%的折扣!! 对任何新手或专家交易者来说都是最好的解决方案! 这个指标是一个独特的、高质量的、负担得起的交易工具,因为我们已经纳入了一些专有的功能和一个秘密的公式。只需一张图表,它就能给出所有28种货币对的警报。想象一下,你的交易将如何改善,因为你能够准确地确定新趋势或剥头皮机会的触发点 建立在新的基础算法上,它使识别和确认潜在交易变得更加容易。这是因为它以图形方式显示了一种货币的强势或弱势是否正在加速,并测量了这种加速的速度--把它想象成你汽车中的速度表。当你加速时,事情显然会发生得更快,这在外汇市场上也是一样的,即如果你配对的货币正在向相反的方向加速,你就会发现一个潜在的有利可图的交易。 货币动量的垂直线和箭头将指导你的交易! 动态的市场斐波那契23水平被用作警报触发器,将适应市场活动。如果冲动触及黄色触发线,您将在MetaTrader或您的电子邮件或推送警报中收到警报。然后你就知道作为一个交易员应该做什么。货币对和方向已经给出。只要点击警报按钮,就可以切换到该货币对或打开一个新的图表,以便进一步分析。警报级别可以通过用户输入来改变,可以选择3个敏感度级别
Shepherd Harmonic Pattern
Abdullah Alrai
4.68 (59)
这个指标将检测手动和自动方法在图表上绘制的谐波模式。 您可以从此链接查看用户手册: 添加您的评论并联系我们以获得它 有一个免费版本可以在mt4上尝试此产品。 您可以使用它来检测Gartley和Nenstar模式: https://www.mql5.com/en/market/product/30181 您可以从以下链接购买完整的MT4版本: https://www.mql5.com/en/market/product/15212 注意 指标具有控制面板,并将保存每个(图表和时间框架)设置。 您可以将其最小化以在图表上获得更多空间,并且如果您更喜欢使用其他分析工具,则可以按关闭按钮隐藏所有指标数据 当您使用此指标并更改设置,添加诸如移动平均线或布林带之类的指标时,此指标将自动保存您的模板编辑,并且您可以随时加载它们。 如果您使用的是Windows 10,请右键单击MetaTrader图标>兼容性>更改高DPI设置>系统(增强)以获得最佳屏幕设置(应在高清设备中完成)。 指标只是谐波交易理论的解释,用于检测图表上的谐波模式。 如果您想学习它,可以搜索Scott Carney的书,名为“Ha
FX Volume
Daniel Stein
4.6 (35)
通过 mql5 和 Telegram 上 的 " 晨间简报 "获取每日市场更新,包括详细信息和屏幕截图 ! 外汇交易量(FX Volume)是第一个也是唯一一个从经纪商角度真正洞察市场情绪的交易量指标。 直接在您的图表上看到这些信息是真正改变游戏规则和突破性的交易解决方案。 受益于独特的市场数据洞察,如 比率(Ratios )显示货币多头和空头头寸的比率(百分比 比率变化 显示所选时间段内的多头比率及其百分比变化 总交易量 显示货币的总交易量(多头和空头),以手为单位 多头 交易量显示货币所有多头头寸的交易量 空头 交易量显示所有货币空头头寸的交易量 净多头 显示净多头交易量,即所有多头头寸减去所有空头头寸(以手为单位)。 净多头百分比 显示货币净多头交易量的变化 请阅读我们的基本教程 -> "如何使用外汇交易量进行交易 " 获取更多信息,如常见问题、交易技巧和教程视频,请访问我们的 外汇交易量公共信息频道 请 安装并运行 SI Connect 以建立与我们数据中心的持续连接 背景信息 我们都知道,外汇是一个分散的市场。这就是为什么我们必须打破常规思维,开发一个独
首先值得强调的是,这个交易系统是一个不重绘、不重画和不滞后的指标,这使它非常适合专业交易。 “智能支撑和阻力交易系统”是专为新手和经验丰富的交易者量身定制的先进指标。它赋予交易者在外汇市场上精确和自信的能力。这个综合系统结合了7+种策略、10个指标和各种交易方法,包括日内交易策略、波段交易策略、支撑和阻力策略、蜡烛图模式策略、VWAP策略、多时间段趋势策略等。它提供箭头信号、入场和出场点、交易警报、更高时间框架的趋势分析、实时交易监控以及见解深刻的趋势和成交量蜡烛染色。通过自动支撑和阻力检测,这是一个多面手的指标,帮助交易者在不同的市场条件下做出明智的决策。 “智能支撑和阻力交易系统”是一个强大的技术分析方法,融合了一套高端和强大的指标和工具。在其核心,这个系统识别关键的支撑和阻力水平,这些水平作为潜在市场反转或延续的关键区域。该系统无缝集成了多时间框架趋势面板,增强了交易者在不同时间框架下评估当前趋势方向的能力。此外,蜡烛图模式检测器扫描价格图表以获取重要的蜡烛图模式,为潜在的市场走势提供宝贵的见解。此外,VWAP(成交量加权平均价格)的加入帮助交易者评估市场情绪和日内趋势
How to use Pair Trading Station Pair Trading Station is recommended for H1 time frame and you can use it for any currency pairs. To generate buy and sell signal, follow few steps below to apply Pair Trading Station to your MetaTrader terminal. When you load Pair Trading Station on your chart, Pair Trading station will assess available historical data in your MetaTrader platforms for each currency pair. On your chart, the amount of historical data available will be displayed for each currency pai
Cycle Sniper
Elmira Memish
4.4 (35)
NEW YEAR SALE PRICE FOR LIMITED TIME!!! Please contact us after your purchase and we will send you the complimentary indicators to complete the system Cycle Sniper is not a holy grail but when you use it in a system which is explained in the videos, you will feel the difference. If you are not willing to focus on the charts designed with Cycle Sniper and other free tools we provide, we recommend not buying this indicator. We recommend watching the videos about the indiactor and system before pu
PTS Precision Index Oscillator V2
PrecisionTradingSystems
5 (1)
精密指数振荡器(Pi-Osc)由Precision Trading Systems的Roger Medcalf开发 版本2经过精心重新编码,以在您的图表上加载速度非常快,还加入了一些其他技术改进,以提高体验。 Pi-Osc旨在提供准确的交易定时信号,旨在找到极端的耗尽点,这些点是市场被迫去触及,以清理每个人的止损单。 该产品解决了一个古老的问题,即知道极端点在哪里,这使得交易员的生活变得更加简单。 这是一个高度复杂的共识指标,与行业标准的振荡器相比,具有一些强大的区别。 它使用的一些特征包括需求指数、资金流动、RSI、随机指标、模式识别、成交量分析、标准偏差极端点以及不同长度上述各种变化的分歧。 乍一看,对于未经培训的人来说,它似乎与任何其他振荡器没有什么不同,但当与其他振荡器(如RSI或动量等)相对比时,这个指标的真正威力开始显现。 据我所知,没有其他振荡器可以频繁地精确指出顶部和底部,具有相同的定期效率。 精密指数振荡器由许多不同的数学方程组成,用于测量多个时间框架采样中的价格和成交量变动,从而高度准确地预测趋势可能发生转折的位置。 PTS P
TakePropips Donchian Trend Pro
Eric John Pajarillaga Aldana
4.82 (17)
TakePropips Donchian Trend Pro   (MT4) 是一款功能强大且有效的工具,可使用 Donchian 通道自动检测趋势方向,并为您提供进场和退场交易信号! 这个多功能指标包括趋势扫描器、交易信号、统计面板、筛选器、交易时段和警报历史仪表板。它旨在为您提供交易信号并节省您分析图表的时间! 您可以在我们的博文中下载用户手册和安装指南:   https   :// www.mql5.com/en/blogs/post/751368 今天立减 50%!价格从 98 美元降到 49 美元! 您可以在 Strategy Tester 上测试该指标(启用可视模式)。如果您喜欢在实时图表上进行测试,也可以给我发消息以获取 7 天试用版。 视频教程也可在说明下方获得更多详细信息。 如果您有任何问题或需要任何帮助,请与我联系。 TakePropips Donchian Trend Pro 指标适用于所有外汇对、金属、商品、指数和加密货币。 主要特点 交易信号 - 检测多个时间范围内所有货币对的买卖机会。它将为您提供警报并在图表上绘制交易信号,最多 3 个止盈价和一个止
PTS Divergence Buy Finder
PrecisionTradingSystems
PTS - Divergence Buy Finder 由Precision Trading Systems制作 Precision Divergence Finder旨在精确找到市场底部,并经常成功。在技术分析中,挑选底部通常比挑选顶部容易得多,这个工具正是为了完成这个任务而设计的。在识别出牛市背离后,等待趋势上升再购买是明智的。您可以使用10或20个周期的最高点进场,或者使用15-30周期的移动平均线上升来识别趋势变化。 这个复杂的算法会实时逐根柱状图寻找并计算活跃的需求指数背离的数量。 该模型观察市场价格何时创出新低,而需求指数未创新低,从而产生背离。 该指标使用两个设置。     • 需求指数(DI)长度,它将为指标提供寻找的对象,并将为您选择的长度上的任何DI背离进行查找。     • 差异,这是[DI值现在]与[DI值长达200个周期以前]之间的背离量,对于它从各种回望期间找到的每个背离,它将在指标窗口中生成[1]输出。 最多检查20个周期,最大输出值将显示为20。 建议的设置 需求指数长度从15到100都可以使用,但最佳范围在20到60之间。 背离的差异为0.1至2
PTS Divergence Sell Finder V2
PrecisionTradingSystems
PTS Divergence Finder Sell Indicator(Roger Medcalf出品) - Precision Trading Systems。 该指标只提供看跌 - 卖出信号。 首先,我多次被问及为什么多年来一直提供买入信号的差异指标,而没有提供卖出差异指标。 我回答说,卖出差异信号不如买入差异信号可靠,这仍然是事实。 我们找到了一些解决办法,不是屈服于同行的压力,也不是修改我在十五年前制作的这个指标,而是通过更改默认设置来使其更加严格。 PTS差异查找器卖出指标是如何工作的? PTS差异查找器卖出指标准确测量了发生在需求指数中的差异数量,这是一个基于成交量的指标。由于MT4提供的是交易量而不是成交量,因此基础需求指数指标中发生的波动大约要小10倍,因此必须减小下面所述的差异输入。 这是一个子图二的柱状图样式指标,它绘制出看起来像是从底部升起的石笋一样的尖峰。 该指标检查了您指定的长度的基于成交量的需求指数指标的多个回溯期。它找到了价格中的高点,其中DI没有形成新的“局部”高点,并且与您输入的“差异”设置相差较远。 在众多人投票市场方向的流动市场中,效果最好。 每
Up down v6T
Guner Koca
5 (1)
Thise indicator is up down v6  comes with tradingwiev version. purchased people, after installed on terminal ,contact me on mql5  to get BONUS  TradingView version. up-down indicator is no repaint and works all pairs and lower than weekly time frames charts. it is suitable also 1 m charts for all pairs. and hold long way to signal. dont gives too many signals. when red histogram cross trigger line that is up signal.and price probably will down when blue histogram cross trigger line that is dow
Price Action Entry Alerts
Stephen Sanjeeve Sahayam
5 (3)
该指标筛选每个柱的买入或卖出压力,并识别 4 种具有最高交易量的蜡烛形态。然后使用多个线性过滤器过滤这些蜡烛以显示买入或卖出信号。结合更高的时间框架方向以及在高交易量时段进行交易时,信号效果最佳。所有过滤器都是可定制的并且独立工作。单击按钮即可查看单个方向的信号。 该指标还包含最重要的价格行为和智能货币概念,可以帮助您的决策过程。 信号和交易教育集于一工具之中。 特征 : 信号不会重新绘制。 识别吞没蜡烛、拒绝蜡烛、扩展范围蜡烛和 Pinbar 蜡烛。 显示每个有效信号的多个入场点、止损和多个止盈水平。 按高容量会话进行过滤。 按支撑/阻力位和蜡烛结构过滤。 按 MACD 柱状图过滤。 ICT 买方和卖方流动性水平(亚洲突袭/伦敦突袭/犹大摇摆)。 洁净空间或间隙检测。 识别停止搜寻级别。 基于纯粹的价格行为自动绘制支撑/阻力位。 前一日高点和前日低点。 心理数字和整点、半点和四分之一点的图表水平。 显示基于动态移动平均线的价格交叉和回调。 每日开盘价。 识别 HH、HL、LL 和 LH 点。 内置蜡烛倒计时和符号传播。 内置损益信息面板。 私人导师小组访问。 包括教育、分析和支
Blahtech Market Profile
Blahtech Limited
4.61 (18)
Was: $249  Now: $99   Market Profile defines a number of day types that can help the trader to determine market behaviour. A key feature is the Value Area, representing the range of price action where 70% of trading took place. Understanding the Value Area can give traders valuable insight into market direction and establish the higher odds trade. It is an excellent addition to any system you may be using. Blahtech Limited presents their Market Profile indicator for the MetaTrader community. Ins
XQ Indicator MetaTrader 4
Marzena Maria Szmit
3 (2)
Step into the realm of Forex trading with confidence and precision using XQ, a cutting-edge Forex indicator designed to elevate your trading game to unprecedented heights. Whether you're a seasoned trader or just stepping into the world of currency exchange,   XQ Forex Indicator   empowers you with the insights and signals needed to make informed trading decisions. The signal conditions are a combination of three indicators, and XQ Forex Indicator only display  medium and long-term trends . The
Currency Strength Exotics
Bernhard Schweigert
4.88 (33)
目前8折优惠! 对任何新手或专家交易者来说都是最好的解决方案! 这个指标是专门用来显示任何符号的货币强度,如异国货币对、商品、指数或期货。它是同类产品中的第一个,任何符号都可以添加到第9行,以显示黄金、白银、石油、DAX、US30、MXN、TRY、CNH等的真实货币强度。这是一个独特的、高质量的、负担得起的交易工具,因为我们已经纳入了一些专有的功能和一个新的公式。想象一下,你的交易将如何改善,因为你能够准确地确定新趋势或剥头皮机会的触发点? 用户手册:点击这里   https://www.mql5.com/en/blogs/post/708876 它适用于所有时间框架。你将很快能够看到TREND! 根据新的基础算法设计,它使识别和确认潜在交易变得更加容易。这是因为它以图形方式显示了8种主要货币和一种符号的强弱。 该指标显示了8种主要货币(澳元加元瑞士法郎欧元英镑日元新西兰美元)的强弱线,再加上一个符号! 该指标显示了符号的真实价值。例如:对于XAUUSD(黄金):价格以美元报价。如果黄金在上涨,你怎么能知道是黄金的强势还是美元的弱势?只有当黄金走强时,我们才会进行
介绍 ON Trade Waves Patterns Harmonic Elliot Wolfe,这是一款高级指标,旨在使用手动和自动方法检测各种市场模式。以下是它的工作原理: 谐波模式: 该指标可以识别出现在您图表上的谐波模式。这些模式对于练习谐波交易理论的交易者非常重要,正如Scott Carney的书《谐波交易第1卷和第2卷》所描述的那样。无论您是手动绘制它们还是依赖自动检测,ON Trade Waves Patterns都可以胜任。 控制面板: 我们配备了一个用户友好的控制面板,它会保存您的图表和时间帧设置,使您可以轻松切换不同配置。您甚至可以最小化它以最大化图表空间。如果您更喜欢使用其他分析工具,只需单击关闭按钮即可隐藏所有指标数据。 模板保存: 当您自定义设置或添加其他指标,如移动平均线或布林带时,该指标会自动保存您的模板。这意味着您可以随时轻松加载您喜欢的设置。 优化显示: 对于Windows 10用户,我们建议调整您的DPI设置以获得高清设备上的最佳屏幕体验。右键单击MetaTrader图标,选择“兼容性”,然后选择“更改高DPI设置”,将其设置为“系统(增强)”。
Band trend indicator
lizhi fu
4.39 (23)
一款可以直观识别波段趋势的顶底指标,手工交易最佳选择,不重绘不漂移。 如何免费获得此指标: 了解更多信息 每间隔三天涨价$20元,涨价过程: 79--> 99 --> 119...... 涨到目标价 $ 1000为止。 适应任何新手和量化交易的朋友,可以把信号写入到EA中自由发挥,数组3和数组4,例:3>4为变绿,3<4为变红,如有不懂的请联系我。 参数简介: KQuantity  显示历史K线的数量 InpPeriod_3 指标获取范围参数 Popupalarm 弹窗报警开关 Mailalarm 邮件报警开关 AlarmTimeinterval  每报警一次的间隔时间 Upperhorizontalline 上方水平线参数 Lowerhorizontalline 下方水平线参数 ===================分析方法:===================== buy: 指标绿柱在下方水平线下,由红柱变成绿柱确定做buy。 sell:指标红柱在上方水平线上,由绿柱变成红柱确定做sell。
作者的更多信息
TripleS
Ahmet Metin Yilmaz
5 (1)
3S indicator  designed for trend detection without the effect of accidental price leaps. It uses Price Series and a few moving averages for noise reduction. It works on multiple timeframes, even M1. To increase effectiveness, it is recommended to use default parameters for M1 graphic (see screenshots). You can change settings for other time frames. Example of using this indicator : If  Gold  cross to  Blue  down and both gold and blue under the  Gray ,  it could be a promising sell signal . To
EwoMov
Ahmet Metin Yilmaz
EwoMov 指标对于确定具有较高价格移动平均线周期(应高于 200)的趋势非常有用。 我在 M5-M30 图表上使用该指标进行波段交易。 该指标使用多个柱进行计算。它们都保存在外部参数中。正确的值为 5 - 13 - 34,但您可以更改它们。 它已为所有时间范围做好准备,但对 M5-H1 尽力而为。它旨在针对其他时间范围进行优化。 您可以在屏幕截图中找到一些说明。要使用它,找到 EWO 线、信号线和零线的交叉点,并结合您的最佳趋势指标,您可以确定入场点。 有关我的产品的更多信息,您可以通过 pm 与我联系。或电子邮件。  EwoMov 指标对于确定具有较高价格移动平均线周期(应高于 200)的趋势非常有用。 我在 M5-M30 图表上使用该指标进行波段交易。 该指标使用多个柱进行计算。它们都保存在外部参数中。正确的值为 5 - 13 - 34,但您可以更改它们。 它已为所有时间范围做好准备,但对 M5-H1 尽力而为。它旨在针对其他时间范围进行优化。 您可以在屏幕截图中找到一些说明。要使用它,找到 EWO 线、信号线和零线的交叉点,并结合您的最佳
Mighty Scalper
Ahmet Metin Yilmaz
Mighty Scalper LightEA A Trend Friendly EA There are different and complex logic mixed in it It begins to work, simply with a BreakOut strategy and Works in PARTIAL CLOSE and CLOSE TIME LIMIT you had never seen before in the market expert... It opens an order and use partial close in a specific levels and close order within a specific time ( if order still live ) No Martingale and hedging It works any kind of broker, but lower spread gets more gain Fast optimization for strategy tester ( for
ForexEA HMA
Ahmet Metin Yilmaz
This EA uses  Non-Repaint Hull Moving Averages calculation. You can find positive results with the correct optimization. Optimization should be adjusted according to the properties of the broker you are using and your trading institution. Default settings are optimized for AUDUSD in an ECN broker for M30 time frame. (Remember, it is necessary to re-optimize your brokers for the settings.) Test it before buying for your broker settings if it is ok, It is recommended use rental option to be sure
GreatGigInTheSky
Ahmet Metin Yilmaz
The Great Gig In The Sky is an expert advisor and also a song from My favorite Rock Band's. Pink Floyd.  There is only one input parameter. Lots amount. You know what do you do in there. Try in a demo account from your real broker to test. Expert logic also includes stop loss and take profit transactions. Do not worry about them. The one-month rental period is only for you to try the experiment and is valid for limited copy. Tested and Preferred pairs are GBPJPY, CHFJPY,CADJPY. I am still contin
HMA Nrp
Ahmet Metin Yilmaz
Alan Hull's moving average, more sensitive to the current price activity than the normal MA. Reacts to the trend changes faster, displays the price movement more clearly. No Repaint Version on separate Windows shows the trend 1 and -1 . Improvement of the original version of the indicator by WizardSerg <wizardserg@mail.ru>. Suitable for all timeframes. Parameters Period - period, recommended values are from 9 to 64. The greater the period, the smoother the indicator. Method - method, suitable
XLineBreak
Ahmet Metin Yilmaz
5 (1)
該指標使用輸入參數柱檢測策略檢測突破。 您可以使用 WaitForBarClosed 函數來確認信號 (true),但它有時會比 false 晚一點激活。 該指標在單獨的窗口中打開。 適用於所有時間範圍和貨幣對。 藍線表示趨勢方向。 將指標附加到任何圖表 在彈出的指標對話框的輸入選項卡中選擇所需的輸入。 選擇確定以確認並繼續。 參數 Lines_Break:Period,推薦值為3~21,period越大指標越平滑。 WaitForBarClosed:“真”或“假”。 您可以通過更嚴格的止損和較小的獲利水平使用“false”作為較早的信號。 您可以使用“true”來確認信號。 查看同時使用 true 和 false 選項的屏幕截圖。 该指标使用输入参数柱检测策略检测突破。 您可以使用 WaitForBarClosed 函数来确认信号 (true),但它有时会比 false 晚一点激活。 该指标在单独的窗口中打开。 适用于所有时间范围和货币对。 蓝线表示趋势方向。 将指标附加到任何图表 在弹出的指标对话框的输入选项卡中选择所需的输入。 选择确定以确认并继续。 参
OneWayTicket
Ahmet Metin Yilmaz
OneWayTicket indicator is based on CCI indicator. In fact, it analyzes multiple CCIs from several timeframes. There are four Ways of OneWayTicket, read from left to right - 15 min, 30 min, 1 hour and 4 hours. The idea is to enter the market when all four CCIs agree on a trend. A trader chooses which timeframes to monitor. When all four ways of the OneWayTicket are green - Buy . When all four ways of the OneWayTicket are bright red - Sell . Original idea from the author: tageiger, revised for the
AccountInfo
Ahmet Metin Yilmaz
This Script Shows your Account & Symbol information which you use on your graphics. These are: Account Information Number Name Currency Server Leverage Stop Out Level Balance Information Balance Equity Margin Free Margin Symbol Information Symbol Lot Size Min.Lot Lot Step Max.Lot Tick Value Tick Size Spread Stop Loss Level Swap Long Swap Short Initial Margin Maint.Margin Required Margin Trade Allowed
Virtue
Ahmet Metin Yilmaz
"Virtue" is a fully automated Long term Expert Advisor. It calculates market condition itself and decides to enter a position. "Virtue" needs patience that is the why its name Virtue. Patience is a virtue. You must be patient to make some Money. You have to wait for it to find optimal conditions to open an order. It will be enough to just install it on the platform. No need to optimize many parameters. Expert is optimized for EURUSD H1 timeframe. First download demo and test it for your broker.
VirtueMultiLot
Ahmet Metin Yilmaz
Virtue Multi Lot   "Virtue" is a fully automated Long term Expert Advisor. It calculates market condition itself and decides to enter a position. This is the main position. After that position, it adds some small lots for scalping. You can select how many orders will be open extra. It depends on your account margin and risk managment. "Virtue" needs patience that is the why its name Virtue. Patience is a virtue. You must be patient to make some Money. You have to be wait it find optimal condit
JapaneseBreakout
Ahmet Metin Yilmaz
Instructions Attach the indicator to any chart (advised H4) Use input tabs (defaults are 5 and false ) Press ok and continue trading. Description The indicator uses a kind of pattern breakout strategy to help your trading strategy. I am using this strategy on H4 charts for many of pairs with a trailing stop and default indicator settings. Better results are shown on USDJPY, EURJPY, CADJPY, EURGBP, EURUSD, USDCAD, USDCHF, NZDUSD and GBPUSD. Trailing stops should be different for each pair. The
PriceChannel
Ahmet Metin Yilmaz
PriceChannel is designed for trend detection without the effect of accidental price leaps. It uses Price Series and a few moving averages for noise reduction. It works on multiple timeframes, even M1. To increase effectiveness, it is recommended to use 3 instances of PriceChannel with different parameters on one chart (see screenshots). You can use the following settings (for M1 charts): PriceChannel(10,2,30) Gold colour. PriceChannel(10,5,30) Blue colour. PriceChannel(21,8,13) Gray colour. Exa
VoMa
Ahmet Metin Yilmaz
Variation of Moving Averages indicator is calculated as the difference between different periods of moving averages. Obtained result filtered by another MA. It displays more precise signals of divergences between prices and the value of the indicator. It emphasizes price extremums more precisely, it moves faster. There are three inputs FastMA: Default is 13, shows MA period. SlowMA: Default is 21, shows MA period. SignalMA: Default is 8, shows MA period. It basically detects the trend, advised
Price Volume
Ahmet Metin Yilmaz
This indicator calculates price movement with the Volume. The Volume indicates the number of deals in the desired period, but does not show number of contracts per deal. From this point of view, the tick does not reflect the true volume. However it is a valuable demand indicator. Volume and price are calculated with a special formula. There are 3 input parameters EMAPeriod: Price and volume data are calculated using this period of Moving Average first. DEMAPeriod: Results of first EMA, recalcu
Doma
Ahmet Metin Yilmaz
Differences of Moving Averages This indicator plots short term trend with two moving averages difference and its signal line. Best result at 5 min chart in default parameters. There are 7 extern input parameters: MaShortPeriod: period of the first MA. MaLongPeriod: period of the second MA. ModeDoMA: DoMA method. ModePrc: MA price mode. SignalMaPeriod: Period of Signal MA. ModeSma: Signal MA mode. LabelLevel: Horizontal line level on display. Default parameters can be changed by user.
HighLowOpenClose
Ahmet Metin Yilmaz
HLOC Trend Indicator This indicator helps you to determine trend direction on your trade. Default parameters for H1 time frame. You can use this indicator both bigger time frame and smaller time frame to open a trade. The calculation is based on high, low, opening and closing price values of each bar in the selected time period. When the values found in the Indicator custom formula are exceeded, the buy or sell signal falls on the screen. There are two extern inputs; RiskFactor: Early but risky
HLOCTrend
Ahmet Metin Yilmaz
HLOC Trend Indicator This indicator helps you to determine trend direction on your trade. Default parameters for H1 time frame. You can use this indicator both bigger time frame and smaller time frame to open a trade. The calculation is based on high, low, opening and closing price values of each bar in the selected time period. When the values found in the Indicator custom formula are exceeded, the buy or sell signal falls on the screen. There are two extern inputs; RiskFactor: Early but risky
MTF Linear Regression
Ahmet Metin Yilmaz
This indicator shows Linear Regression Line and it's channels which calculated with fibo numbers. You can use this indicator in different timeframes on your chosen timeframe chart. You only need to attach this indicator on the chart twice or more with a different colors to do this.  There are 6 input parameters; period      : you can choose regression timeframe independent of chart timeframe. linewidth : width of line on the chart. bars back regression begin : calculated regression bar count. LR
CurrencyAdviser
Ahmet Metin Yilmaz
This indicator examines the relative strengths of the currencies of 8 different countries and displays the one that has the potential to gain profit in the short term as a suggestion. The relative strength of each country's currency over the selected time period is shown on the graph as a percentage. The recommended currency according to BuyLevel and SellLevel determined by the user is shown in the bottom right section. The indicator also automatically brings up the 30-minute graph of the sugge
PriceActionSignals
Ahmet Metin Yilmaz
Price Action Signals generates buy and sell signals with price close and complex logic. You can use it different timeframes and pairs.  Best results are on M30 and H1 charts with default parameter. You can change this parameter ( nFrequency ) for other timeframes. ( except M1 timeframe ) There is only one extern input: nFrequency: It determines signal frequency. Default is 0.004. You can use this arrow for Expert Advisors. Upsignal: iCustom(......"PriceActionSignals", buffer nr:0 ) Downsignal :
ATR Channels
Ahmet Metin Yilmaz
ATR Channel is an indicator. It shows us ATR ( depends on selected period ) Line on main chart. It also draw 3 up ATR channels (ATRu) and 3 down ATR channels (ATRd) on the same window. All they helps you to trade with a ATR indicator. There are 6 extern inputs; PeriodsATR   : You can change ATR Period default is 13. MA_Periods   : Use for draw ATR channels MA periods. Default is 34. MA_Type       : You can change MA_method here. Default is Linear weighted. Mult_Factor1 : It is for first up and d
PriceRunner
Ahmet Metin Yilmaz
5 (1)
PriceRunner 指标专为趋势检测而设计,不受意外价格飞跃的影响。 它使用价格系列和一些移动平均线来降低噪音。 它适用于多个时间范围,甚至是 M1。 为了提高效率,建议对 M1 图形使用默认参数(见屏幕截图)。 您可以更改其他时间范围的设置。 使用此指标的示例:如果黄金向下交叉至蓝色,并且黄金和蓝色均低于灰色,则可能是一个有希望的卖出信号。 要从此指标获取信号(对于专业专家用户):黄金:缓冲区编号。 0,蓝色:缓冲区编号。 1,灰色:缓冲区编号。 2个 该指标使用相同的逻辑并计算“TripleS 指标”,但它在单独的窗口中绘制,而不是在图表窗口中绘制。如果您之前卖过“TripleS 指标”,我不建议您也卖掉它。请先查看屏幕截图并对其演示进行测试。 输入参数 Period:回溯期,默认为10。 Period2:回溯期,默认为10。 Period3:回溯期,默认为21。 xfast:快速 MA,默认为 2。 xfast2:快速 MA,默认为 5。 xfast3:快速 MA,默认为 8。 xslow:慢 MA,默认为 30。 xslow2:慢速均线,默认为 30。 xslow3:
BuySellEA
Ahmet Metin Yilmaz
SrEwo Expert adviser designed and optimized for EURUSD. You may Optimize all other instruments. It is easy to use.  *** It uses only M5 chart graphic and you need to use M5. ( Both test and live ) Input Parameters: Lots: Base lot amount.Expert use this amount as referance.  crossfactorlimit: expert will open new order with this limit modifylimit & TP limit : order modify and another TP limit. targetprofit : expert calculates this number in its logic. crossfactor : next order lots multiply with t
TheGorillaEA
Ahmet Metin Yilmaz
Expert works H1 timeframe only There are two main criteria. Daily pivots and moving averages. To open a buy order, today's daily pivot must greather than the day before's daily pivots.  Moving averages for EURUSD pair as default. They can be changed for other pairs and also for EURUSD too. You can also change takeprofit and stoploss level. expert doesnt trade on mondays and before 2 hour on other trade days. You can test and optimize for all pairs with extern parameters. Do not purchase without
Psr1EA
Ahmet Metin Yilmaz
Psr1 EA is the one of Psr series EAs. It works on 5 minutes chart only. You can use this EA any currencies but you should optimize first. Default parameters belongs to my broker databases EURUSD M5 . It uses pivot  and 2 main moving averages.  Moving averages can be adjustable by user. ( for optimizing ) Input Parameters:  MagicNum: Expert will use this number to determine experts orders. Lots: Lots amount which you want to use. Default is 0.01 ( it can be cahnged by expert due to your broker's
Psr3EA
Ahmet Metin Yilmaz
Psr3 EA is the one of Psr series EAs. It works on 5 minutes chart only. You can use this EA any currencies but you should optimize first. Default parameters belongs to my broker databases EURUSD M5 . It uses pivot  and Support/Resistance Levels.  Stoploss and Takeprofit can be adjustable by user. ( for optimizing ) Input Parameters:  MagicNum: Expert will use this number to determine experts orders. Lots: Lots amount which you want to use. Default is 0.01 ( it can be cahnged by expert due to you
ColorCMI
Ahmet Metin Yilmaz
Indicator values are in the range 0-100. The greater is the indicator value, the greater is the market stability, so the more likely we have trend. The smaller is the indicator value - the less probable the trend is. Tips: Trading on unstable market:     Buy, when moving average (blue line) of the CMI indicator is below 40 and the histogram is red.     Sell when moving average (blue line) of the CMI indicator is below 40 and the histogram is green.     Close positions when CMI his
Signaline
Ahmet Metin Yilmaz
SIGNALINE INDICATOR This indicator for all pairs and all timeframes I have just completed the M5 timeframe for deep optimization EURJPY yet. EURJPY M5 Optimization ( TP=150 , SL=130 , IndicatorPeriod=6 , Mov1=22 , Mov2=48 ) (*)Added 20.05.2019 You can find this signal page below https://www.mql5.com/en/signals/583477 Other optimizasyon results will be added on this signalpage. Input Parameters: IndicatorPeriod: Default is 8. Mov1               : Default is 21. Mov2               : Default is 48.
PureDailyEA
Ahmet Metin Yilmaz
Expert's signal link has been working on 25 different instruments since 09.07.2019. It will be stopped after a while. https://www.mql5.com/en/signals/605823 This expert advisor works well on daily charts. Opens a pending order based on daily price movements and may revise this pending order based on price movements during the day.  It can keep the current order by following the price movements and can open two different types of additional orders as soon as it sees the opportunity. If he sees t
筛选:
无评论
回复评论
版本 1.40 2018.09.26
Fixed a bug