Volumes Color

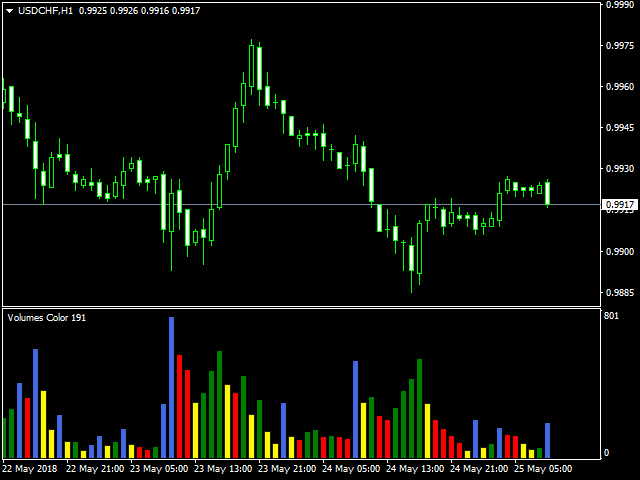
Indicator of tick volumes with the ability to monitor sudden and significant changes in the prices of bars relative to the specified coefficient - Change Factor. The color of the indicator's histogram characterizes the changes in volume of a bar relative to the previous session. By default, the indicator bars are colored in the following colors:

  • Green - a slight increase in volume, not exceeding the Change Factor;
  • Red - a slight decrease in volume, not exceeding the Change Factor;
  • Purple - significant increase in volume, exceeding the Change Factor;
  • Yellow - significant decrease in volume, exceeding the Change Factor;
  • Gray - no change in volumes relative to the previous bar.
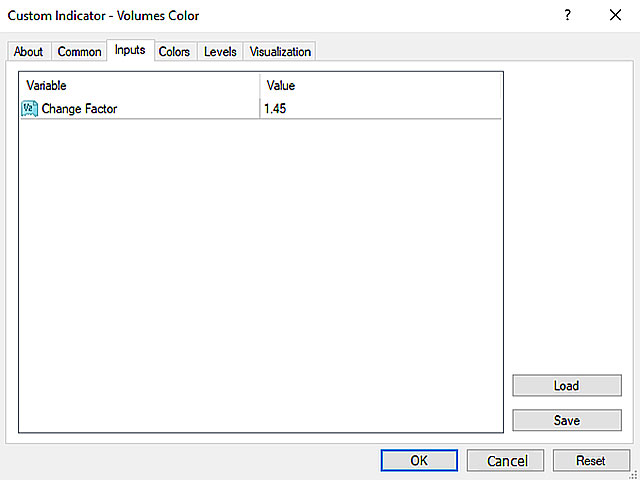

Indicator Inputs

  • Change Factor – volume change factor.

The indicator colors can be customized in the settings. If Change Factor is set to "1" or less, the histogram will be colored similar to the conventional Volumes indicator.

推荐产品
Auto Fibo Pro m
DMITRII GRIDASOV
“Auto FIBO Pro” Crypto_Forex 指标 - 是交易中的绝佳辅助工具! - 指标自动计算并放置在图表斐波那契水平和局部趋势线(红色)上。 - 斐波那契水平指示价格可能反转的关键区域。 - 最重要的水平是 23.6%、38.2%、50% 和 61.8%。 - 您可以将其用于反转剥头皮或区域网格交易。 - 还有很多机会可以使用 Auto FIBO Pro 指标来改进您当前的系统。 - 它具有信息价差掉期显示 - 它显示所连接的外汇对的当前价差和掉期。 - 显示屏还显示账户余额、净值和保证金。 - 可以将信息价差掉期显示定位在图表的任何角落: 0 - 左上角,1 - 右上角,2 - 左下角,3 - 右下角。 点击这里查看高质量的交易机器人和指标! 这是仅在此 MQL5 网站上提供的原创产品。
VR Cub
Vladimir Pastushak
VR Cub 这是获得高质量切入点的指标。该指标的开发是为了促进数学计算并简化对仓位入场点的搜索。多年来,该指标所针对的交易策略已被证明其有效性。交易策略的简单性是其巨大的优势,即使是新手交易者也能成功进行交易。 VR Cub 计算开仓点以及获利和止损目标水平,这显着提高了效率和易用性。查看使用以下策略进行交易的屏幕截图,了解简单的交易规则。 设置、设置文件、演示版本、说明、问题解决,可以从以下位置获取 [博客] 您可以在以下位置阅读或撰写评论 [关联] 版本为 [MetaTrader 5] 计算入场点的规则 开仓 要计算入场点,您需要将 VR Cub 工具从最后一个高点拉伸到最后一个低点。 如果第一个点在时间上早于第二个点,交易者等待柱线收于中线上方。 如果第一个点在时间上晚于第二个点,交易者等待柱线收于中线下方。 根据上述条件,严格在 柱线收盘 后建仓。 换句话说,如果我们在小时图上进行交易,那么从最高点到最低点的时间距离必须超过24小时,最高点和最低点之间的点数必须大于或等于平均价格变动每天。 维持和改变市场地位 可以有多个未平仓头寸;每个头寸都可以单独修改。 VR Cub
Price Magnets
Ivan Simonika
Price Magnet — Price Density and Attraction Levels Indicator Price Magnet is a professional analytical tool designed to identify key support and resistance levels based on statistical Price Density. The indicator analyzes a specified historical period and detects price levels where the market spent the most time. These zones act as “magnets,” attracting price action or forming a structural base for potential reversals. Unlike traditional Volume Profile tools, Price Magnet focuses on price-time d
SMC Venom 模型 BPR 指標是針對在智慧貨幣 (SMC) 概念內工作的交易者的專業工具。它會自動辨識價格圖表上的兩種關鍵模式: FVG (公平價值缺口)是三根蠟燭的組合,其中第一根和第三根蠟燭之間存在缺口。它在水平之間形成一個沒有成交量支撐的區域,這通常會導致價格調整。 BPR (平衡價格區間)是兩種 FVG 模式的組合,形成一個「橋樑」 - 當價格以低成交量活動移動時,突破並返回到水平的區域,從而在蠟燭之間產生間隙。 這些模式可協助交易者透過分析圖表上的交易量和價格動態(大型市場參與者和普通參與者之間的互動)來識別關鍵的支撐/阻力位、突破區域和切入點。 此指標以矩形和箭頭的形式可視化模式,也支援靈活的警報設定。 主要特點: 模式顯示模式:選擇顯示 BPR 模式(看漲和看跌)或 FVG 模式(看漲和看跌)。 可以隱藏所有圖表分析模式。 以條數過濾:BPR 結構中 FVG 之間的最小/最大距離。 訊號的附加視覺化: 箭頭有 9 種類型可供選擇(標準、細、分形等)或手動輸入 Wingdings 代碼,其表格可以選擇性地顯示在圖表上。 使用 ATR 配置顏色、尺寸及其相對於價格
Multicurrency indicator in table format. Signals appear with confirmation, do not redraw. The indicator works on the current (open) timeframe. Notifications come for an open instrument. The strategy includes: price touching the moving average in the direction of the trend, as well as an extraordinary recalculation of the classic ADX indicator to determine the trend as an additional filtering of entries. Entries are displayed on the chart as arrows and, as mentioned above, the arrows are not redr
Gold Titan King Scalper
Dodong Christian Arnon
Indicator Description GOLD TITAN KING SIGNAL INDICATOR High-Precision Gold Scalping Buy/Sell Signals – Manual Trading Assistant Overview The Gold Titan King Signal Indicator is a manual trading assistant tool designed for high-frequency scalping on Gold (XAUUSD) and other major pairs. It generates clear BUY/SELL signals with precise entry levels, along with adjustable Stop Loss and Take Profit levels displayed directly on the chart. ️ This tool is NOT an EA. It does not execute trades
这是一个预测蜡烛收盘价的指标。 该指标主要用于 D1 图表。 该指标适用于传统外汇交易和二元期权交易。 该指标可以用作独立的交易系统,也可以作为您现有交易系统的补充。 该指标分析当前蜡烛,计算蜡烛本身内部的某些强度因素,以及前一根蜡烛的参数。 因此,该指标预测市场走势的进一步方向和当前蜡烛的收盘价。 由于这种方法,该指标既适用于短期盘中交易,也适用于中长期交易。 该指标允许您设置指标在分析市场情况期间将产生的潜在信号的数量。 在指标设置中有一个特殊的参数。 此外,该指标可以通过图表上的消息、电子邮件以及推送通知的形式通知新信号。感谢您的关注!交易愉快! 购买后一定要写信给我! 我会给你我的交易指标的建议! 还可以获得奖金!
TWO PAIRS SQUARE HEDGE METER INDICATOR Try this brilliant 2 pairs square indicator It draws a square wave of the relation between your two inputs symbols when square wave indicates -1 then it is very great opportunity to SELL pair1 and BUY Pair2 when square wave indicates +1 then it is very great opportunity to BUY pair1 and SELL Pair2 the inputs are : 2 pairs of symbols         then index value : i use 20 for M30 charts ( you can try other values : 40/50 for M15 , : 30 for M30 , : 10 for H1 ,
Super Reversal Pattern
Parfait Mujinga Ndalika
Super Reversal Pattern Indicator Unlock the power of advanced pattern recognition with our Super Reversal Pattern Indicator. Designed for traders seeking precision and reliability, this indicator identifies one of the most effective reversal patterns in technical analysis, offering a significant edge in your trading strategy. Key Features: Non-Repainting Accuracy: Enjoy the confidence of non-repainting technology. Once a Super Reversal Pattern is detected, it remains static, providing consiste
限时优惠 “限时发布价格” “2.0版本后将涨价” Currencies Gold Momentum Flow Dashboard — 即刻洞察市场强弱 一款强大的多合一交易面板,实时显示外汇与黄金在多个时间周期(M5–D1)的动量。 多时间周期ROC分析 内置交易信号(趋势一致与动量变化) 货币强弱指标 热力图快速识别趋势 实时提醒 + 一键切换交易品种 无需来回切换图表 — 一个界面掌握整个市场。 像真正看懂市场一样交易 大多数交易者是“盲目的”。 他们不断切换图表… 追逐信号… 入场太晚…离场困惑。 这一切,到此为止。 看到别人看不到的机会 这不仅仅是一个指标。 这是一个“市场透视系统”,帮助你看到: 哪些交易对正在爆发 哪些货币正在主导市场 哪些高概率机会正在形成 为精准交易者打造 提前捕捉动量变化 确认多周期趋势一致 避免震荡行情 专注高质量机会 内置优势 智能信号系统 货币强弱分析 热力图分析 实时提醒 一键执行 彻底改变你的交易方式 交易什么 何时交易 哪个方向概率最高 ️ 大多
Blahtech Market Profile
Blahtech Limited
4.53 (15)
Was: $249  Now: $99   Market Profile defines a number of day types that can help the trader to determine market behaviour. A key feature is the Value Area, representing the range of price action where 70% of trading took place. Understanding the Value Area can give traders valuable insight into market direction and establish the higher odds trade. It is an excellent addition to any system you may be using. Blahtech Limited presents their Market Profile indicator for the MetaTrader community. Ins
Dollar Mint Indicator
David Mwaniki Mbugua
Dollar mint indicator is a special workmanship with years of experience in forex.   Dollar mint ea is a fully non repaint indicator optimised with price action data such that once it gives you a signal t . The indicator   can be used to trade anything on the mt4 with much ease. Benefits ; Fully non repaint Use in any timeframe Use in all the available tradable assets on mt4 Best to use on h4. It generates fully analysed buy and sell signals based on trend and also filters out retracements and
Power Bar Signal Indicator
Gholamreza Ali Samimi Sereshki
Power Bar Signal Indicator 专为合成货币对交易设计的专业级信号指标。通过多步骤验证和实时统计数据,帮助交易者识别高概率信号,表现经过实际验证。 主要功能 多步骤信号验证系统(2/3/4步骤) 针对不同市场条件的自适应信号过滤 实时性能统计仪表板 支持多种时间框架和货币对配置 针对合成/OTC市场优化 工作原理 该指标分析价格行为以识别高胜率信号,提供: 清晰的蓝/红箭头信号指示买卖机会 每个信号的分步胜率统计 图表上实时显示的性能指标 针对不同交易时段的自适应过滤 推荐设置 默认配置: 4步骤验证,Ultra信号开启 欧洲/美国时段(07:00-16:00 UTC): 4步骤验证,Ultra信号开启 亚洲时段(22:00-07:00 UTC): 2-3步骤验证,Ultra信号关闭 性能指标 基于合成货币对测试结果(GBPUSD-OTC M5): 总体胜率:94.8% 第1步胜率:58.6% 第2步胜率:76.9% 第3步胜率:85.7% 第4步胜率:90.5% 使用指南 1. 在MetaTrader 4平台安装指标 2. 应用于您选择的图表 3. 根据当前市场
An indicator of pattern #31 ("Long Island") from Encyclopedia of Chart Patterns by Thomas N. Bulkowski. The second gap is in the opposite direction. Parameters: Alerts - show alert when an arrow appears   Push - send a push notification when an arrow appears (requires configuration in the terminal) GapSize - minimum gap size in points ArrowType - a symbol from 1 to 17 ArrowVShift - vertical shift of arrows in points   ShowLevels - show levels ColUp - color of an upward line ColDn - color of a
Gold Venamax MT4
Sergei Linskii
3 (2)
Gold Venamax   - 這是最好的股票技術指標。 此指標演算法分析資產的價格變動並反映波動性和潛在的進入區域。 指標特點: 這是一個帶有 Magic 和兩個趨勢箭頭塊的超級指標,可實現舒適且有利可圖的交易。 圖表上顯示用於切換方塊的紅色按鈕。 Magic 在指標設定中進行設置,以便您可以將指標安裝在顯示不同區塊的兩個圖表上。 Gold Venamax 可以放置在具有不同箭頭緩衝區(GV 和 SD)的兩個圖表上。 為此,您需要在設定中選擇不同的 Magic,例如,一個具有 Magic = 999,另一個具有 Magic = 666。接下來,您可以使用圖表上的紅色按鈕選擇箭頭緩衝區。 指標設定中的每個箭頭緩衝區(GV и SD)都有一個單獨的箭頭過濾器,以實現舒適且有利可圖的交易(UseFiltrGV = true; 和 UseFiltrSD = true;)。 進入的最佳訊號 = 遵循兩個緩衝區的訊號箭頭(GV 和 SD)+ 所有三個 MA 線(紅色或藍色)的方向 + TMA 通道邊界(下或上) 。 TMA 通道邊界(下限或上限)也可用於鎖定利潤和/或以較短的停損位進行逆
PZ Mean Reversion MT4
PZ TRADING SLU
3 (4)
采用专业和量化方法进行均值回归交易的独特指标。它利用了价格以可预测和可衡量的方式转移并返回均值这一事实,这允许明确的进入和退出规则大大优于非量化交易策略。 [ Installation Guide | Update Guide | Troubleshooting | FAQ | All Products ] 清晰的交易信号 非常容易交易 可定制的颜色和尺寸 实现性能统计 优于大多数交易策略 显示合适的止损和止盈水平 它实现了电子邮件/声音/视觉警报 这个怎么运作 该指标从更高的时间范围测量完全可定制的移动平均线的标准偏差,并使用趋势跟踪方法精确地找到交易。交易是通过深入当前图表的价格行为发现的,并在价格返回到平均价格区间时关闭,根据您选择的更高时间范围计算。由于其编码方式,该指标将远离高波动性和强劲趋势市场,并且仅在可预测的情况下进行交易,在可接受的波动性与方向性比率范围内,回归均值是可行的。 指标剖析 绿线是更高时间范围内的移动平均线(也就是平均值) 虚线区域是移动平均线周围的典型价格区间 蓝线是看涨交易的突破价格 红线是看跌交易的突破价格 交易是针对均值进行的,并在典型的价格
VPPD:Ваш «Рентген» для графика. Простыми словами о сложном Представьте, что рынок — это большое здание. Обычные графики показывают вам только его фасад (цену). **VPPD** — это инструмент, который показывает вам чертежи несущих конструкций и подсчитывает, сколько людей зашли через парадный вход, а сколько вышли через черный. Это индикатор для MetaTrader 4, который показывает, где на самом деле находятся деньги крупных игроков и кто сейчас рулит рынком: покупатели или продавцы.   В чем суть
Trend Ray
Andriy Sydoruk
The indicator shows the potential trend direction by cyclical-wave dependence. Thus, all the rays of the intersection will be optimal rays, in the direction of which the price is expected to move, taking into account the indicator period. Rays can be used as a direction for potential market movement. But we must not forget that the approach must be comprehensive, the indicator signals require additional information to enter the market.
MA Alignment Scanner
Benedict Jamora
5 (1)
This indicator scans and displays currency pairs that have recently aligned moving averages on a given timeframe. You can configure which pairs the indicator will scan. It also includes all types of alert options. Bullish MA Alignment =  MA1>MA2>MA3>MA4>MA5 Bearish MA Alignment =  MA1<MA2<MA3<MA4<MA5 Features Attach to one chart and scans all the currency pairs configured and visible in the Market Watch Window It can monitor all the available timeframes from M1 to MN1 and sends alerts on every
Laguerre SuperTrend Clouds adds an Adaptive Laguerre averaging algorithm and alerts to the widely popular SuperTrend indicator. As the name suggests, Laguerre SuperTrend Clouds (LSC) is a trending indicator which works best in trendy (not choppy) markets. The SuperTrend is an extremely popular indicator for intraday and daily trading, and can be used on any timeframe. Incorporating Laguerre's equation to this can facilitate more robust trend detection and smoother filters. The LSC uses the impro
History Pattern Search
Yevhenii Levchenko
该指标建立当前报价,可以与历史报价进行比较,并在此基础上进行价格走势预测。指示器有一个文本字段,用于快速导航到所需日期。 选项: 符号 - 选择指标将显示的符号; SymbolPeriod - 选择指标从中获取数据的时段; IndicatorColor - 指示器颜色; HorisontalShift - 由指标绘制的报价移动指定的柱数; Inverse - true 反转引号,false - 原始视图; ChartVerticalShiftStep - 图表垂直移动(键盘上的向上/向下箭头); 接下来是文本字段的设置,您可以在其中输入日期,您可以通过按“回车”立即跳转到该日期。 接下来是文本字段的设置,您可以在其中输入日期,您可以通过按“回车”立即跳转到该日期。
Market Profile 3
Hussien Abdeltwab Hussien Ryad
3 (2)
Market Profile 3 MetaTrader 4 indicator  — is a classic Market Profile implementation that can show the price density over time, outlining the most important price levels, value area, and control value of a given trading session. This indicator can be attached to timeframes between M1 and D1 and will show the Market Profile for daily, weekly, monthly, or even intraday sessions. Lower timeframes offer higher precision. Higher timeframes are recommended for better visibility. It is also possible t
FREE
This is a new strategy for SUPPLY DEMAND areas It is based on a calculation using the tick volume to detect the big price action in market for both bear /bull actions this smart volume action candles are used to determine the supply and demand areas prices in between main supply and demand lines indicate sideway market  up arrows will be shown when prices moves above the main supply and the secondary supply lines Down arrows will be shown when prices moves below the main demand and the secondary
Trend PA
Mikhail Nazarenko
5 (3)
The Trend PA indicator uses   Price Action   and its own filtering algorithm to determine the trend. This approach helps to accurately determine entry points and the current trend on any timeframe. The indicator uses its own algorithm for analyzing price changes and Price Action. Which gives you the advantage of recognizing, without delay, a new nascent trend with fewer false positives. Trend filtering conditions can be selected in the settings individually for your trading style. The indicator
Trend Oscillator mw
DMITRII GRIDASOV
趋势振荡器 - 是一种高级自定义 Crypto_Forex 指标,高效的交易工具! - 使用高级新计算方法 - 参数“计算价格”有 20 个选项。 - 有史以来最平滑的振荡器。 - 绿色表示上升趋势,红色表示下降趋势。 - 超卖值:低于 5,超买值:超过 95。 - 使用此指标,有很多机会升级标准策略。 - 具有 PC 和移动警报。 ....................................................................................................................... 点击这里查看高质量的交易机器人和指标! 这是仅在此 MQL5 网站上提供的原创产品。
Phase Analytics Pro: Advanced Cyclic Market Analyzer Phase Analytics Pro is a sophisticated technical tool designed for traders who prioritize mathematical precision over lag-heavy traditional indicators. Based on the principles of digital signal processing, this indicator decomposes price action into phase and quadrature components to identify the dominant market cycle. How it works: The algorithm calculates the instantaneous phase of the market, allowing it to distinguish between trending and
Pattern Searching
Kourosh Hossein Davallou
Pattern Searching: Smart, Precise, & Customizable for MT4!  Are you looking for a powerful tool to quickly and accurately identify trading patterns in Forex? This advanced indicator for MetaTrader 4 (MT4) is exactly what you need!  Key Features That Will Amaze You:  Automatic Classic Pattern Detection: This indicator automatically finds the closest classic Forex patterns for you. Whether you're looking for Smart Money Concepts (SMC) or NDS strategies, this tool covers it all!   * Popular patt
Diamond Trend
Segundo Calvo Munoz
Indicator which identifies Trend and also buy/sell opportunities. Use for entries aligned to the Trend.  Although Diamond Trend is very accurate identifying entry points, it is always recommended to use a support indicator in order to reconfirm the operation. Remind to look for those Assets and Timeframes which best fit to your trader behavior/need... Valid for Scalping and Long Term operations. Please, set up a Bars Chart to be able to visualize the indicator properly...  ...And remind to give
RiverScope Lite automatically determines the nearest most important price levels and support and resistance zones in history, it also identifies a large number of price action patterns (the lite version is limited to 10, while the full version has 30+). The support and resistance levels are determined based on an algorithm that calculates and filters the historical values of the price, its movement character, volumes, etc. It displays the current situation, therefore the nearest levels change in
Price manipulation risk mt4
Vincent Albert Feugier
Price Manipulation Risk Indicator Advanced Tool for Market Risk Evaluation & Manipulation Detection Price Manipulation Risk Indicator is a professional tool designed to measure the current risk level in the market. It evaluates price behavior, market activity, and candle dynamics to detect unstable or potentially manipulated environments. This indicator helps traders avoid traps , filter false signals , and improve timing in both entries and exits. Product Purpose Provide an immediate a
该产品的买家也购买
Scalper Inside PRO
Alexey Minkov
4.74 (69)
An exclusive indicator that utilizes an innovative algorithm to swiftly and accurately determine the market trend. The indicator automatically calculates opening, closing, and profit levels, providing detailed trading statistics. With these features, you can choose the most appropriate trading instrument for the current market conditions. Additionally, you can easily integrate your own arrow indicators into Scalper Inside Pro to quickly evaluate their statistics and profitability. Scalper Inside
Gann Made Easy
Oleg Rodin
4.83 (156)
Gann Made Easy 是一个专业且易于使用的外汇交易系统,它基于使用先生理论的最佳交易原则。 W.D.江恩。该指标提供准确的买入和卖出信号,包括止损和获利水平。您甚至可以使用推送通知在旅途中进行交易。 购买后请联系我,即可免费获得交易指导和超棒的额外指标! 您可能已经多次听说过江恩交易方法。通常 Gann 的理论不仅对于新手交易者而且对于那些已经有一定交易经验的人来说都是非常复杂的东西。这是因为江恩的交易方法在理论上并不那么容易应用。我花了几年时间来完善这些知识,并将最好的原则应用到我的外汇指标中。 该指标非常易于应用。您所需要的只是将其附加到您的图表并遵循简单的交易建议。该指标不断进行市场分析工作并寻找交易机会。当它检测到一个好的入口点时,它会为您提供一个箭头信号。该指标还显示止损和获利水平。 换句话说,当您像先生一样进行交易时,该指标会为您提供最佳江恩建议。江恩亲自告诉你此时此刻该做什么。但最好的部分是您不需要了解任何有关江恩交易原则的知识,因为该指标会为您完成整个市场分析工作。
M1 Sniper
Oleg Rodin
5 (20)
M1 SNIPER 是一款易于使用的交易指标系统。它是一个专为 M1 时间框架设计的箭头指标。该指标可以作为独立的系统在 M1 时间框架下进行剥头皮交易,也可以作为您现有交易系统的一部分使用。虽然该交易系统专为 M1 时间框架交易而设计,但它也可以用于其他时间框架。我最初设计此方法是为了交易 XAUUSD 和 BTCUSD。但我发现这种方法在其他市场交易中也同样有用。 指标信号既可以顺势交易,也可以逆势交易。我教授一种特殊的交易技巧,帮助您利用指标信号进行双向交易。该方法基于使用特殊的动态支撑位和阻力位区域。 购买后,您可以立即下载 M1 SNIPER 箭头指标。此外,我还为所有 M1 SNIPER 工具用户免费提供下方屏幕截图所示的 Apollo Dynamic SR 指标!这两个指标的组合可以帮助您更轻松、更准确地利用 M1 时间框架进行交易。 购买后请联系我,免费获取交易提示和奖励指标! 祝您交易成功!
Linear Trend Predictor — 结合切入点和方向支撑线的趋势指标。按照突破高/低价通道的原理运作。该指标算法过滤市场噪音,考虑波动性和市场动态。 指示器功能  使用平滑方法,显示市场趋势和开立买入或卖出订单的切入点。  适合通过分析任何时间范围内的图表来确定短期和长期的市场走势。  输入参数可适应任何市场和时间范围,允许交易者独立定制指标。  设定的指示信号不会消失,也不会重新绘制——它是在蜡烛收盘时确定的。  几种类型的通知以箭头组合。  该指标既可以作为独立的交易系统使用,也可以作为其他交易系统的补充。  可供任何经验水平的交易者使用。 主要参数 Volatility Smoothing Level - 指标的主要参数,允许您配置指标以实现舒适的操作。 它的数字范围是 1 到 100,从而增加了您可以获得更长趋势运动的平滑度。 通过少量的数字,您可以获得短期走势并快速退出交易。 使用指标进行交易的时刻:  红线和箭头表示下降趋势和卖出开盘信号。止损应根据前一个上分形来设置。  黄线和箭头表示上升趋势和买入开盘信号。止损应根据前一个下分形来设置。
Dynamic Scalper System
Vitalyi Belyh
5 (1)
“ Dynamic Scalper System ”指标专为在趋势波内进行剥头皮交易而设计。 已在主要货币对和黄金上进行测试,并可与其他交易工具兼容。 提供顺势短线建仓信号,并提供额外的价格变动支持。 指标原理: 大箭头决定趋势方向。 在趋势波内,我们采用一种生成小箭头形式的剥头皮交易信号的算法。 红色箭头代表看涨方向,蓝色箭头代表看跌方向。 敏感的价格变动线会沿着趋势方向绘制,并与小箭头信号协同作用。 信号运作方式如下:当线在适当时刻出现时,将形成入场信号;在出现线时,持仓;线完成后,平仓。 建议的操作时间范围为M1 - H4。 箭头在当前K线上方形成,如果下一根K线已开仓,则不会重新绘制上一根K线上方的箭头。 输入参数 Trend Wave Period - 趋势方向(大箭头)的周期,改变趋势波的时间间隔。值 1 表示趋势方向的最长持续时间,参数值越大,持续时间越短。 Scalper Arrows Period - 信号箭头(小箭头)的计算周期,改变入场信号的生成频率。值 3 表示最频繁的生成频率,参数值越大,箭头频率越低,准确度越高。 这些参数可以根据不同的时间范
Atomic Analyst
Issam Kassas
5 (4)
首先值得强调的是,该交易指标是非重绘、非延迟的指标,这使其成为手动和机器人交易的理想选择。 用户手册:设置、输入和策略。 Atomic Analyst是一种PA价格行动指标,利用价格的力量和动量来寻找市场上更好的机会。配备了高级过滤器,可帮助去除噪音和假信号,并提高交易潜力。使用多层复杂的指标,Atomic Analyst扫描图表,并将复杂的数学计算转化为任何初学者都能理解并用来做出一致交易决策的简单信号和颜色。 “Atomic Analyst”是专为新手和经验丰富的交易者量身定制的综合交易解决方案。它将高级指标和一流功能融合为一体的交易策略,使其成为所有类型交易者的多功能选择。 日内交易和剥头皮策略:专为快速准确的日内交易和短期交易而设计。 日内和摆动交易策略:可用作追求价格大幅波动的日内和摆动交易者的可靠工具。 多货币和市场:凭借其可靠的精度,在不同的工具和市场上运作。 多个时间框架:可在多个时间框架上使用,性能良好。 稳定性:所有指标均不重绘、不重绘和不滞后,确保可靠的信号。 信号清晰度:提供箭头信号,用于清晰的入场和出场点。 实时警报:通过交易入场、SL和TP警报通知交易者
Trend Lines PRO
Roman Podpora
5 (1)
TREND LINES PRO 帮助您了解市场真正的方向转变点。该指标显示真实的趋势反转点以及主要参与者重新入场的时机。 您可以看到 BOS线、 趋势变化和更高时间框架的关键水平——无需复杂的设置或不必要的干扰。信号不会重绘,并在K线收盘后仍然保留在图表上。 VERSION MT 5    -   与……搭配使用时,可发挥其最大潜力   RFI LEVELS PRO 指示器 该指标显示的内容: 实际变化 趋势(BOS 线) 一旦信号出现,它就始终有效!这与会重绘的指标有着重要的区别,后者可能会发出信号后又改变信号,从而导致资金损失。现在,您可以更精准、更准确地进入市场。此外,还有一个功能,会在箭头出现后为K线着色,直到达到目标价位(止盈)或出现反转信号为止。 重复条目   以及主要玩家的充值 为了提高寻找入场点时的视觉清晰度,我们创建了一个模块,该模块首先显示买入/卖出区域,并在该区域内寻找最佳入场点。此外,我们还加入了智能逻辑来管理止损位,该逻辑会随着时间的推移逐步降低止损位的大小,从而降低入场交易时的初始风险(移动止损位)。 信号强度水平(BOS) 该指标采用三个显著性等级来衡量
NAM Order Blocks
NAM TECH GROUP, CORP.
3.67 (3)
MT4多時限訂單塊檢測指示器。 特徵 -在圖表控制面板上完全可自定義,提供完整的交互。 -隨時隨地隱藏和顯示控制面板。 -在多個時間範圍內檢測OB。 -選擇要顯示的OB數量。 -不同的OB用戶界面。 -OB上的不同過濾器。 -OB接近警報。 -ADR高低線。 -通知服務(屏幕警報|推送通知)。 概括 訂單塊是一種市場行為,它指示從金融機構和銀行收取訂單。著名的金融機構和中央銀行帶動了外匯市場。因此,交易者必須知道他們在市場上正在做什麼。當市場建立訂單塊時,它會像發生大多數投資決策的範圍一樣移動。 訂單建立完成後,市場將朝著上升和縮小的方向發展。訂單大宗交易策略的關鍵術語是它包括機構交易者正在做的事情。由於它們是主要的價格驅動因素,因此包括機構交易在內的任何策略都可以。 您將在任何時間範圍內實時看到訂單塊,使用我們的控制面板,您將能夠在所選的歷史記錄週期內檢測常規,拒收和未大寫的訂單塊。 現在您可以接收到訂單塊接近警報,我們在MT4上顯示屏幕通知,並將通知推送到您的手機!
GOLD Impulse with Alert
Bernhard Schweigert
4.67 (12)
这个指标是我们2个产品 Advanced Currency IMPULSE with ALERT  +   Currency Strength Exotics 的一个超级组合。 它适用于所有时间框架,并以图形方式显示8种主要货币和一种符号的强势或弱势冲动! 该指标专门用于显示任何符号的货币强度加速,如黄金、异国货币对、商品、指数或期货。这是它的第一个指标,任何符号都可以被添加到第9行,以显示黄金、白银、石油、DAX、US30、MXN、TRY、CNH等的真实货币强度加速(冲动或速度)。 建立在新的基础算法上,它使识别和确认潜在的交易更加容易。这是因为它以图形方式显示了一种货币的强势或弱势是否正在加速,并测量了这种加速的速度--把它想象成你汽车中的速度表。当你加速时,事情显然会发生得更快,这在外汇市场上也是一样的,即如果你配对的货币正在向相反的方向加速,你就会发现一个潜在的有利可图的交易。 动态市场斐波那契28水平被用作警报触发器,将适应市场活动。如果冲动击中黄色触发线,你将收到警报。然后你就知道作为一个交易员应该做什么。货币对和方向已经给出。只需点击警报按钮,就可以切换到该货
MTF Supply Demand Zones
Georgios Kalomoiropoulos
4.82 (22)
下一代自动化供需区。适用于任何图表的创新算法。所有区域都是根据市场的价格行为动态创建的。 两种类型的警报 --> 1) 当价格触及区域时 2) 当新区域形成时 你不会再得到一个无用的指标。您将获得一个完整的交易策略和经过验证的结果。     新的功能:     价格触及供需区时发出警报     创建新的供应/需求区时发出警报     推送通知警报     以点为单位的区域宽度标签     关于 MTF 的又一个时间表。因此,现在您将能够看到高于当前 3 个时间帧,而不是高于当前 2 个时间帧     启用/禁用警报/区域/MTF 功能的按钮 您获得的优势:     消除交易中的情绪。     客观化您的交易条目。     通过高概率设置提高您的利润。     节省绘图区域的时间。     像专业人士一样交易金融市场。     任何市场的即时多时间框架分析。 你在图表上看到了什么?     蓝色和红色矩形是当前时间范围的供需区。     虚线样式线是当前上方第一个时间范围内的供需区域。     实线样式线是当前上方第二个时间范围内的
Currency Strength Exotics
Bernhard Schweigert
4.88 (33)
目前8折优惠! 对任何新手或专家交易者来说都是最好的解决方案! 这个指标是专门用来显示任何符号的货币强度,如异国货币对、商品、指数或期货。它是同类产品中的第一个,任何符号都可以添加到第9行,以显示黄金、白银、石油、DAX、US30、MXN、TRY、CNH等的真实货币强度。这是一个独特的、高质量的、负担得起的交易工具,因为我们已经纳入了一些专有的功能和一个新的公式。想象一下,你的交易将如何改善,因为你能够准确地确定新趋势或剥头皮机会的触发点? 用户手册:点击这里   https://www.mql5.com/en/blogs/post/708876 它适用于所有时间框架。你将很快能够看到TREND! 根据新的基础算法设计,它使识别和确认潜在交易变得更加容易。这是因为它以图形方式显示了8种主要货币和一种符号的强弱。 该指标显示了8种主要货币(澳元加元瑞士法郎欧元英镑日元新西兰美元)的强弱线,再加上一个符号! 该指标显示了符号的真实价值。例如:对于XAUUSD(黄金):价格以美元报价。如果黄金在上涨,你怎么能知道是黄金的强势还是美元的弱势?只有当黄金走强时,我们才会进行交易。该指
MetaForecast M4
Vahidreza Heidar Gholami
5 (2)
MetaForecast能够根据价格数据中的谐波来预测和可视化任何市场的未来走势。虽然市场不总是可预测的,但如果价格中存在模式,MetaForecast可以尽可能准确地预测未来。与其他类似产品相比,MetaForecast通过分析市场趋势可以生成更精确的结果。 输入参数 Past size (过去的尺寸) 指定MetaForecast用于创建生成未来预测模型的柱数量。该模型以一条黄色线绘制在所选柱上。 Future size (未来的尺寸) 指定应预测的未来柱数量。预测的未来以粉色线表示,并在其上绘制了蓝色回归线。 Degree (程度) 此输入确定了MetaForecast将在市场上进行的分析级别。 Degree 描述  0 对于程度0,建议使用较大的值来设置“过去的尺寸”输入,以覆盖价格中的所有高峰、低谷和细节。  1 (建议的) 对于程度1,MetaForecast可以理解趋势,并通过较小的“过去的尺寸”生成更好的结果。  2 对于程度2,除了趋势,MetaForecast还可以识别反转点。对于大于1的程度,必须使用较高的“细节”和“噪音减少”输入值。  大于2 不建议使用大于
Super Reversal Indicator with Alert 概述 Super Reversal Indicator with Alert 是一款多时间周期交易工具,旨在通过结合随机指标动量、供需区域以及价格反转信号,帮助交易者识别高概率的市场反转机会。 该指标通过清晰的视觉信号和实时提醒,帮助交易者发现潜在的市场转折点。 核心功能 多时间周期随机指标分析 使用来自更高时间周期的随机振荡器(用户可自定义) 识别动量变化和交叉信号 包含超买和超卖水平,帮助实现更精准的入场 反转拒绝信号 检测关键价位上的强烈拒绝形态 识别以下位置的反转 日内高点卖出反转 日内低点买入反转 在图表上直接绘制箭头,直观清晰 供需区域 自动绘制来自 H4 和 D1 时间周期的重要区域 标记 供应区(潜在卖出区域) 需求区(潜在买入区域) 区域会动态更新并延伸至图表 智能提醒系统 弹出提醒 声音提醒 手机推送通知 邮件提醒(可选) 提醒触发条件包括 随机指标信号 拒绝信号 价格进入区域 可视化信号 在图表上显示买入和卖出箭头 清晰标注反转条件 界面简洁,易于阅读 交易逻辑 该指标结合三大核心要素来识别反
Introducing the Delta Volume Profile Indicator - Unleash the Power of Institutional Precision!  Technical Indicator: Are you ready to trade like the pros? The Delta Volume Profile Indicator is no ordinary tool. It’s a high-precision, cutting-edge indicator that puts the power of institutional-grade trading in your hands. This unique indicator analyses delta volume distribution in real-time, revealing the market's hidden buy/sell imbalances that the biggest financial institutions rely on to antic
Order Block Hunter
Noha Mohamed Fathy Younes Badr
5 (10)
Order block hunter indicator is the best indicator for  hunt the order blocks that area where there has been a large concentration of limit orders waiting to be executed Order blocks are identified on a chart by observing previous price action and looking for areas where the price experienced significant movement or sudden changes in direction .This indicator does that for you by using very complicated codes and helps you to take the best areas To buy and sell because it make marks at the best a
Dynamic Forex28 Navigator
Bernhard Schweigert
4.43 (7)
Dynamic Forex28 Navigator - 下一代外汇交易工具。 当前 49% 折扣。 Dynamic Forex28 Navigator 是我们长期流行的指标的演变,将三种功能合二为一: 高级货币强度 28 指标 (695 条评论)+ 高级货币 IMPULSE 带警报 (520 条评论)+ CS28 组合信号(奖励)。 有关指标的详细信息 https://www.mql5.com/en/blogs/post/758844 下一代强度指标提供什么? 您喜欢的原始指标的一切,现在通过新功能和更高的精度进行了增强。 主要特点: 专有货币强度公式。  所有时间范围内的平滑和准确的强度线。 非常适合识别趋势和精确进入。 动态市场斐波那契水平(市场斐波那契)。  此指标独有的独特功能。 斐波那契应用于货币强度,而不是价格图表。 适应实时市场活动以获得准确的反转区域。 实时市场动量。  第 9 行显示市场是活跃还是被动。 对于定时交易至关重要。 全面的警报和显示。  每种货币最强的买入和卖出动量。 ​​28 对的双重动量买入和卖出。 超买/超卖警告外部范围和止损。 反转
Advanced Supply Demand
Bernhard Schweigert
4.91 (299)
现在优惠 40%! 任何新手或专业交易者的最佳解决方案! 该指标是一款独特、高质量、且价格合理的交易工具,因为我们已经整合了许多专有功能和新公式。 依据此更新,您将能够显示双重时间帧区域。 您不仅可以显示一个较高的时间帧,还可以同时显示图表时间帧,加上更高的时间帧:显示嵌套时区。 供需双方所有交易者都会喜欢它。 :) 重要信息披露 高级供需的最大潜力,请访问 https://www.mql5.com/zh/blogs/post/720245   想象您的交易如何得以改善,是因为您能够精准定位入场或目标位吗? 构建于新的底层算法,它可以更轻松地识别出买卖双方之间的潜在失衡。 这是因为它以图形方式展示供需最强劲区域,及其过去的表现(显示旧区域)。 这些功能旨在帮助您更轻松地发现最佳入场区域和价位。 现在您可以针对您的交易品种和时间帧来优化和编辑区域强度! 高级供需指标适用于所有产品和时间帧。 它是一个新的公式,非常新的功能是两个区域强度函数可由用户输入进行调整! 这在交易中是一大优势。 当您学习如何使用专有功能,例如带有价格游离最小 X 因子的区域强度时,您能够判断该区域强劲与否。 供需
RFI levels PRO
Roman Podpora
5 (1)
该指标能够准确显示反转点和价格回落区域。     行业领军人物 。您能洞察新趋势的形成,并以最高的精准度做出决策,掌控每一笔交易。 与……结合时,展现其最大潜力     趋势线专业版   指标  VERSION MT5 该指标显示的内容: 新趋势开始时的反转结构和反转水平及其激活。 显示屏   获利了结   和   止损   风险回报比最低的水平     RR 1:2       。 具有智能减值逻辑的止损。 显示指定指标中两种趋势类型的反转形态。 指标: 根据     趋势线     (全球趋势变化) 潮流专业版     (趋势快速变化) 简单有效   扫描器   实时趋势(新增)。 多时间框架工具筛选。 展示   利润   在 LOGIC AI 信号之后。 以下列出今日走势积极的金融工具。(RB键) 能够为终端启用通知(警报)功能,并向移动设备推送通知。 逻辑人工智能     — 利用人工智能寻找最佳切入点。 只有在启用 MTF(多时间框架分析)模式时,该功能才可用。 兼容性。 当与趋势线指标结合使用时,该指标能发挥其最大潜力。 这     RFI LEVELS PRO    
Adaptive Volatility Range
Stanislav Konin
5 (3)
Adaptive Volatility Range [AVR] is a powerful tool for identifying key trend reversal points. AVR accurately reflects the Average True Range (ATR) of volatility, taking into account the Volume-Weighted Average Price (VWAP). The indicator adapts to any market volatility by calculating the average volatility over a specific period, ensuring a stable rate of profitable trades. You receive not just an indicator but a professional automated trading system , AVR-EA . Advantages: Automated Trading Sys
TPSpro RFI Levels
Roman Podpora
4.86 (28)
俄语说明 /  英文 说明   -  MT5 版本 主要功能: 显示卖家和买家的活跃区域! 该指标显示所有正确的买入和卖出的初始脉冲水平/区域。当这些水平/区域被激活时,即开始寻找入场点的位置,水平线会改变颜色,并填充特定颜色。此外,还会显示箭头,以便更直观地了解情况。 LOGIC AI - 激活模板时显示用于搜索入口点的区域(圆圈) 为了提高视觉清晰度,添加了使用人工智能搜索入口点的显示区域的功能。 显示更高时间范围内的级别/区域(MTF 模式) 新增使用更高时间间隔显示级别/区域的功能。此外,该指标还具有自动趋势检测功能 (   TPSproTREND PRO   )。 独立的专业分步交易算法 该算法专为顺势和逆势的日内交易而设计。每个活动模板均提供详细的说明。 适用于不同的时间范围 TPSpro RFI 水平指标可用于图表上的任何时间间隔,从分钟(M1)到每月(MN)。 图形和声音警报 该指标提供图形和声音提示,让您不会错过交易信号。 此外,还支持手机通知。 简单有效的活性模板扫描器 这是一个非常紧凑的主动模式扫描仪,当在一个方向上的所有时间间隔内激活模式时,它会自动发出警报并
BTMM State Engine Pro MT4
Garry James Goodchild
BTMM State Engine Pro is a MetaTrader 4 indicator for traders who use the Beat The Market Maker approach: Asian session context, kill zone timing, level progression, peak formation detection, and a multi-pair scanner from a single chart. It combines cycle state logic with a built-in scanner dashboard so you do not need the same tool on many charts at once. What it does Draws the Asian session range; session times can follow broker server offset or be set in inputs. Tracks level progression (L
TrendLine PRO MT4
Evgenii Aksenov
4.83 (167)
Trend Line PRO   指标是一个独立的交易策略。 它显示趋势变化,交易的入口点,以及自动计算三个级别的止盈和止损保护 Trend Line PRO  非常适合所有元交易者符号:货币,金属,加密货币,股票和指数 该指标用于真实账户交易,这证实了该策略的可靠性 您可以在这里找到使用   Trend Line PRO   和真实信号的机器人:   https://robomarket.org/product-category/signals/ 目前,Trend Line PRO指标的售价为75美元。 促销后价格为 149 美元 。 趋势线专业的优点 永远不要重绘它的信号; 将其作为独立策略的可能性; 它有三个自动水平止盈和止损水平  该指标具有iCustom信号缓冲区,允许您基于它创建交易机器人 具有通知功能 该指标已证明其在真实账户交易中的有效性 如何设置和优化趋势线PRO指标: 通过更改幅度参数以及 TP 和 SL 水平,将重点放在指标面板上的利润上 您可以使用以下方式自动优化指标参数: Optimizer Utility 详细说明(ENG): 这里 趋势线PRO指标如
Market Reversal Alerts
LEE SAMSON
4.2 (115)
成為突破者,隨著價格反轉,市場結構會改變利潤。 訂單突破者指示器可以識別趨勢或價格走勢何時接近枯竭並準備好逆轉。它會提醒您市場結構的變化,通常會在發生逆轉或重大回調時發生。 該指標使用專有計算來確定突破和價格動能。每當在可能的耗盡點附近形成新的高點時,指標就會繪製最後一個生成該高點的順序塊。然後,它將隨價格移動隨價格跟隨定單。然後,當價格轉向相反方向並突破該訂單塊時,它會提醒您,從而創建新的市場結構並開始趨勢或重大回調的可能逆轉。 訂單塊是在創建高/低之前的最後一個相反的彩色蠟燭,並且當價格跌破這些關鍵區域以下時,這表明趨勢可能會發生短期或長期反轉。 特徵 提醒您關鍵耗盡點的市場結構變化 價格接近耗盡水平時自動提取訂單塊 在一個方向繼續移動時,在價格後面跟踪定單,以提醒您最佳的反轉輸入 將顏色更改為純色塊,以顯示何時發生市場結構中斷。 適用於所有交易品種和時間範圍 內置集成的彈出窗口和電子郵件警報 策略和如何與定單破壞者指標進行交易 當斷路器塊發生時,您有兩個選擇。 看左邊!我們正在尋求供應/需求或支撐/阻力位嗎?市場結構轉變(逆轉)通常發生在價格重新測試舊水平或在該支撐或
Currency Strength Wizard
Oleg Rodin
4.85 (59)
货币强度向导是一个非常强大的指标,为您提供成功交易的一体化解决方案。该指标使用多个时间范围内所有货币的数据来计算这个或那个外汇对的力量。此数据以易于使用的货币指数和货币电力线的形式表示,您可以使用它们来查看这种或那种货币的力量。 您所需要的只是将指标附加到您要交易的图表上,该指标将向您显示您交易的货币的真实强度。该指标还向您显示买卖量压力的极值,您可以在顺势交易时利用这些压力。该指标还显示了基于斐波那契的可能目标。该指标可用于各种交易时间范围。该指标支持各种货币对的交易。 该指标为您提供所有类型的警报,包括推送通知。 购买后请联系我。我将与您分享我的交易技巧,并免费为您提供丰厚的红利指标! 祝您交易愉快,获利丰厚!
Volatility Trend System - a trading system that gives signals for entries. The volatility system gives linear and point signals in the direction of the trend, as well as signals to exit it, without redrawing and delays. The trend indicator monitors the direction of the medium-term trend, shows the direction and its change. The signal indicator is based on changes in volatility and shows market entries. The indicator is equipped with several types of alerts. Can be applied to various trading ins
Buy Sell Arrow Swing MT4
Sahib Ul Ahsan
3 (2)
Looking for a powerful yet lightweight swing detector that accurately identifies market structure turning points? Want clear, reliable buy and sell signals that work across any timeframe and any instrument? Buy Sell Arrow MT Swing is built exactly for that — precision swing detection made simple and effective. This indicator identifies Higher Highs (HH) , Higher Lows (HL) , Lower Highs (LH) , and Lower Lows (LL) with remarkable clarity. It is designed to help traders easily visualize market stru
Trend indicator AI
Ramil Minniakhmetov
4.49 (84)
趋势人工智能指标是一个伟大的工具,将加强交易者的市场分析结合趋势识别与可操作的进入点和逆转警报。 该指标使用户能够自信和精确地驾驭外汇市场的复杂性 除了主要信号,趋势Ai指标识别在回调或回调期间出现的次要入口点,使交易者能够利用既定趋势内的价格修正。 重要优势: *MT4及MT5工程 *明确买入或卖出信号 ·不重绘 *适用于所有资产 小心我不卖EA或设置电报它骗局. 所有设置免费在这里的博客。  重要! 购买后立即与我联系,以获得指示和奖金! 真实的操作监控以及我的其他产品可以在这里找到: https://www.mql5.com/en/users/mechanic/seller&nbsp ; 设置和输入: 建议为所有资源设置默认设置。 第...
Auto Optimized Parabolic RSI: 高级 3D 动量引擎 大多数零售指标之所以失效,是因为它们依赖于静态输入,一旦市场波动率发生变化,这些输入就会崩溃。Auto Optimized Parabolic RSI 通过不断重新计算自身的数学优势,解决了“指标衰退”的问题,将机构级别的量化自适应能力直接引入您的 MT5 终端。 核心优势:定制的内存 3D 优化   标准的自动优化器通常会导致 MT5 平台卡顿,因为它们通过标准的指标调用使终端超载。该工具完全绕过了这些性能瓶颈。内部引擎采用定制的原生基于 RAM 的计算器构建,每次加载图表或更改时间周期时,它都会执行极速的 3D 网格搜索。它同时扫描 RSI 周期(频率)、SAR 步长(加速度)和 SAR 最大值(速度限制),在绝对的毫秒级时间内测试数以万计的参数组合,且完全不会拖慢您的平台。它不是仅仅寻找一个“不错”的设置,而是映射整个参数空间,以寻找资产当前动量结构的绝对全局最大值。 严格的财务评分与逼真的交易模拟   与基于抽象“指标点数”进行优化评分的业余工具不同,该引擎的 3.10 版本严格与资金数学挂钩。每
Matrix Arrow Indicator MT4
Juvenille Emperor Limited
5 (3)
矩阵箭头指标 MT4 是一种独特的 10 合 1 趋势,遵循 100% 非重绘多时间框架指标 ,可用于所有符号/工具:外汇、商品、加密货币、指数、股票。  Matrix Arrow Indicator MT4 将在其早期阶段确定当前趋势,从多达 10 个标准指标中收集信息和数据,它们是: 平均定向运动指数 (ADX) 商品渠道指数 (CCI) 经典 Heiken Ashi 蜡烛 移动平均线 移动平均收敛散度 (MACD) 相对活力指数 (RVI) 相对强弱指数 (RSI) 抛物线SAR 随机振荡器 威廉姆斯的百分比范围 当所有指标给出有效的买入或卖出信号时,相应的箭头将打印在图表上,在下一根蜡烛/柱线开盘时,指示强劲的上升趋势/下降趋势。用户可以选择使用哪些指标,并可以单独调整每个指标的参数。 Matrix Arrow Indicator MT4 仅从选定的指标中收集信息,并仅根据其数据打印箭头。 Matrix Arrow Indicator MT4 还可以为所有新信号发送终端、推送通知或电子邮件警报。无论您是黄牛、日内交易者还是波段交易者, Matrix Arrow Indicat
Scalper Vault
Oleg Rodin
5 (36)
Scalper Vault 是一个专业的剥头皮系统,为您提供成功剥头皮所需的一切。该指标是一个完整的交易系统,可供外汇和二元期权交易者使用。推荐的时间范围是 M5。 该系统为您提供趋势方向的准确箭头信号。它还为您提供顶部和底部信号以及江恩市场水平。无论您拥有何种交易经验,该系统都易于使用。您只需要遵循简单的规则并每天重复该过程。 建议将此系统用于主要货币对。感谢您的关注! 请注意,该指标在策略测试器中可能无法正常工作。因此,我建议仅在模拟或真实账户的真实交易条件下使用该系统。 指示器提供所有类型的警报,包括推送通知。 购买指标后请与我联系。我将免费与您分享我的个人交易建议和出色的奖励指标! 祝您交易愉快,盈利!
作者的更多信息
MACD Message
Dmitriy Moshnin
MACD Message is an analogue of the MACD Alert for the MetaTrader 4 terminal with more advanced functionality: Parameters 'Averaging Method' and 'Price Type' ( MA method and Apply to ) are displayed in the settings window. It gives an advantage of monitoring convergence/divergence of all types of Moving Average (Simple Averaging, Exponential, Smoothed and Linear Weighted) and by any price (Closing Price, Opening Price, the Maximum Price for the Period, the Minimum Price for the Period, Median Pri
Symbol Profit
Dmitriy Moshnin
这款指标用于 MetaTrader 4。它在图表窗口中,小型,美观紧凑,可十分便利地显示所有必要信息: 它们的开仓手数和总盈利。字体大小, 位置和颜色可以根据您的偏好设置。省缺时,正盈利持仓显示为绿色,负盈利则为红色。祝交易好运!
Unlike the standard indicator, Stochastic Oscillator Message ( please see the description and video ) features an alert system that informs you of changes in the market situation using twenty signals: the Main line and Signal line cross in the area above/below the levels of extremum (below 20%; above 80%); the Main line and Signal line cross within the range of 20% to 80%; the Main line crosses the levels of extremum; the Main line crosses the 50-level; divergence on the last bar. Parameters of
RSI TrendLine Divergency Message is an indicator for the MetaTrader 4 trading platform. Unlike the original indicator, this three in one version has a system of alerts that inform on market situation changes. It consists of the following signals: when the Main line crosses the levels of extreme zones and 50% level; when the Main line crosses the Trend line in the indicator window; divergence on the last bar. Parameters of levels of extremum, 50-level and divergence are adjustable. Parameters La
MACD Color
Dmitriy Moshnin
彩色 MACD ( 请看描述和视频 ) 是一款用于 MetaTrader 4 交易平台的指标,类似于 MACD 消息 。不同于标准指标,在市场情况变化时,它改变柱线边缘颜色 - 趋势强度变化,或是主 EMA 相对于零轴的倾角变化 - 它会改变零轴颜色 (这个参数可以在设置中禁用)。 来看看如何在一个可盈利的多货币 交易策略 的所有时间帧中应用这个指标,它也适于在您的移动终端上交易。 祝交易好运!
四均线指标 ( 请参看描述和视频 ), 是 四均线消息 的一个版本, 在主窗口以省缺设置显示四条均线: 绿色和红色表示短线趋势, 红色和蓝色 - 中线趋势, 而蓝色和黄色 - 长线趋势。您可以改变移动均线设置和颜色。不过,这些参数已经配置好,可在所有时间帧内交易。来看看本指标如何用于所有时间帧的可盈利多货币 交易策略 , 它也适合在您的移动终端上进行交易。 祝交易好运!
The Four Moving Averages Message indicator ( please see the description and video ), a version of Four Moving Averages , concurrently displays four Moving Averages with default settings in the main chart window: Green and Red ones represent a short-term trend, Red and Blue ones - mid-term trend, while Blue and Yellow ones - long-term trend. You can change the moving average settings and colors. However, these parameters have been configured so that to allow trading on all time frames. The built-
用于 MetaTrader 4 交易平台的显示随机波动系统指标 ( 参见描述 (俄语) ) 在图表窗口里尺寸很紧凑, 它可以在单一窗口里显示所有时间帧的随机波动指标结果。每个时间帧的参数分别设置。字体大小, 边角和颜色可以根据您的偏好设置。省缺, 买信号为绿色,卖信号为红色。超买行情为深红色 (准备卖出 -> 等待红色)。超卖行情为深绿色 (准备买入 -> 等待绿色)。它最好配合 显示 ADX 系统 指标一起使用,因为当 ADX 处于趋势时, 建议忽略随机波动的信号。 祝交易好运!
用于 MetaTrader 4 交易平台的显示 ADX 系统指标 ( 参见描述 (俄语) ) 在图表窗口里尺寸很紧凑, 它可以在单一窗口里显示所有时间帧的 ADX 指标结果。每个时间帧的参数分别设置。字体大小, 位置和颜色可以根据您的偏好设置。省缺, 时间帧的颜色名称如下: 无趋势 - 白色, 牛势 - 绿色, 熊势 - 红色。如果在横盘区域最后三根柱线的 ADX 上涨: 上行趋势 - 深绿色, 下行趋势 - 深红色。它最好配合 显示随机波动系统 指标一起使用,因为当 ADX 未处于趋势时, 建议使用随机波动的信号。 祝交易好运!
The Level Moving Averages indicator ( see the description and video ) does not draw the Moving Average line in the chart window but marks the Moving Average level on all time frames in accordance with the specified parameters. The level move frequency corresponds to the TimeFrame parameter value specified. The advantage of this indicator lies in the fact that it offers the possibility of monitoring the interaction between the price and the MA of a higher time frame on a lower one (e.g., the MA l
The Level S Moving Averages indicator ( see the description and video ) does not draw the Moving Average line in the chart window but marks multiple levels (such as close, highs and lows of any bar on the time frames from M1 to D1, W1, MN - strong levels) of the Moving Average on all time frames in accordance with the specified parameters. The level move frequency corresponds to the TimeFrame parameter value specified. The advantage of this indicator lies in the fact that it offers the possibili
The Level Moving Averages Message indicator ( see the description and video ) does not draw the Moving Average line in the chart window but marks the Moving Average level on all time frames in accordance with the specified parameters. The level move frequency corresponds to the TimeFrame parameter value specified. The advantage of this indicator lies in the fact that it offers the possibility of monitoring the interaction between the price and the MA of a higher time frame on a lower one (e.g.,
Lot Calculation
Dmitriy Moshnin
手数大小计算器 ( 参见描述 ) 基于可用保证金百分比计算手数, 以及针对图表窗口中通过移动水平线设置的仓位的盈利, 亏损和盈亏比。 更多的高级模拟手数计算器是 盈利因素 指标。
显示趋势均线系统指标 ( 参看它的描述 ) 在一个窗口里显示所有时间帧的有关趋势方向 H1, H4, D1, W1, MN, 以便您在旧的柱线收盘之前跟踪均价的变化。趋势单位是旧的柱线收盘价的周期为 "1" 的均线 (H1, H4, D1,  W1, MN)。指标重新计算内部旧有柱线的值,并在图表窗口里绘制趋势坡度作为时间间隔的彩色名称: 绿色 -上升, 红色 - 下跌。字体大小, 坡度角度和颜色均可定制。例如, 附加的截图是在 H1 以内的时间帧上表现一根 H1 柱线的彩色区域和均价变化 (移动均线)。请注意指标没有绘制移动均线。 希望您交易成功!
ADX Message
Dmitriy Moshnin
Отличается от стандартного индикатора дополнительным набором настроек и встроенной системой оповещений. Индикатор может подавать сигналы в виде алерта ( Alert ), комментария в левый верхний угол главного окна графика ( Comment ), уведомления на мобильную версию терминала ( Mobile МТ4 ), электронный почтовый ящик ( Gmail ).  Параметры индикатора Period — период расчета индикатора; Method — выбор метода усреднения: простой, экспоненциальный, сглаженный, линейно-взвешенный; Apply to — выбор использ
双移动均线指标在主图表窗口同时显示两条省缺设置的均线: 绿线和红线代表短期趋势。您可以改变移动均线设置和颜色。不过,这些参数已经配置好,可在所有时间帧内交易。来看看移动均线如何用于所有时间帧的可盈利多货币 交易策略 , 它也适用于移动终端交易。 希望您交易成功!
三移动均线指标在主图表窗口同时显示三条省缺设置的均线: 绿线和红线代表短期趋势,红线和蓝线代表长期趋势。您可以改变移动均线设置和颜色。不过,这些参数已经配置好,可在所有时间帧内交易。来看看移动均线如何用于所有时间帧的可盈利多货币 交易策略 , 它也适用于移动终端交易。 希望您交易成功!
The alerting system for the MetaTrader 4 platform 'Two Moving Average Message' consists of two moving average lines with individual parameters. The indicator can generate alerts ( AlertMessage )б display a comment in the upper left corner of the main chart window ( CommentMessage ), send notifications to the mobile terminal version ( MobileMessage ), send emails ( GmailMessage ) and play two different sounds at the intersection of lines upwards or downwards. Parameters Language – choose language
Three Moving Averages Message is a notification system for the MetaTrader 4 platform. It consists of three moving averages which have their own adjustable parameters. Slow and Long lines determine long-term trend, while Fast and Slow lines - short-term. If the lines Fast and Slow are crossed during a trend, the indicator displays a recommendation for buying (selling). If the lines Slow and Long are crossed, the indicator notifies of the start of a up/down trend. Concerning other types of crossin
Profit Factor
Dmitriy Moshnin
The Profit Factor indicator calculates one of the three parameters: 1 - market entry level (in the 'Calculate the' parameter - Market Open Trade), 2 - the Stop Loss level (Calculate the - Market Price Loss), 3 - the Take Profit level (Calculate the - Market Price Profit) - with a desired profit/loss ratio (Profit Factor), as well as the lot size (trade volume) according to the value of the risk percentage of available funds specified in the settings (a simpler analog is the Lot Calculation indic
MACD Converter
Dmitriy Moshnin
MACD Converter is an analogue of the MACD Message with more advanced functionality: It has two signal lines: Signal Line 1 and Line 2, bar outlines are colored according to Line 1, it also triggers the trend notifications. MACD Converter converts the parameters of Fast MA, Slow MA and Signal Line 1 and Line 2 lines from the interval specified in the settings (Convert Time Frame) to smaller timeframes. This allows receiving a signal for making a decision within the specified (Convert Time Frame)
LTT Range System
Dmitriy Moshnin
Индикатор Форекс LTT Range System показывает на графике средние диапазоны движения рыночной цены за периоды M 15, H 1, H 4, D 1, W 1, MN 1.  Верхняя и нижняя границы диапазонов рассчитываются от цены открытия бара. Пивот – середина между ценой открытия бара и границей диапазона: если рыночная цена находится выше цены открытия бара – метка пивота располагается между ценой открытия бара и верхней меткой диапазона, если рыночная цена находится ниже цены открытия бара – метка пивота располагается ме
Parabolic Converter is and analogue of the Parabolic indicator for МТ4 which can automatically recalculate parameters of Time Frame specified in settings for lower time periods. It has a Notification System which triggers when the price movement direction is changed. For example: if we set Time Frame 1 Hour to H1 and M30, M15, M5 and M1 contained therein, we can see the indicator's readings corresponding to H1 (fig.). At that, if we add one more Parabolic on the same chart (of several charts) wi
RSI Converter
Dmitriy Moshnin
Relative Strength Index with advanced functionality recalculates (converts) the averaging period in accordance with the value of parameter Time Frame for lower chart time intervals (Multi-TimeFrame (MTF)). Unlike the standard indicator, RSI converter includes an alert system that notifies about changes in market situation, it consists of the following signals: Main line crosses levels of extreme zones (30%, 70%) and the level of 50%; The main line crosses one or two trendlines in the indicator w
Commodity Channel Index Message is an indicator for the MetaTrader 4 trading platform. Unlike the original indicator, this three in one version has a system of alerts that inform on market situation changes. It consists of the following signals: when the Main line crosses the levels of extreme zones and 50% level; when the Main line crosses the Trend line in the indicator window; Divergence on the last bar. Values of the middle and extreme levels and divergence zones are customizable. Parameter
MACD TrendMA
Dmitriy Moshnin
The MACD TrendMA indicator is a trading system developed on the basis of the MACD indicator popular among many traders, and which is based on measuring the inclination (trend) angle of the moving averages, while measuring the ratio (convergence/divergence) between them. The signal for entering/exiting the market is the frame of the bars colors and color of the MACD TrendMA histogram according to the trend, which can be customized in the properties window of the indicator - in case the inclinatio
MACD Temp
Dmitriy Moshnin
MACD Temp is a system of two oscillators, which allows to track the price changes of the Fast and Slow periods in case of their convergence/divergence. The bar border is colored in accordance with the MACD trend, while the color of the histogram changes when the values of the Momentum indicators cross the level of 100, for respective periods: Fast Moving Average (Fast Momentum), Slow Moving Average (Slow Momentum), selectively or for both values (the mode is to be chosen in the indicator propert
MACD CloseBars
Dmitriy Moshnin
The MACD CloseBars indicator is a trading system based on the MACD indicator popular among many traders, which is built on the principle of bars closing above the moving averages selected in the indicator settings. The signal for entering/exiting the market is the frame of the bars colors according to the trend: in case the bars in the main window of the chart are closed above/below the Fast Moving Average, Slow Moving Average individually or both together. Indicator Parameters Fast Moving Aver
MACD ColorBars
Dmitriy Moshnin
MACD ColorBars paints bar frames according to a trend, as well as changes the histogram color when MACD bars are rising or falling (if Color Bars is enabled in the inputs window). The growth of bars indicates a divergence between the fast and slow moving averages, while the decrease indicates their convergence. Parameters Fast Moving Average - period of the fast moving average; Slow Moving Average - period of the slow moving average; MA method - moving average smoothing method (simple, exponent
MACD Volume
Dmitriy Moshnin
The MACDVolume indicator is a trading system based on the increase in tick volumes in bars, which match the trend. Indicator Parameters Fast Moving Average - period of the fast moving average; Slow Moving Average - period of the slow moving average; MA method - averaging method of the moving averages (simple averaging, exponential, smoothed and linear-weighted); Apply to - applied price of the moving averages (Close, Open, High for the period, Low for the period, Median, Typical and Linear-Weig
筛选:
sunnychow
9045
sunnychow 2018.12.16 05:21 
 

用户没有留下任何评级信息

Tim Eubanks
5763
Tim Eubanks 2018.07.14 18:32 
 

用户没有留下任何评级信息

Matthew Todorovski
13133
Matthew Todorovski 2018.06.30 14:16 
 

用户没有留下任何评级信息

Roy W
948
Roy W 2018.06.08 22:30 
 

用户没有留下任何评级信息

回复评论