• 概述
  • 评论
  • 评论 (4)
  • 新特性

Trend Semaphore Indicator

TSI - Trend Semaphore Indicator

  • Work tool developed to display the force of movement.
  • This tool was developed for Trend Following strategies.
  • Recommended for all types of traders.
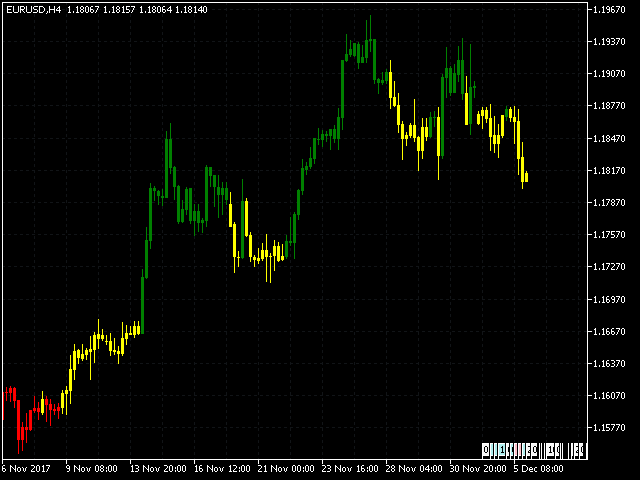
  • Can be used in any instrument and market.
  • Can be used in any period of time.
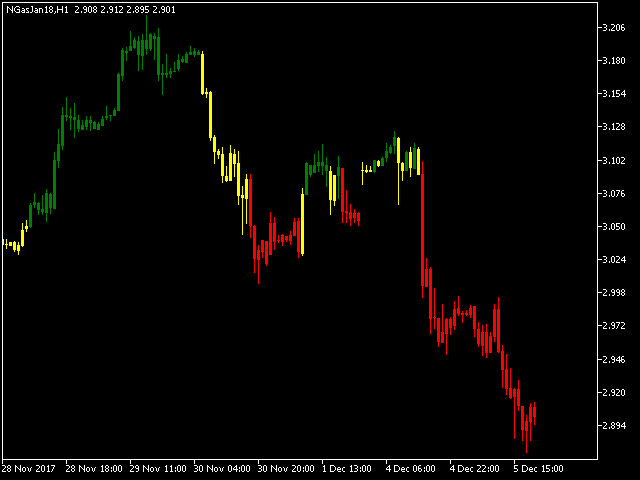
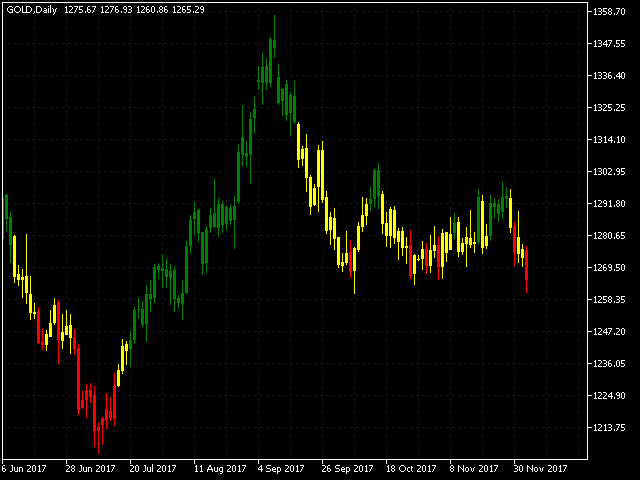
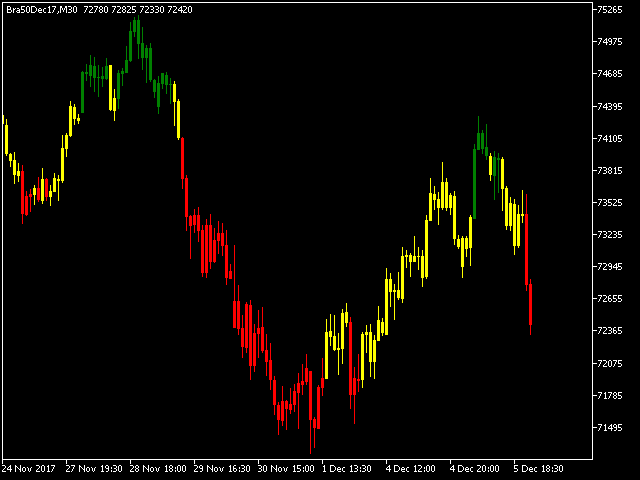
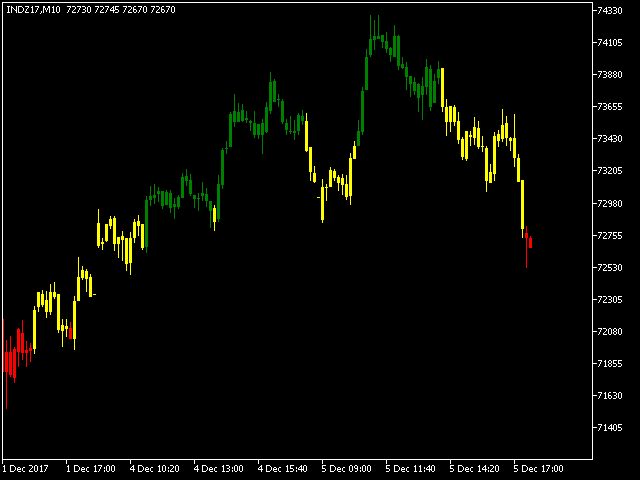
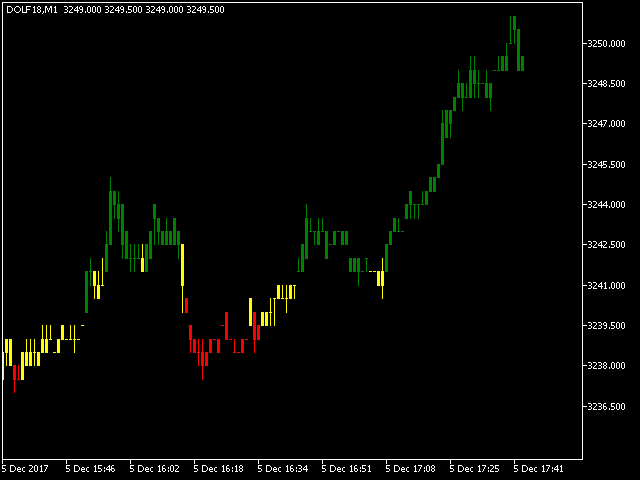
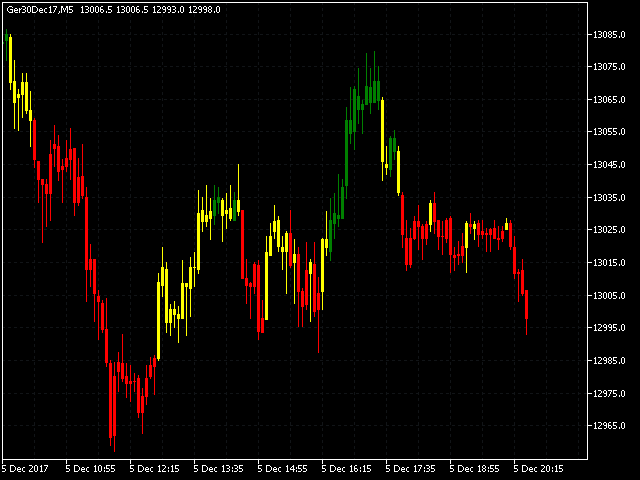
  • Trend indication using multicolored candles.


New trend

A new trend is signaled by the changing colors on the chart's candles.

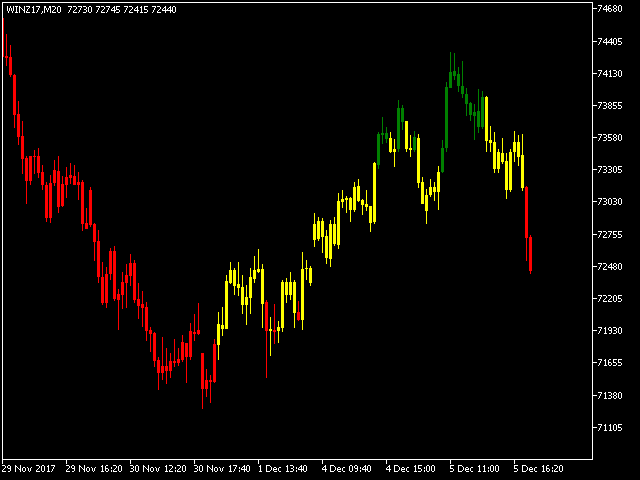
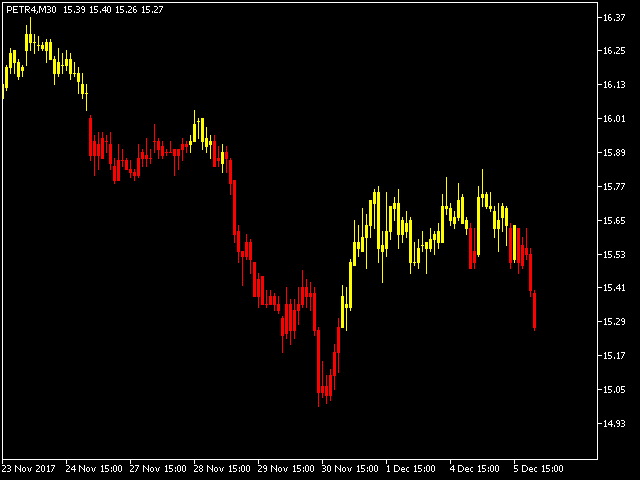
The indicator indicates the upward trend with the green color, the downward trend by the red color and weak movements like congestion / consolidation in the yellow color.

This indicator does not repaint the signals.
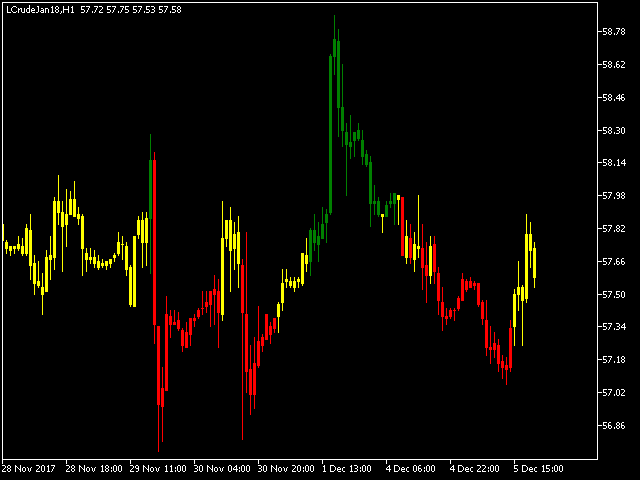

Trend Aggression

Indicates that there is strength in the direction of the signaled trend.

It is signaled by the color of the candles, when it turns red indicates aggression in the downward tendency, and when it turns green it indicates aggression in the upward tendency.
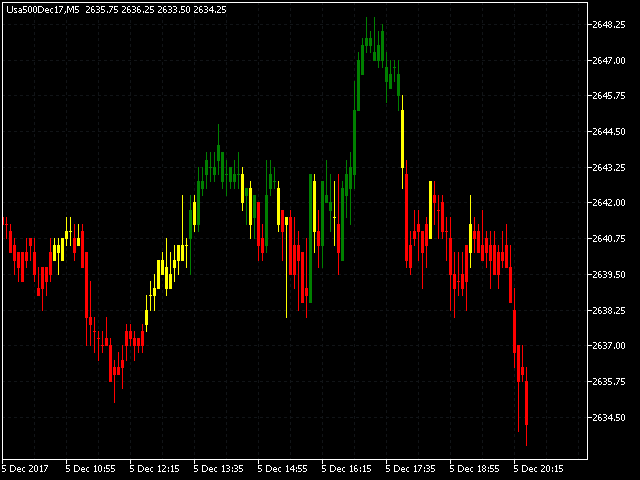

Tendency weakening

This indicates that there is loss of strength in the direction of the tendency marked with aggression.

It is marked by the change in the color of the candles, when it turns yellow indicates loss of strength in the downward tendency or loss of force in the upward tendency.

Loss of strength is only identified after the trend has been confirmed with aggression, changing from green or red to yellow.


Trading with the Indicator

Trading with the indicator is a personal decision, and every trader has a particular way of doing it.

The most important thing is to respect the colors. It is important to protect the deals whenever the yellow color appears, placing the stop loss where you want, according to your risk profile.


Trend Semaphore Indicator Settings

Explanation of options A, B, C and D.

Each of these options, if enabled, will allow the price to be analyzed. If there is strength or weakness present, based on the use of one or more options, the indicator will paint the candles.

The rules of each option are based on strength and trend indicators.

  • settings - Settings of Trend Semaphore Indicator:
  • period_candles: current
  • info_options = Enable or disable to build the strategy.
  • Use Option_A = true
  • Use Option_B = true
  • Use Option_C = true
  • Use Option_D = true


Final considerations

If you want to use various combinations of options A, B, C or D, simply enable or disable the options desired.

It is important to understand that the most liquid assets have trend cycles.

  1. It starts a trend and at some point there is aggression against or in the direction of the trend.
  2. Loss of strength in the trend
  3. It starts a new trend and at some point there is aggression against or in the direction of the trend.

We recommend using this indicator on liquid instruments with moderate or high volatility.

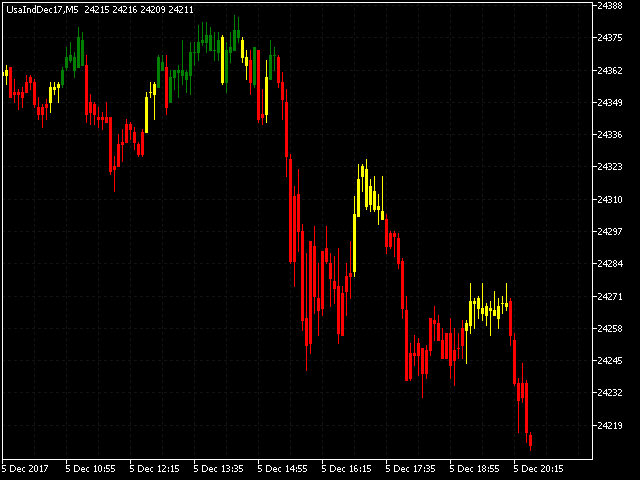
The color of the candles is not based on whether the candle is positive or negative.

The indicator shows in color the direction and strength of the trend of the traded instrument, based on the calculations of the indicators used in it.

A tall candle may be represented in yellow or red.

It may occur from a low candle being represented in yellow or green.

It is important to understand that there may be times when the indicator will not show signs completely in line with market conditions.

推荐产品
Owl Smart Levels MT5
Sergey Ermolov
4 (29)
MT4版本  |   FAQ Owl Smart Levels Indicator 是一個完整的交易系統,包含 Bill Williams 的高級分形、構建正確的市場波浪結構的 Valable ZigZag 以及標記準確入場水平的斐波那契水平等流行的市場分析工具 進入市場和地方獲利。 策略的详细说明 指示灯使用说明 顾问-贸易猫头鹰助手助理 私人用户聊天 ->购买后写信给我,我会将您添加到私人聊天中,您可以在那里下载所有奖金 力量在於簡單! Owl Smart Levels 交易系統非常易於使用,因此適合專業人士和剛開始研究市場並為自己選擇交易策略的人。 策略和指標中沒有隱藏的秘密公式和計算方法,所有策略指標都是公開的。 Owl Smart Levels 允許您快速查看進入交易的信號,突出顯示下訂單的水平並向您發送有關已出現信號的通知。 優點很明顯: 清楚地顯示主要和更高時間框架的趨勢方向。 指示儀器信號的出現。 標記開單、止損設置和固定利潤的水平。 沒有多餘的,只有必要的結構! ZigZag 表示全球趨勢的方向,因此也表示貿易方向。 市場反轉點的短線清楚地表明在什麼水平上構建斐波那
Maximum Trend Arrows OT MT5
Mulweli Valdaz Makulana
STRICTLY FOR BOOM INDEX ONLY!!!!! Here I bring the Maximum Trend Arrows OT1.0 MT5 indicator. This indicator is made up of a combination of different trend indicators for entries and exits, for entries an orange arrow will paint on the chart below the current market and a red flag for closing of trades and it produces buy arrows only. When the orange arrow appears, it will appear along with it's sound to notify you. The 1H timeframe is recommended, don't use it anywhere else than on the 1H timefr
Noize Absorption Index
Ekaterina Saltykova
Noize Absorption Index - is the manual trading system that measures the difference of pressure between bears forces and bulls forces. Green line - is a noize free index that showing curent situation. Zero value of index shows totally choppy/flat market.Values above zero level shows how powerfull bullish wave is and values below zero measures bearish forces.Up arrow appears on bearish market when it's ready to reverse, dn arrow appears on weak bullish market, as a result of reverse expectation.
SMC Venom 模型 BPR 指標是針對在智慧貨幣 (SMC) 概念內工作的交易者的專業工具。它會自動辨識價格圖表上的兩種關鍵模式: FVG (公平價值缺口)是三根蠟燭的組合,其中第一根和第三根蠟燭之間存在缺口。它在水平之間形成一個沒有成交量支撐的區域,這通常會導致價格調整。 BPR (平衡價格區間)是兩種 FVG 模式的組合,形成一個「橋樑」 - 當價格以低成交量活動移動時,突破並返回到水平的區域,從而在蠟燭之間產生間隙。 這些模式可協助交易者透過分析圖表上的交易量和價格動態(大型市場參與者和普通參與者之間的互動)來識別關鍵的支撐/阻力位、突破區域和切入點。 此指標以矩形和箭頭的形式可視化模式,也支援靈活的警報設定。 主要特點: 模式顯示模式:選擇顯示 BPR 模式(看漲和看跌)或 FVG 模式(看漲和看跌)。 可以隱藏所有圖表分析模式。 以條數過濾:BPR 結構中 FVG 之間的最小/最大距離。 訊號的附加視覺化: 箭頭有 9 種類型可供選擇(標準、細、分形等)或手動輸入 Wingdings 代碼,其表格可以選擇性地顯示在圖表上。 設定顏色、尺寸及其縮放時相對於價格的動態
Trend Monitor MT5
Pavel Zamoshnikov
4.5 (2)
The indicator generates early signals basing on ADX reading data combined with elements of price patterns. Works on all symbols and timeframes. The indicator does not redraw its signals. You see the same things on history and in real time. For better visual perception signals are displayed as arrows (in order not to overload the chart). Features The best results are obtained when the indicator works on two timeframes. For example: M30 – the indicator shows the main trend; M5 – the indicator gen
Naturu
Ivan Stefanov
“Naturu” 是一个使用大自然对称性作为算法的手动指标。 用简单策略和隐藏智慧,掌控市场! 加载指标后,您会看到两条线——上线(Top)和下线(Bottom)。 单击一次即可激活某条线。要移动,只需点击您想放置该线的那根K线。 您设定一个高点和一个低点,指标会自动计算: 洋红色区域,显示多空双方兴趣最接近之处,也就是最有可能成为支撑/阻力的区域。 灰色区域,标示下一层次的关注区。 青绿色线条,表示多方的目标价位。 金色线条,表示空方的目标价位。 手动指标赋予您完全的控制和灵活性,让您根据实时市场环境和个人直觉调整级别。它们迫使您更深入地亲自分析价格走势,帮助您真正理解支撑、阻力和形态是如何形成的。依靠人工判断,可以过滤掉自动系统常常误判的大量“噪音”,减少错误信号。而且,因您亲自设定每个级别,可在突发新闻或极端行情时立即调整,无需等候代码更新。 隐藏于简单游戏背后的神圣力量!
PipFinite Trend PRO MT5
Karlo Wilson Vendiola
4.84 (554)
Breakthrough Solution For Trend Trading And Filtering With All Important Features Built Inside One Tool! Trend PRO's smart algorithm detects the trend, filters out market noise and gives entry signals with exit levels. The new features with enhanced rules for statistical calculation improved the overall performance of this indicator. Important Information Revealed Maximize the potential of Trend Pro, please visit www.mql5.com/en/blogs/post/713938 The Powerful Expert Advisor Version Automatin
可以说,这是您可以为MetaTrader平台找到的最完整的谐波价格形成自动识别指标。它检测19种不同的模式,像您一样认真对待斐波那契投影,显示潜在的反转区域(PRZ),并找到合适的止损和获利水平。 [ 安装指南 | 更新指南 | 故障排除 | 常见问题 | 所有产品 ] 它检测19种不同的谐波价格形态 它绘制了主要,衍生和互补的斐波那契投影(PRZ) 它评估过去的价格走势并显示每个过去的形态 该指标分析其自身的质量和性能 它显示合适的止损和获利水平 它使用突破来表明合适的交易 它在图表上绘制所有样式比率 它实现了电子邮件/声音/视觉警报 受斯科特·M·卡尼(Scott M. Carney)的书的启发,该指标旨在满足最纯粹和最熟练的交易者的需求。但是,它采取了一种使交易更容易的方式:在向交易发出信号之前,它会等待Donchian朝正确方向突破,从而使交易信号非常可靠。 斐波那契投影与向量无关 它实现了电子邮件/声音/推送警报 它绘制了ABCD投影 重要提示: 为了符合 Scott M. Carney先生 的商标申诉,某些图案名称已重命名为不言自明的替代方式, Scott M.
SolarTrade Suite 金融指标:木星市场指标 - 您在金融市场世界中的可靠指南! 这是一个趋势指标,使用特殊的创新和高级算法来计算其值,并且具有令人赏心悦目的设计。 很容易理解此指标的读数:蓝色 - 买入,红色 - 卖出。 在说明底部查看我们来自 SolarTrade Suite 系列的其他产品。 您想自信地驾驭投资和金融市场的世界吗? SolarTrade Suite 金融指标:木星市场指标是一款创新软件,旨在帮助您做出明智的投资决策并增加您的利润。 SolarTrade Suite 金融指标:木星市场指标的优势: - 准确预测:我们的指标使用先进的算法和分析方法来准确预测市场走势。 接收有关买卖资产最佳时机的信号。 - 用户友好界面:直观的界面将使您能够轻松掌握该程序并在安装后立即开始享受其好处。 您可以从设置中更改点的大小和颜色、灵敏度和速度,所有其他设置都是自动完成的。 - 专家支持:我们的专业团队随时准备为您解答任何问题并提供有关使用该程序的建议。 为什么选择 SolarTrade Suite 财务指标:木星市场指标? - 可靠性和准确性:该
Terra Infinity
Ivan Simonika
Terra Infinity is a flat indicator. This improved version of the CalcFlat indicator has three additional lines that significantly increase its effectiveness. Unlike its predecessor with two static levels, Terra Infinity adds three dynamic lines above the main histogram, which are interpreted as follows: base signal line, minimum signal line, maximum signal line. These lines are formed using the additional parameter Avg, which is the average value of the histogram. Averaging produces a line cl
Fractal 358 Plus
Renato Fridschtein
Fractal 358 Plus is a predictive indicator that provides the clearest sight of price movements. Identifying graphic patterns such as Caixote (Crate), Pivot and Inside Candle , it shows entries and exits spots, as well as threats to your trades in the markets. It comes ready to use with B3 Mini Index (WIN$ series) and can be adjusted to use with any asset and timeframe. Fractal 358 unravels price movement Based on the Fibonacci sequence, Fractal 358 is a new and different way of reading and und
Double HMA MTF for MT5
Pavel Zamoshnikov
4 (4)
This is an advanced multi-timeframe version of the popular Hull Moving Average (HMA) Features Two lines of the Hull indicator of different timeframes on the same chart. The HMA line of the higher timeframe defines the trend, and the HMA line of the current timeframe defines the short-term price movements. A graphical panel with HMA indicator data from all timeframes at the same time . If the HMA switched its direction on any timeframe, the panel displays a question or exclamation mark with a tex
TrendDetect
Pavel Gotkevitch
The Trend Detect indicator combines the features of both trend indicators and oscillators. This indicator is a convenient tool for detecting short-term market cycles and identifying overbought and oversold levels. A long position can be opened when the indicator starts leaving the oversold area and breaks the zero level from below. A short position can be opened when the indicator starts leaving the overbought area and breaks the zero level from above. An opposite signal of the indicator can b
Atomic Analyst MT5
Issam Kassas
4.14 (21)
首先值得强调的是,该交易指标是非重绘、非延迟的指标,这使其成为手动和机器人交易的理想选择。 用户手册:设置、输入和策略。 Atomic Analyst是一种PA价格行动指标,利用价格的力量和动量来寻找市场上更好的机会。配备了高级过滤器,可帮助去除噪音和假信号,并提高交易潜力。使用多层复杂的指标,Atomic Analyst扫描图表,并将复杂的数学计算转化为任何初学者都能理解并用来做出一致交易决策的简单信号和颜色。 “Atomic Analyst”是专为新手和经验丰富的交易者量身定制的综合交易解决方案。它将高级指标和一流功能融合为一体的交易策略,使其成为所有类型交易者的多功能选择。 日内交易和剥头皮策略:专为快速准确的日内交易和短期交易而设计。 日内和摆动交易策略:可用作追求价格大幅波动的日内和摆动交易者的可靠工具。 多货币和市场:凭借其可靠的精度,在不同的工具和市场上运作。 多个时间框架:可在多个时间框架上使用,性能良好。 稳定性:所有指标均不重绘、不重绘和不滞后,确保可靠的信号。 信号清晰度:提供箭头信号,用于清晰的入场和出场点。 实时警报:通过交易入场、SL和TP警报通知交易者
Your Trend Friend
Luigi Nunes Labigalini
5 (1)
The trend is your friend! Look at the color of the indicator and trade on that direction. It does not  repaint. After each candle is closed, that's the color of the trend. You can focus on shorter faster trends or major trends, just test what's most suitable for the symbol and timeframe you trade. Simply change the "Length" parameter and the indicator will automatically adapt. You can also change the color, thickness and style of the lines. Download and give it a try! There are big movements w
Introduction to the Manual Backtesting Indicator on MQL5 The MetaTrader platform provides an excellent backtesting tool for evaluating Expert Advisors (EAs). However, when it comes to manually backtesting a strategy to assess its effectiveness, this tool has some limitations: You cannot manually draw zones or trend lines while in backtesting mode. You cannot switch timeframes to check time alignment. For example, if my strategy requires additional confirmation from a higher timeframe (HTF), this
用於確定平面和趨勢的指標。 如果價格低於兩條直方圖和兩條線(紅色和藍色)中的任何一條,則這是一個賣出區域。 購買此版本的指標時,一個真實賬戶和一個模擬賬戶的 MT4 版本 - 作為禮物(收到,給我寫私信)! 如果價格高於兩條直方圖和兩條線(紅色和藍色)中的任何一條,則這是一個買入區域。 MT4 版本: https://www.mql5.com/en/market/product/3793 如果價格在兩條線之間或在任何直方圖的區域內,那麼市場就沒有明確的趨勢。簡單地說,市場是平的。 指標的工作在屏幕截圖中更清楚地顯示。 該指標可用作獨立的交易系統。該指標可用於獲取領先數據或確定當前趨勢的方向。對於任何級別的交易者來說,這都是一個很好的工具!
Gioteen Volatility Index (GVI) - your ultimate solution to overcoming market unpredictability and maximizing trading opportunities. This revolutionary indicator helps you in lowering your losing trades due to choppy market movements. The GVI is designed to measure market volatility, providing you with valuable insights to identify the most favorable trading prospects. Its intuitive interface consists of a dynamic red line representing the volatility index, accompanied by blue line that indicate
The  SuperTrend Advance Trading  is a widely-used technical indicator based on  SuperTrend Strategy + Price Action + EMA . How it works: -  Buy/Sell Signals  can be generated when the trend reverses, the conditions of Price action, TrendLine and EMA are met. - After the  Signal  appears, be patient and wait until the candle closes, at that time place the order as soon as possible. You may have time to review your entry, consider whether it is a good entry or not. - Carefully review the entry, up
An indicator of pattern #31 ("Long Island") from Encyclopedia of Chart Patterns by Thomas N. Bulkowski. The second gap is in the opposite direction. Parameters: Alerts - show alert when an arrow appears   Push - send a push notification when an arrow appears (requires configuration in the terminal) GapSize - minimum gap size in points ArrowType - a symbol from 1 to 17 ArrowVShift - vertical shift of arrows in points   ShowLevels - show levels ColUp - color of an upward line ColDn - color of a d
PipFinite Exit EDGE MT5
Karlo Wilson Vendiola
4.86 (29)
Did You Have A Profitable Trade But Suddenly Reversed? In a solid strategy, exiting a trade is equally important as entering. Exit EDGE helps maximize your current trade profit and avoid turning winning trades to losers. Never Miss An Exit Signal Again Monitor all pairs and timeframes in just 1 chart www.mql5.com/en/blogs/post/726558 How To Trade You can close your open trades as soon as you receive a signal Close your Buy orders if you receive an Exit Buy Signal. Close your Sell orders if
PZ Trend Trading MT5
PZ TRADING SLU
3.8 (5)
许多盈利交易者不仅知道如何识别市场趋势,而且也能把握趋势建立后的交易机会。 Pz 趋势交易 指标设计用来在趋势行情中尽可能的赚取利润。 已建立的趋势提供了一揽子交易机会,但大多数趋势交易指标完全忽视了它们,让交易者在趋势行情时完全不知道该如何做!一般趋势指标只通知有关的趋势变化,但根本不足以得到卓越的回报. Pz 趋势交易 指标比一般趋势指标显示多达 20 倍的交易 , 因为它注重所谓的市场时机。它不仅显示当前的市场趋势,也有回调,内柱线的突破和调整。它令您在趋势回调之后介入,安全的柱线内突破金字塔加仓,以及发现潜在的反转,和已知的调整。 趋势改变 一个趋势改变在市场方向变化时发生。趋势变化在图表上用带数字的彩色圆圈显示。蓝色 (1) 信号为上涨开始, 而红色 (1) 信号为下跌开始。趋势变化并非评估当前价格动作的结果, 它意味着交易设置是不定时地。如果您正确使用本指标, 在趋势变化时, 您将将已经入场 (参看下面的调整)。 回调 但凡趋势在运动中,行情上下抖动,盈利者收割利润,且其它参与者入场。趋势回调代表好的买入机会,通常是由主力获利离场导致。如果行情在回调后回归上行, 指标将
PipFinite Breakout EDGE MT5
Karlo Wilson Vendiola
4.81 (94)
The Missing Edge You Need To Catch Breakouts Like A Pro. Follow a step-by-step system that detects the most powerful breakouts! Discover market patterns that generate massive rewards based on a proven and tested strategy. Unlock Your Serious Edge Important information here www.mql5.com/en/blogs/post/723208 The Reliable Expert Advisor Version Automate Breakout EDGE signals using "EA Breakout EDGE" Click Here Have access to the game changing strategy that will take your trading to the next l
HMA Trend Professional MT5
Pavel Zamoshnikov
4.25 (4)
Improved version of the free HMA Trend indicator (for MetaTrader 4) with statistical analysis. HMA Trend is a trend indicator based on the Hull Moving Average (HMA) with two periods. HMA with a slow period identifies the trend, while HMA with a fast period determines the short-term movements and signals in the trend direction. The main differences from the free version: Ability to predict the probability of a trend reversal using analysis of history data. Plotting statistical charts for analyzi
ATrend
Zaha Feiz
4.79 (14)
ATREND: 工作原理及使用方法 工作原理 “ATREND”指标针对MT5平台设计,旨在通过结合多种技术分析方法为交易者提供强有力的买卖信号。该指标主要利用平均真实波幅(ATR)来测量波动性,并结合趋势检测算法来识别潜在的市场动向。 购买后请留言,您将获得特别的赠品。 主要特点: - 动态趋势检测:该指标评估市场趋势并相应调整信号,帮助交易者与当前市场条件对齐策略。 - 波动性测量:通过使用ATR,该指标衡量市场波动性,这对于确定最佳止损(SL)和止盈(TP)水平至关重要。 - 信号可视化:该指标在图表上直观地表示买卖信号,增强交易者的决策能力。 操作步骤 输入和设置: - 时间框架:此输入允许您设置指标计算的主要时间框架,默认值为15分钟。 - 时间框架2:此输入可用于定义额外分析的辅助时间框架,默认值为1分钟。 - 移动:此参数允许您将指标的计算向回移动,默认值为0。 - SLATR:此输入定义用于根据ATR计算止损水平的乘数,默认值为2.56。 - TPATR:此输入定义用于根据ATR计算止盈水平的乘数,默认值也为2.56。 - AlertsOn:启用或禁用交易信号的警报,
这个指标用于比较图表上的交易品种与其他几个所选交易品种之间的强弱相对关系。 根据每个交易品种基于相同基准日的价格走势进行比较,可以看到几条不同走向的趋势线,反映出几个不同交易品种之间的强弱关系,这样可以更清楚地了解市场的趋势。 例如,你可以在EURUSD图表上应用这个指标,将其与货币对EURJPY和EURGBP进行比较,看看哪个更强。 你需要为指标输入参数: 需要比较的几个交易品种的名称 您需要选择比较基准日期。 请注意,使用指标前应确保相关交易品种的历史数据已经下载。 免费模拟版本是: https://www.mql5.com/zh/market/product/63921 .............................................
Rainbow EA MT5
Jamal El Alama
Description : Rainbow EA MT5 is a simple Expert advisor based on   Rainbow MT5 indicator witch is based on Moving average with period 34. The indicator is incorporated in the EA, therefore, it is not required for the EA to operate, but if you wish, you can download it from   my product page . The Expert Advisor settings are as follows : Suitable for Timeframes up to H1 The parameters below can be set according to your trading rules. StopLoss ( Stop Loss in pips) TakeProfit ( Take Profit in pips
Supertrend indicator uses a combination of a moving average and average true range to detect the trend of a trading instrument. Supertrend indicator for MetaTrader 5 easily shows the trend as a line following the price. Triple SuperTrend Histo indicator  calculate  three supertrends to show the trend as a histogram. Changing the color from red to green means you can BUY , from green to red means you can SELL . Description of the method of drawing a histogram. The price is above the EMA 200,
The new update makes this indicator a complete tool for studying, analyzing and operating probabilistic patterns. It includes: On-chart Multi-asset percentage monitor. Configurable martingales. Twenty-one pre-configured patterns, including Mhi patterns and C3. An advanced pattern editor to store up to 5 custom patterns. Backtest mode to test results with loss reports. Trend filter. Hit operational filter. Martingale Cycles option. Various types of strategies and alerts. Confluence between patter
该产品的买家也购买
Divergence Bomber
Ihor Otkydach
4.98 (51)
购买该指标的每位用户将额外免费获得以下内容: 原创工具“Bomber Utility”,该工具会自动跟踪每一笔交易,设置止损和止盈点,并根据策略规则自动平仓; 适用于不同交易品种的指标设置文件(Set 文件); 三种不同风险模式下的 Bomber Utility 设置文件:“最低风险”、“平衡风险” 和 “观望策略”; 一套详细的 视频操作手册,帮助您快速完成安装、配置并开始使用本交易系统。 注意: 要获取以上所有赠品,请通过 MQL5 的私人消息系统联系卖家。 我为您介绍原创的自定义指标 “Divergence Bomber”(背离轰炸机),它是一套基于 MACD 背离交易策略 的“全功能”交易系统。 该技术指标的主要任务是识别 价格与 MACD 指标之间的背离,并发出交易信号(包括推送通知),指示未来价格可能的运动方向。平均而言,这些信号的准确率超过 98%。有关该指标如何工作的详细说明,请观看本页面上的视频演示。 该系统使用 止损订单 和 动态回撤平仓机制 来管理交易。 Divergence Bomber 指标的主要特点: 支持交易的品种: AUDCAD、AUDCHF、AUDSG
Grabber System MT5
Ihor Otkydach
5 (14)
向您介绍一款优秀的技术指标——Grabber,它是一套即开即用的“全包式”交易策略。 在一个代码中集成了强大的市场技术分析工具、交易信号(箭头)、提醒功能和推送通知。 每位购买该指标的用户还可免费获得以下内容: Grabber辅助工具:用于自动管理已开仓位 视频操作指南:逐步教学如何安装、设置和使用该指标进行交易 原创Set文件:可快速自动配置,帮助实现最佳交易效果 忘掉其他策略吧!只有Grabber能够真正激励你在交易中攀登新高峰! Grabber策略的主要特点: 交易周期:从M5到H4 适用资产:任意,但我推荐我亲自测试过的品种(GBPUSD、GBPCAD、GBPCHF、AUDCAD、AUDUSD、AUDSGD、AUDCHF、NZDUSD、NZDCAD、EURCAD、EURUSD、EURAUD、EURGBP、EURCHF、USDCAD、USDSGD) 交易时间:全天候 24/7 交易效果:我分享自己的真实交易结果,并在此教学如何操作: https://www.mql5.com/ru/market/product/134563?source=Site+Market+MT5+Indic
Entry Points Pro for MT5
Yury Orlov
4.47 (131)
这款指标用于 MT5,可提供准确的入场交易信号,且无重绘。 它可应用在任何金融资产:外汇、加密货币、贵金属、股票、指数。 它将提供极其精准的评估,并告诉您何时开仓和平仓的最佳时机。 观看 视频 (6:22),其中包含一个仅处理单一信号的示例,该信号即可值回指标购价! 大多数交易者在 Entry Points Pro 指标的帮助下,在第一个交易周内即改善了他们的交易结果。 订阅我们的 Telegram 群 ! Entry Points Pro 指标的益处。 入场信号无重绘 如果信号出现,并得到确认,则它不会再消失;不像是重绘指标,它会导致重大的财产损失,因为它们可以在显示信号后再将其删除。 无差错开仓 指标算法可令您找到入场交易(买入或卖出资产)的理想时机,从而提高每位交易者的成功率。 Entry Points Pro 可操作任何资产 它允许您在 MT5 平台上交易任何经纪商的加密货币、股票、贵金属、指数、大宗商品和货币。 提供任何方向的信号 Entry Points Pro 指标提供针对任意价格走势的入场交易信号 - 上涨、下跌或横盘(横向)。 最大盈利潜力 离场信号
RelicusRoad Pro MT5
Relicus LLC
5 (20)
您购买了多少次交易指标,它们拥有 出色的回测, 真实账户表现证明 拥有惊人的数字和 各种统计数据, 但使用后您却 账户爆仓? 您不应该只相信一个信号本身,您需要知道它最初出现的原因,这正是 RelicusRoad Pro 的最佳之处! 用户手册 + 策略 + 培训视频 + 带 VIP 访问权限的私人群组 + 提供移动版本 观察市场的新方式 RelicusRoad 是 全球最强大、最好的交易指标 ,适用于外汇、期货、加密货币、股票和指数,为交易者提供发展账户所需的所有信息和工具。我们提供 技术分析 和 交易计划 ,帮助 每位交易者取得成功 ,无论是 初学者 还是 高级交易者 。 它是一个 关键交易指标 ,提供足够的信息来 预测 未来市场。我们相信一个 完整的解决方案 ,而不是图表上几个没有意义的不同指标。这是一个 一体化指标 ,显示 信号 、 箭头 + 价格行为 信息,这是 无与伦比 且 非常准确的 。   RelicusRoad 利用机器学习 (AI) 技术,为交易者提供必要的信息和工具,帮助他们成为成功的、知情的交易者。   通过领先指标预测未来价格 几乎 所有技术指标都滞后 ,
Algo Pumping
Ihor Otkydach
4.72 (18)
PUMPING STATION – 您的专属“全包式”交易策略 我们为您推出PUMPING STATION —— 一款革命性的外汇指标,它将使您的交易变得更加有趣且高效。这不仅仅是一个辅助工具,而是一套完整的交易系统,具备强大的算法,帮助您开始更加稳定的交易。 购买本产品,您将免费获得: 专属设置文件:用于自动配置,实现最大化性能。 逐步视频教程:学习如何使用PUMPING STATION策略进行交易。 Pumping Utility:专为PUMPING STATION打造的半自动交易机器人,让交易变得更加方便和简单。 购买后请立即联系我,我将为您提供所有额外资源的访问权限。 PUMPING STATION如何工作: 趋势监控:能够即时识别市场趋势方向。趋势是您最好的朋友。 进场信号:图表上的箭头会提示您何时进场以及交易方向。 明确的交易目标:指标会自动识别最佳的平仓时机。 回调交易:内置的基于布林带的价格通道可检测修正结束并发出新趋势开始的信号。 效率分析:如果当前设置效果较差,系统会自动提示。只需调整PUMPING STATION,即可获得最佳性能。 交易資產:我推薦我親自測試過的
Quantum TrendPulse
Bogdan Ion Puscasu
5 (15)
介绍 Quantum TrendPulse   ,这是一款终极交易工具,它将 SuperTrend   、   RSI 和 Stochastic 的强大功能整合到一个综合指标中,以最大限度地发挥您的交易潜力。该指标专为追求精准和效率的交易者而设计,可帮助您自信地识别市场趋势、动量变化以及最佳进入和退出点。 主要特点: 超级趋势整合: 轻松跟随当前的市场趋势并乘上盈利浪潮。 RSI 精度: 检测超买和超卖水平,非常适合把握市场逆转时机,可用作 SuperTrend 的过滤器 随机精度: 利用随机振荡在波动的市场中寻找隐藏的机会, 用作超级趋势的过滤器 多时间范围分析: 从 M5 到 H1 或 H4,在不同时间范围内关注市场动态。 可定制的警报: 当您的自定义交易条件得到满足时收到通知,这样您就不会错过任何交易。 无论您是新手还是经验丰富的交易员,   Quantum TrendPulse 都能为您提供所需的优势,帮助您增强策略并自信地进行交易。借助这一强大的指标,将洞察力转化为利润 — 掌控您的交易! ***购买 Quantum TrendPulse,即可免费获得 Quantum Tr
介绍     Quantum Breakout PRO   ,突破性的 MQL5 指标,正在改变您交易突破区域的方式!由拥有超过13年交易经验的资深交易员团队开发,     量子突破 PRO     旨在通过其创新和动态的突破区域策略将您的交易之旅推向新的高度。 量子突破指标将为您提供带有 5 个利润目标区域的突破区域的信号箭头,以及基于突破框的止损建议。 它既适合新手交易者,也适合专业交易者。 量子 EA 通道:       点击这里 重要的!购买后请私信我领取安装手册。 建议: 时间范围:M15 货币对:GBPJPY、EURJPY、USDJPY、NZDUSD、XAUUSD 账户类型:ECN、Raw 或 Razor,点差极低 经纪商时间:GMT +3 经纪商:IC Markets、Pepperstone with Raw 和 Razor 的点差最低 规格: 不重漆! 最多 5 个建议利润目标区域 建议止损水平 可定制的盒子。您可以设置自己的 Box Time Start 和 Box Time End。 接触 如果您有任何疑问或需要帮助,请通过私人消息与我联系。
TPSproTREND PrO MT5
Roman Podpora
4.72 (18)
VERSION MT4        —        ИНСТРУКЦИЯ RUS           —        INSTRUCTIONS  ENG 主要功能: 准确的输入信号,无需渲染! 如果出现信号,它仍然相关!这是与重提指标的一个重要区别,重提指标可以提供信号然后改变信号,这可能导致存款资金的损失。现在您可以以更高的概率和准确度进入市场。还有一个功能是在箭头出现后为蜡烛着色,直到达到目标(止盈)或出现反转信号。 显示止损/获利区域 为了提高搜索切入点时的视觉清晰度,创建了一个模块,该模块最初显示买入/卖出区域,在该区域中搜索进入市场的最佳点。用于处理止损水平的附加智能逻辑有助于随着时间的推移减小其大小,从而降低进入交易(移动 sl)时的初始风险。 显示较高时间范围内的最小值/最大值(MTF 模式) 添加了一项功能,可以显示较高时间间隔的最小/最大校正位置,并显示趋势变化。此外,MIN/MAX 现在有编号,显示修正内容。 风险回报率 (RR) 使用指标算法,可以检测精确的入场点,平均风险回报比超过1k2。这也伴随着视觉效果,例如,收到信号后会出现蜡烛的彩色草图。 无论
Berma Bands
Muhammad Elbermawi
5 (5)
Berma 波段 (BBs) 指标对于寻求识别和利用市场趋势的交易者来说是一种有价值的工具。通过分析价格与 BBs 之间的关系,交易者可以辨别市场是处于趋势阶段还是区间波动阶段。 访问[ Berma Home Blog ] 了解更多信息。 Berma 带由三条不同的线组成:上 Berma 带、中 Berma 带和下 Berma 带。这些线围绕价格绘制,直观地表示价格相对于整体趋势的变动。这些带之间的距离可以洞察波动性和潜在的趋势逆转。 当 Berma Bands 线相互分离时,通常表明市场正在进入横盘或区间波动时期。这表明缺乏明确的方向性。交易者可能会发现在这些时期内很难识别趋势,因此可能需要等待更清晰的趋势出现。 当 Berma Bands 线汇聚成一条线时,通常表示趋势环境强劲。这种汇聚表明存在明显的方向性偏差,因为价格波动性足以随趋势而变化。交易者可能会发现在这些时期更容易识别潜在的入场点和出场点,因为趋势的势头可以提供有利的交易机会。然而,重要的是要注意整体趋势中的潜在回调或修正。 Berma 带根据价格蜡烛图与上带和下带的相互作用提供明确的买入和卖出信号。当价格蜡烛图首
PZ Day Trading MT5
PZ TRADING SLU
2.83 (6)
该指标仅使用价格行为分析和donchian渠道以锯齿形检测价格反转。它是专门为短期交易而设计的,根本不需要重新粉刷或补漆。对于精明的交易者来说,这是一个绝佳的工具,旨在增加他们的运作时间。 [ 安装指南 | 更新指南 | 故障排除 | 常见问题 | 所有产品 ] 极易交易 它在每个时间段都提供价值 实施自我分析统计 它实现了电子邮件/声音/视觉警报 基于可变长度的突破和拥挤区域,该指标仅使用价格行为来选择交易并对市场快速做出反应。 显示过去信号的潜在利润 该指标分析其自身的质量和性能 突围的损失突出显示并解决 该指标是不可重涂和不可重涂的 该指标将帮助盘中交易者不要错过单个价格反转。但是,并非所有价格反转都是一样的,也不是具有相同的可行质量。决定要突破哪些突破而忽略哪些取决于交易者的良好判断。 如何解释统计数据 该指标研究其自身信号的质量,并在图表上绘制相关信息。将分析每笔交易,并在图表的左上角显示总体历史结果,这使您可以针对任何给定的工具和时间范围自行优化指标参数。每个乐器和时间表都有其自己的最佳设置,您可以自己找到它们。 最大优惠交易:对于任何给定的交易,MFE都是最好的结
“ Dynamic Scalper System MT5 ”指标专为在趋势波内进行剥头皮交易而设计。 已在主要货币对和黄金上进行测试,并可与其他交易工具兼容。 提供顺势短线建仓信号,并提供额外的价格变动支持。 指标原理: 大箭头决定趋势方向。 在趋势波内,我们采用一种生成小箭头形式的剥头皮交易信号的算法。 红色箭头代表看涨方向,蓝色箭头代表看跌方向。 敏感的价格变动线会沿着趋势方向绘制,并与小箭头信号协同作用。 信号运作方式如下:当线在适当时刻出现时,将形成入场信号;在出现线时,持仓;线完成后,平仓。 建议的操作时间范围为M1 - H4。 箭头在当前K线上方形成,如果下一根K线已开仓,则不会重新绘制上一根K线上方的箭头。 输入参数 Trend Wave Period - 趋势方向(大箭头)的周期,改变趋势波的时间间隔。值 1 表示趋势方向的最长持续时间,参数值越大,持续时间越短。 Scalper Arrows Period - 信号箭头(小箭头)的计算周期,改变入场信号的生成频率。值 3 表示最频繁的生成频率,参数值越大,箭头频率越低,准确度越高。 这些参数可以根据不同
Momentum Hunter MT5
Ashkan Hazegh Nikrou
Momentum Hunter – 高级无重绘动量指标 Momentum Hunter   是一款强大且可靠的指标,旨在检测新的市场动量,帮助交易者精准捕捉行情走势。该指标专为   M1 时间框架   优化,同时也适用于更高的时间框架,适合剥头皮和波段交易者。 主要功能: 无重绘 & 无延迟 :信号稳定,箭头只在蜡烛收盘后出现。 简洁界面 :图表干净简洁,仅显示箭头、止损价格标签和跟踪止损价格标签,无复杂按钮。 即时提醒 :每当信号出现时,可直接在 MetaTrader 和您的移动设备上收到通知。 适合所有交易者 :无论您是在 M1 剥头皮还是在高时间框架交易,Momentum Hunter 都能适应您的交易风格。 此高级工具结合了多种经过验证的策略,包括: 移动平均线   用于趋势方向 布林带   用于波动率分析 RSI   用于动量强度 蜡烛形态分析   用于精准入场 通过这种智能组合, Momentum Hunter   能识别高概率入场点,并直接在图表上显示 箭头 ,帮助交易决策更加快速明了。 为您的安全而设计 Momentum Hunter 不仅仅是一个入场信号工具: 安全止
Trend Forecaster
Alexey Minkov
5 (7)
The Trend Forecaster indicator utilizes a unique proprietary algorithm to determine entry points for a breakout trading strategy. The indicator identifies price clusters, analyzes price movement near levels, and provides a signal when the price breaks through a level. The Trend Forecaster indicator is suitable for all financial assets, including currencies (Forex), metals, stocks, indices, and cryptocurrencies. You can also adjust the indicator to work on any time frames, although it is recommen
MonetTrend
Aliya Bolek
MonetTrend — Премиум-индикатор для торговли по тренду (M30, H1, H4) MonetTrend — это мощный и визуально понятный трендовый индикатор, созданный для торговли на таймфреймах M30, H1 и H4. Он идеально подходит для работы с волатильными инструментами, такими как: • Золото (XAUUSD) • Криптовалюты (BTCUSD) • Валютные пары (EURUSD, USDJPY и др.) Ключевые особенности MonetTrend: • Автоматическое отображение Take Profit 1 (TP1) и Stop Loss (SL): После появления сигнала индикатор сразу показывает: • TP
Piranha version 2
Maria Strudov
5 (1)
"Piranha" - an autonomous trading system that determines overbought and oversold levels on the chart. Red and blue zones represent overbought and oversold levels respectively. Entry points are marked with arrows: a downward arrow in the red zone for "sell" and an upward arrow in the blue zone for "buy". The Take profit level is indicated by the green moving average. Key features: Adjusting the Take profit level as the green moving average changes position. Averaging ability when a new market e
Introducing the South African Sniper indicator created by a small group of traders with a few years trading trading the financial market profitably . This is a plug and play indicator that provides you with  BUY and SELL (SNIPER ENTRY) signals with TARGET and trail stops. The indicator Works with all MT5 trading instruments. The indicator uses previous  chart data as receipt to speculate on future market moves.  "The South African Sniper indicator community are very happy with the indicator and
IQ FX Gann Levels a precision trading indicator based on W.D. Gann’s square root methods. It plots real-time, non-repainting support and resistance levels to help traders confidently spot intraday and scalping opportunities with high accuracy. William Delbert Gann (W.D. Gann) was an exceptional market analyst, whose trading technique was based on a complex blend of mathematics, geometry, astrology, and ancient mathematics which proved to be extremely accurate. Download the Metatrader 4 Version M
PZ Swing Trading MT5
PZ TRADING SLU
5 (5)
Swing Trading 是第一个旨在检测趋势方向的波动和可能的反转波动的指标。它使用在交易文献中广泛描述的基准摆动交易方法。该指标研究多个价格和时间向量,以追踪总体趋势方向,并检测市场超卖或超买并准备好进行修正的情况。 [ 安装指南 | 更新指南 | 故障排除 | 常见问题 | 所有产品 ] 市场波动的利润不会被窃取 指示器始终显示趋势方向 彩色价格带代表机会基准 彩色虚线表示可能的反转波动 该指标分析其自身的质量和性能 它实现了一个多时间仪表板 可定制的趋势和波动周期 它实现了电子邮件/声音/推送警报 指示器为非重涂或重涂 什么是摇摆交易 摇摆交易是一种尝试在一天到一周内从证券中获得收益的交易方式,尽管某些交易最终可以保持更长的寿命。摇摆交易者使用技术分析来买入弱点和卖出力量,并有耐心等待这些机会的发生,因为在发生一波抛售浪潮之后购买证券而不是陷入抛售更有意义。 机会基准 关于历史数据的大量研究证明,适合于波动交易的市场倾向于在基线价格带上下交易,基线价格带由图表显示,使用平均真实区间计算得出。波动交易者使用基线,该策略是购买常态和卖出躁狂,或做空常态并掩盖沮丧。在没有疲
PulseTrend MT5
Yuriy Lyachshenko
该指标显示趋势方向、入场箭头以及交易的最佳出场点。所有信号的统计数据也会显示,以便进行更好的交易分析。 MT4的指标版本 功能 该指标不会重新绘制。 它可用于交易任何资产:加密货币、股票、金属、指数、大宗商品和货币。 它适用于所有时间框架。 入场信号在新的蜡烛开盘时出现。 平仓信号是近似的,因为您通常可以以更高的利润平仓。 左上角有一个详细的交易统计面板,可以折叠。 它在从M1到W1的时间框架上立即显示趋势方向。 它具有轻量级代码,因此不会加载或减慢终端。 为避免错过入场信号,可通过警报窗口和推送通知接收提醒。   适用于所有水平的用户,从新手到专家。 统计面板 信号历史数据的采样天数。   提供统计数据的信号总数。 盈利与亏损信号的比例。   盈利信号占总信号的百分比。   每条信号的平均盈利。   所有信号的总盈利。   每条信号的平均亏损。   所有信号的总亏损。   最后一次与经纪商服务器通信的时间。   当前点差。 趋势方向(上/下)在从M1到W1的时间框架上。 设置 Length 指标敏感度 Font size 统计面板的字体大小 Show arrows 在趋势变化时
Pipsator MT5
Yuriy Lyachshenko
该指标显示趋势方向、入场点以及最合适的出场点。它还显示所有信号的统计数据,以改善交易分析。 MT4的指标版本 特点 该指标不会重绘。 可用于交易任何资产:加密货币、股票、金属、指数、商品和货币。 适用于所有时间框架。 入场信号在新K线开盘时出现。 出场信号为大致估计,因为您通常可以以更大的利润平仓。 左上角显示详细的交易统计面板,可折叠。 显示从M1到W1时间框架的趋势方向。 代码轻量,不会使终端过载或变慢。 为避免错过入场信号,您可以通过Alert窗口和推送通知接收提醒。 适合从初学者到专家的各级用户。 统计面板 信号历史的统计天数。 提供统计的信号总数。 盈利信号与亏损信号的比例。 盈利信号占总信号的百分比。 每个信号的平均利润。 所有信号的总利润。 每个信号的平均亏损。 所有信号的总亏损。 最后一次到经纪商服务器的 ping 时间。 当前点差。 从M1到W1时间框架的趋势方向(上升/下降)。 设置参数 "Period" :指标灵敏度。 "Font size" :统计面板的字体大小。 "Show line" :启用/禁用显示趋势线。 "Show circles" :启用/禁用在趋
TPSpro RFI Levels MT5
Roman Podpora
4.55 (20)
反转区域 / 峰值交易量 / 主要参与者的活跃区域 =       TS TPSPRO系统 俄语使用说明     /       指示     英语     /           MT4版本      该指标的每位购买者还可免费获得: 6 个月内可访问 RFI SIGNALS 服务的交易信号 - 根据 TPSproSYSTEM 算法准备的切入点。 定期更新的培训材料 - 让您沉浸在策略中并提高您的专业水平。 工作日每天 24 小时提供支持,并可以访问封闭的交易者聊天室 - 沟通、协助和市场情况分析。 作者设定的文件——自动指标设置,无需额外努力即可实现最大效果。 主要功能: 显示卖家和买家的活跃区域! 指标显示所有正确的买入和卖出第一脉冲水平/区域。当这些水平/区域被激活时,即开始寻找切入点的地方,水平会改变颜色并填充特定颜色。还会出现箭头,以便更直观地了解情况。 LOGIC AI - 激活模板时显示用于搜索入口点的区域(圆圈) 为了提高视觉清晰度,添加了使用人工智能搜索入口点的显示区域的功能。 显示更高时间范围内的级别/区域(MTF 模式) 添加了使用更高时间间隔显示级别/区域
发现趋势。读取模式。把握入场时机。 三步只需30秒!轻松交易 — 无需分析,您的智能助手已准备好简化您的工作流程 不再因图表信息过载而困扰。 通过智能趋势偏向检测自信交易。 兼容所有货币、加密货币、股票、贵金属、指数及任意时间框架。 只需点击并执行 — 就这么简单。 非常适合希望快速清晰交易的忙碌交易者。 TPTSyncX 是一款强大的全能 MetaTrader 5 指标,可无缝同步 趋势、图形模式 与 K线触发 分析,并以清晰智能的可视化系统呈现。专为追求清晰度、精确性和速度的交易者设计,它通过结合价格行为、结构模式和市场时机工具,帮助识别高概率交易机会。 主要功能: 智能可视化显示: 自动绘制价格结构模式,并清晰标注高点高 (HH)、低点高 (HL)、高点低 (LH) 与低点低 (LL) 于图表上 — 实时展现市场结构变化与潜在反转区域,对识别趋势转换与价格突破至关重要。 订单区块 & 公允价值缺口自动识别: 只需在图表上双击,即可自动检测订单区块与公允价值缺口,突显潜在机构痕迹与失衡区域。 动态移动平均线: 根据所选目标K线范围自动调整周期,适用于短线剥头皮或长线波段交易的动态
MetaForecast M5
Vahidreza Heidar Gholami
5 (3)
MetaForecast能够根据价格数据中的谐波来预测和可视化任何市场的未来走势。虽然市场不总是可预测的,但如果价格中存在模式,MetaForecast可以尽可能准确地预测未来。与其他类似产品相比,MetaForecast通过分析市场趋势可以生成更精确的结果。 输入参数 Past size (过去的尺寸) 指定MetaForecast用于创建生成未来预测模型的柱数量。该模型以一条黄色线绘制在所选柱上。 Future size (未来的尺寸) 指定应预测的未来柱数量。预测的未来以粉色线表示,并在其上绘制了蓝色回归线。 Degree (程度) 此输入确定了MetaForecast将在市场上进行的分析级别。 Degree 描述  0 对于程度0,建议使用较大的值来设置“过去的尺寸”输入,以覆盖价格中的所有高峰、低谷和细节。  1 (建议的) 对于程度1,MetaForecast可以理解趋势,并通过较小的“过去的尺寸”生成更好的结果。  2 对于程度2,除了趋势,MetaForecast还可以识别反转点。对于大于1的程度,必须使用较高的“细节”和“噪音减少”输入值。  大于2 不建议使用大于
Cycle Maestro MT5
Stefano Frisetti
5 (1)
NOTE: CYCLEMAESTRO is distributed only on this website, there are no other distributors. Demo version is for reference only and is not supported. Full versione is perfectly functional and it is supported. CYCLEMAESTRO , the first and only indicator of Cyclic Analysis, useful for giving signals of TRADING, BUY, SELL, STOP LOSS, ADDING. Created on the logic of   Serghei Istrati   and programmed by   Stefano Frisetti ;   CYCLEMAESTRO   is not an indicator like the others, the challenge was to inter
Golden Spike Premium
Kwaku Bondzie Ghartey
5 (1)
GOLDEN SPIKES PREMIUM INDICATOR Acknowledgement:  The name of this indicator was inspired by Mr. Grant Koopman, a knowledgeable and experienced synthetic indices trader. This premium version is dedicated to advancing synthetic indices trading excellence. Overview Check out full user guide from this link :  https://drive.google.com/drive/folders/1ozVOIvLAlqOrnVc-6XkUMh6qzYuDWoGd?usp=sharing Golden Spikes Premium is a groundbreaking trading indicator meticulously crafted for Boom and Crash indic
Quantum Trend Sniper
Bogdan Ion Puscasu
4.73 (52)
介绍   量子趋势狙击指标 ,突破性的 MQL5 指标,正在改变您识别和交易趋势反转的方式!由拥有超过13年交易经验的资深交易员团队开发,     量子趋势狙击指标   旨在通过其创新的方式以极高的准确度识别趋势反转,将您的交易之旅推向新的高度。 ***购买量子趋势狙击指标,即可免费获得量子突破指标!*** 当量子突破指标识别出趋势反转时,它会向您发出警报和信号箭头,并建议您三个止盈水平。 它既适合新手交易者,也适合专业交易者。 量子 EA 通道:       点击这里 MT4版本:       点击这里 建议: 时间范围: 所有时间范围。为了获得最佳结果,我们建议在 M15、M30 和 H1 时间范围内使用它。 货币对:欧元兑美元、英镑兑美元、澳元兑美元、欧元兑英镑、, EURAUD,  XAUUSD 账户类型:ECN、Raw 或 Razor,点差极低 经纪时间:任意 经纪商:IC Markets、Pepperstone with Raw 和 Razor 的点差最低 建议止损:50 点 建议止盈水平:20 点、50 点和 100 点 规格: 不重漆! 最
This indicator scans for you up to 15 trading instruments and up to 21 time frames for occurrences of the high probability reversal patterns: Double Tops/Bottoms with fake breakouts . What this indicator detects: This indicator detects a special form of Double Tops and Bottoms, so called Double Tops/Bottoms with fake breakouts . For double tops with fake breakouts the highest price of the right shoulder must be higher than the left shoulder. For double bottoms with fake breakouts the lowest pric
Transaction Speed MT5
Ivan Stefanov
5 (2)
当然,以下是翻译成中文(简体)的版本: 该指标标出市场中显现出 交易兴趣 的区域,并随后显示 订单积累区域 。它的工作方式类似于大规模的订单簿。 这是为 大资金 打造的指标,性能卓越。市场中有任何兴趣,你都能通过它清晰看到。 (这是一个 完全重写的自动化版本 —— 不再需要手动分析。) 交易速度 是一个全新的概念指标,它显示了市场上大订单 何时 、 何地 聚集,并揭示了其背后的意义。它可以在 非常早期 就检测到趋势的变化。 在外汇市场,所谓的“交易量”实际上是误导性的,因为那指的是价格在单位时间内的变化,因此真正的名称应是“交易速度”。 一切都取决于我们如何思考、如何行动、如何分析。 改变分析范式至关重要。 该指标完全重构了外汇市场上“交易量”的概念,用逻辑方式重新定义并应用,从而成为一个 独特而精准的工具 。 使用方法: 默认情况下,指标处于 自动模式 ,可独立用于任何时间周期。如果你希望切换到手动模式,只需点击 Auto / Manual Mode 按钮即可。 在 手动模式 下,所有计算从 2025年1月1日 开始。你可以根据需要更改该日期,以查看不同的分析结果。 最优数据周期
ACB Breakout Arrows MT5
KEENBASE SOFTWARE SOLUTIONS
5 (1)
ACB Breakout Arrows 指标通过检测特殊的突破形态,提供市场中的关键入场信号。该指标持续扫描图表中的价格动量,在价格出现重大变动前,提前提供精确的入场信号。 点击此处获取多品种多周期扫描器 - ACB Breakout Arrows MT5 扫描器 主要特点 指标自动提供止损和止盈价格。 内置多周期扫描仪仪表盘,可追踪所有时间周期的突破信号。 适用于日内交易者、波段交易者和剥头皮交易者。 优化算法提升信号精度。 特别设置的快速盈利线用于无亏损移动或短线目标。 支持胜率、盈亏比、平均利润等绩效分析指标。 无重绘,信号可靠。 交易确认 - 可使用 ACB Trade Filter 指标 来过滤低概率的交易信号。 强烈买入: 向上箭头 + 绿色柱状图 + 多头趋势。 强烈卖出: 向下箭头 + 红色柱状图 + 空头趋势。 当柱状图为灰色且趋势为震荡时,应避免交易。 (可选) -  使用  KT 支撑阻力水平指标  避免在重要支撑/阻力位附近入场。这类交易可能迅速变成亏损。 “一个成功交易者的目标是做出最好的交易。金钱只是附属。” —— 亚历山大·埃尔德 输入参数 历史
Blahtech Supply Demand MT5
Blahtech Limited
4.54 (13)
Was: $299  Now: $149  Supply Demand uses previous price action to identify potential imbalances between buyers and sellers. The key is to identify the better odds zones, not just the untouched ones. Blahtech Supply Demand indicator delivers functionality previously unavailable on any trading platform. This 4-in-1 indicator not only highlights the higher probability zones using a multi-criteria strength engine, but also combines it with multi-timeframe trend analysis, previously confirmed swings
作者的更多信息
Brazil Index Bot
Rodrigo Silva
5 (1)
Informações Importantes sobre o Brazil Index Bot (BACKTEST VISUAL desativado para proteger parte da Estratégia.) Se você está procurando um robô que cumpre aquilo que promete, você acabou de encontrar! O Brazil Index Bot irá superar todas as suas expectativas com certeza! E o melhor de tudo, é só colocar na sua conta, ligar e já começar a lucrar! Deseja conhecer mais sobre o Brazil Index Bot e seus resultados? Baixe agora os relatórios detalhados em: https://bit.ly/INFOSBRAZILINDEXBOT (Utilize e
Informações Importantes sobre o Bra50 Index Bot (BACKTEST VISUAL desativado para proteger parte da Estratégia.) Se você está procurando um robô que cumpre aquilo que promete, você acabou de encontrar! O Brazil Index Bot irá superar todas as suas expectativas com certeza! E o melhor de tudo, é só colocar na sua conta, ligar e já começar a lucrar! Deseja conhecer mais sobre o Bra50 Index Bot e seus resultados? Baixe agora os relatórios detalhados em: https://bit.ly/INFOSBRAZILINDEXBOT (Utilize es
Informações Importantes sobre o CryptoHacker (Não repinta! Não gera sinais atrasados!) Se você está procurando um indicador que cumpre aquilo que promete, você acabou de encontrar! O CryptoHacker irá superar todas as suas expectativas com certeza! E o melhor de tudo, é só colocar na sua conta, ligar e já começar a lucrar! O CryptoHacker é um sistema profissional de trade criado para as plataformas MT4 & MT5 e otimizado para trabalhar com CryptoMoedas. Nosso sistema utiliza uma poderosa lógic
Informações Importantes sobre o ArrowHacker (Não repinta! Não gera sinais atrasados!) Se você está procurando um indicador que cumpre aquilo que promete, você acabou de encontrar! O ArrowHacker irá superar todas as suas expectativas com certeza! E o melhor de tudo, é só colocar na sua conta, ligar e já começar a lucrar! O ArrowHacker é um sistema profissional de trade criado para as plataformas MT4 & MT5 e otimizado para trabalhar com qualquer ativo na plataforma MetaTrader 5, sejam moedas, m
筛选:
无评论
回复评论
版本 2.0 2020.04.22
Compiled by Build 2361.