Geo Fractals
- 指标
- 版本: 2.20
- 更新: 24 二月 2025
- 激活: 5
分形的专业指标。在一个打开的图表上提供“多屏幕”操作模式。
专为黄牛和“精确”作品的爱好者而设计。
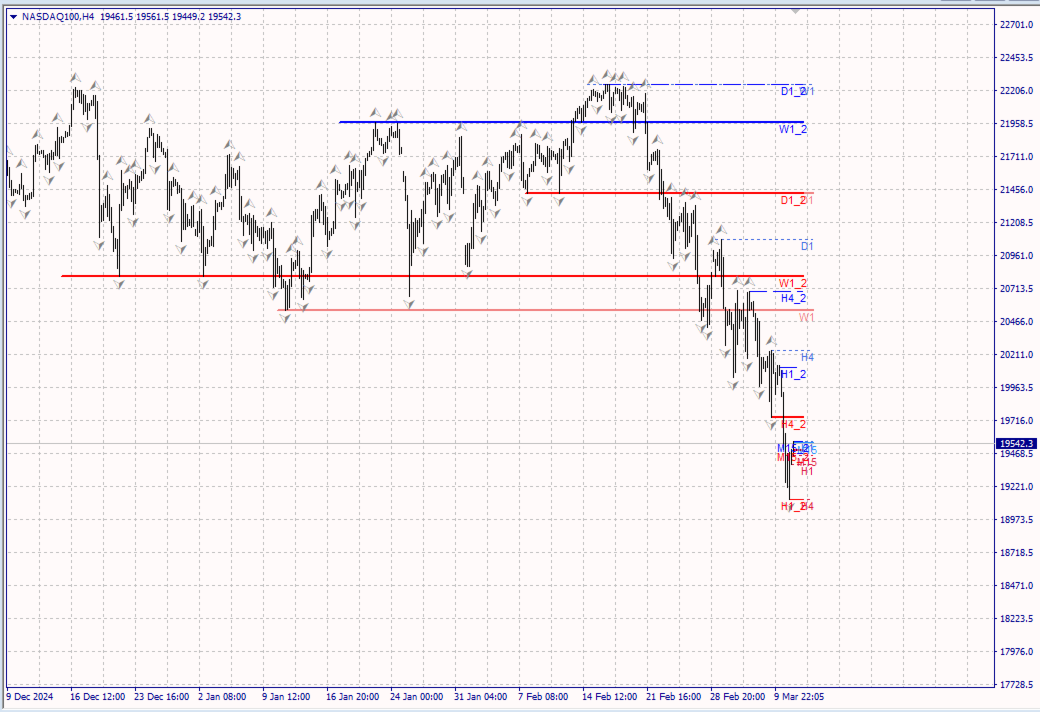
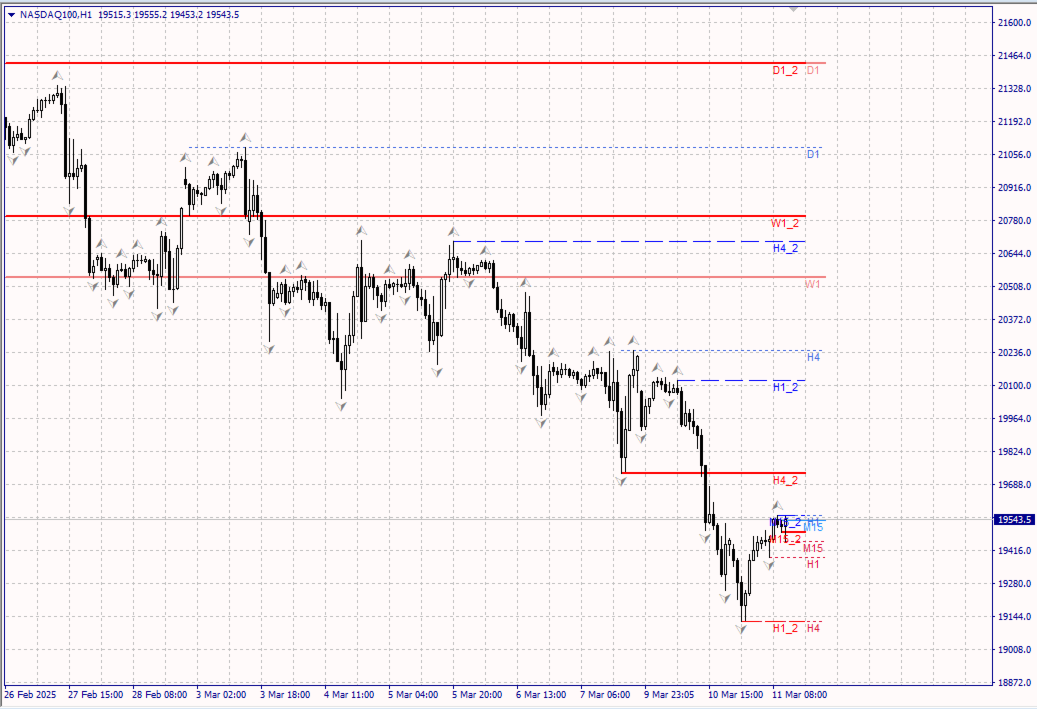
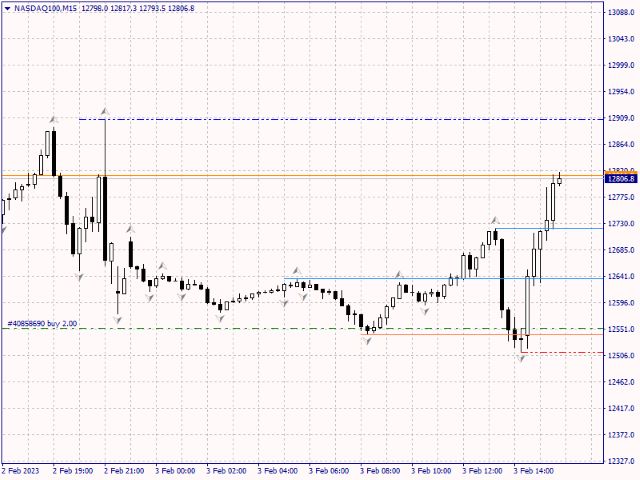
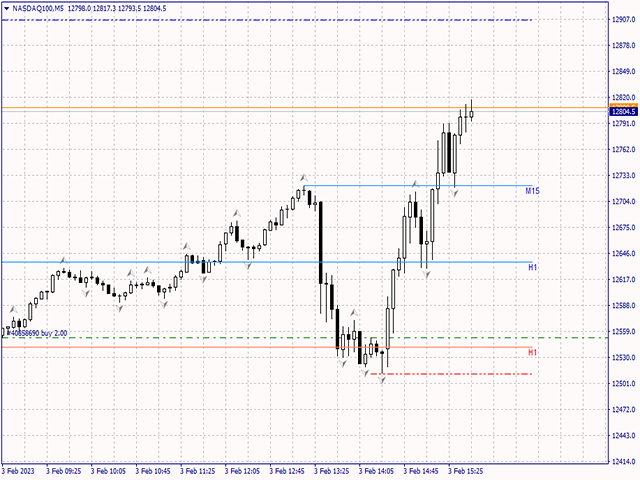
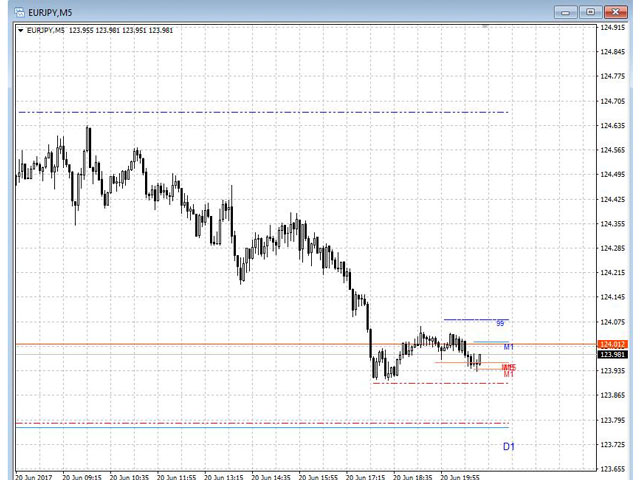
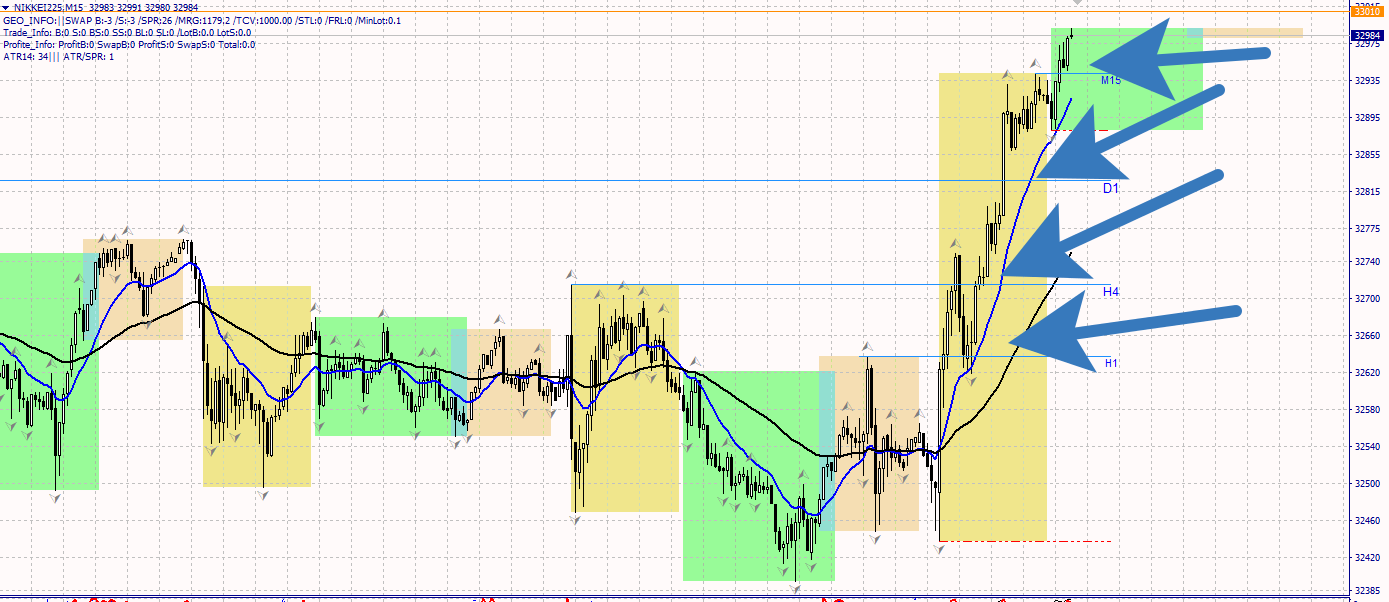
显示六个时间范围内的分形,并在较低的时间范围内显示从价格到新出现的分形的距离,这提供了价格行为的透明性以及在支点处监视价格行为的独特准确性。
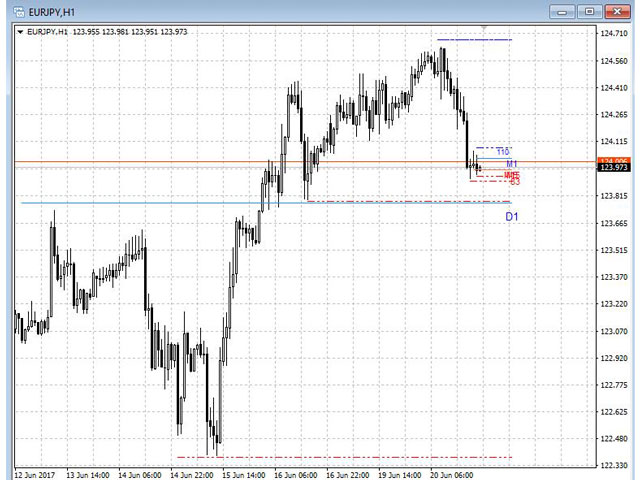
指示器同时显示分形和时间范围 W1.D1,H4,H1,M15,M5,M1。
要选择显示所需的时间范围,请使用相应的指标参数:
ShowW1=true;
ShowD1 = true;
ShowD1 = true;
ShowH4 = true;
ShowH1 = true;
ShowM15 = true;
ShowM5 = true;
ShowM1 = true;
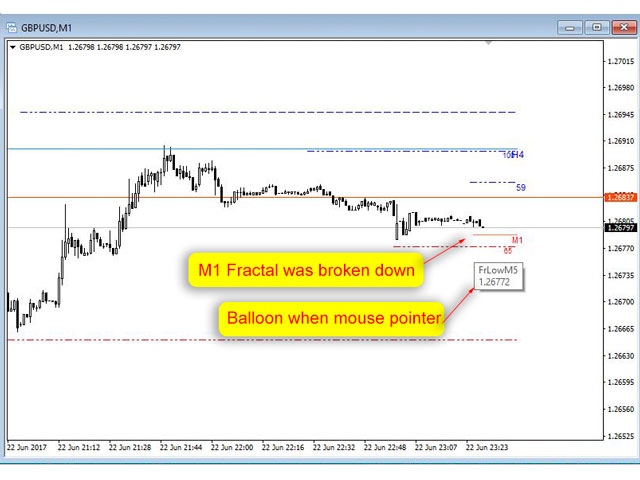
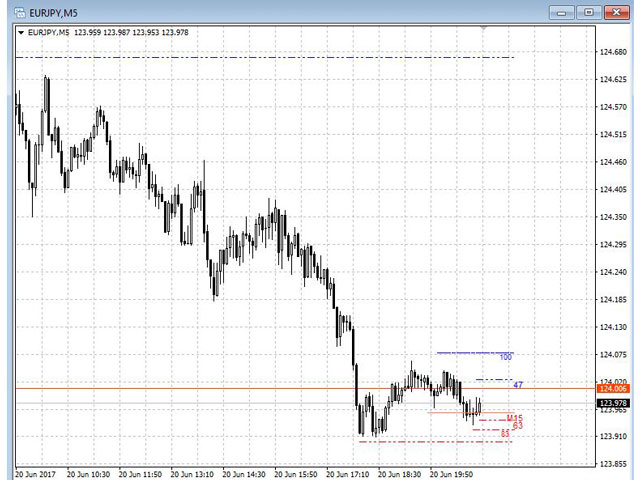
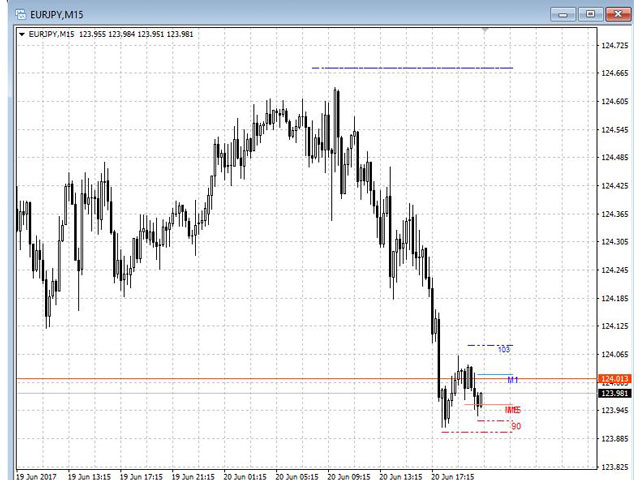
对于M1和M5时间范围,与价格的距离(买入价和卖价)以点为单位显示。
如果分形没有被价格打折,则会以虚线显示。工具提示指示线条是否属于时间范围。
破碎的分形显示为实线,并用文本标签标记,表明该线属于相应的时间范围。
您将能够通过分形线的价格或无法突破该水平的价格来固定即时联系,并在此基础上决定进一步的价格行为。
仅一个参数用作输入参数:是否添加1点(五位数字仪器为10点)来显示分形的水平。
当显示较高的分形时,也会加上电流分布。
参数
ShowW1, ShowD1,ShowH4,ShowH1,ShowM15,ShowM5,ShowM1 = true; -正确或错误-选择要显示的时间范围
UseShift-如果为True,则分形线将从价格极端移动1点(五位数工具为10点)。如果为False,则不使用任何偏移量。我正在使用True。这使您可以将停靠点直接放在分形线的后面。
for me, one of the best support resistance indicator and the best fractal! So glad I got it. HAS REALLY GOOD FEATURES YOU DO NOT GET IN OTHER INDICATORS.