Georgij Komarov / 个人资料
- 信息
|
8+ 年
经验
|
6
产品
|
32
演示版
|
|
0
工作
|
0
信号
|
0
订阅者
|
Advanced Order Manager — MetaTrader 4 高级订单管理专家 Advanced Order Manager 是一款用于MetaTrader 4交易平台的专业订单管理工具。该EA不自行开仓,而是专门用于直接从图表上快捷管理已开仓位和挂单。该工具将便捷的控制面板与自动持仓追踪功能相结合,减少了手动操作数量,并最小化情绪对交易决策的影响。 核心功能 📊 订单管理 按魔术码灵活筛选订单: -1 — 管理账户上的所有订单 0 — 仅手动订单(无魔术码) 特定数值 — 特定EA或脚本的订单 支持所有订单类型:市价单和挂单 可管理手动及自动设置的订单 🎯 主要功能 一键平仓所有市价单 按盈亏结果平仓,并带有可视化指示: 按钮绿色 — 盈利仓位 按钮红色 — 亏损仓位 按钮橙色 — 盈亏平衡 一键删除所有挂单 具备灵活设置的自移动至盈亏平衡点功能 达到目标后自动平仓: 按账户净值目标 按目标利润 ⚙️ 自动功能 自动盈亏平衡 — 自动将止损移动至盈亏平衡区域 达到设定目标后自动平仓
Эти уровни отрабатываются !
И Вам не надо их искать - цена рисует их сама! Если , конечно, у Вас есть новый индикатор Geo_2Fractals!!!
https://www.mql5.com/ru/market/product/23792
Также доступна версия для mq5!!!
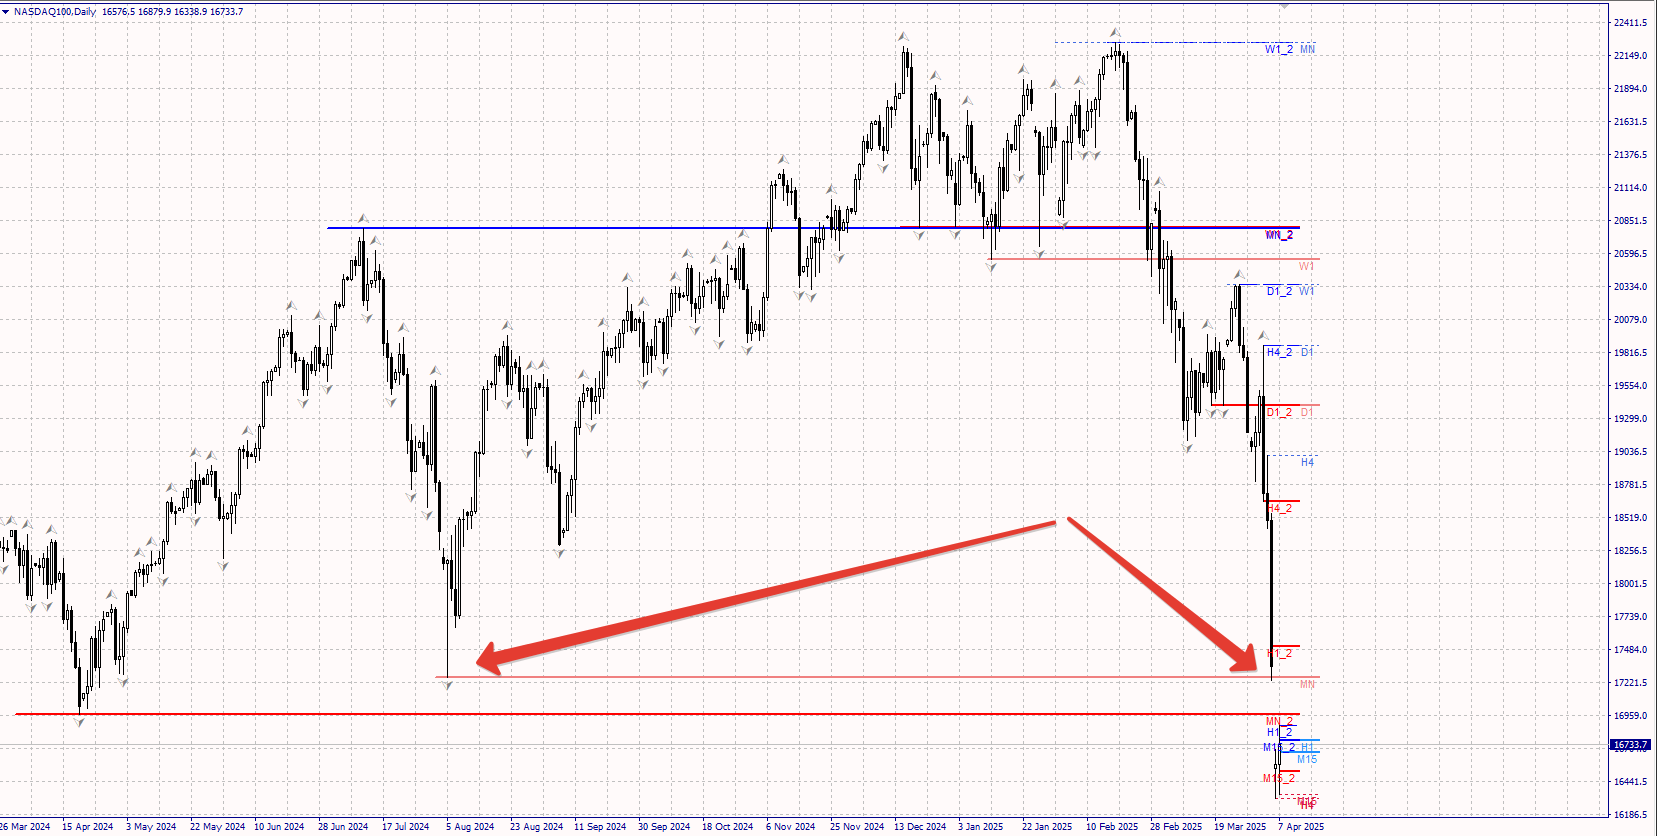
这就是Geo Fractals第二版指标在自动模式下绘制价格水平的方式。
您将始终看到重要的价格水平,助您做出交易决策。
了解更多关于Geo Fractals第二版指标的信息。
即将支持MT5!
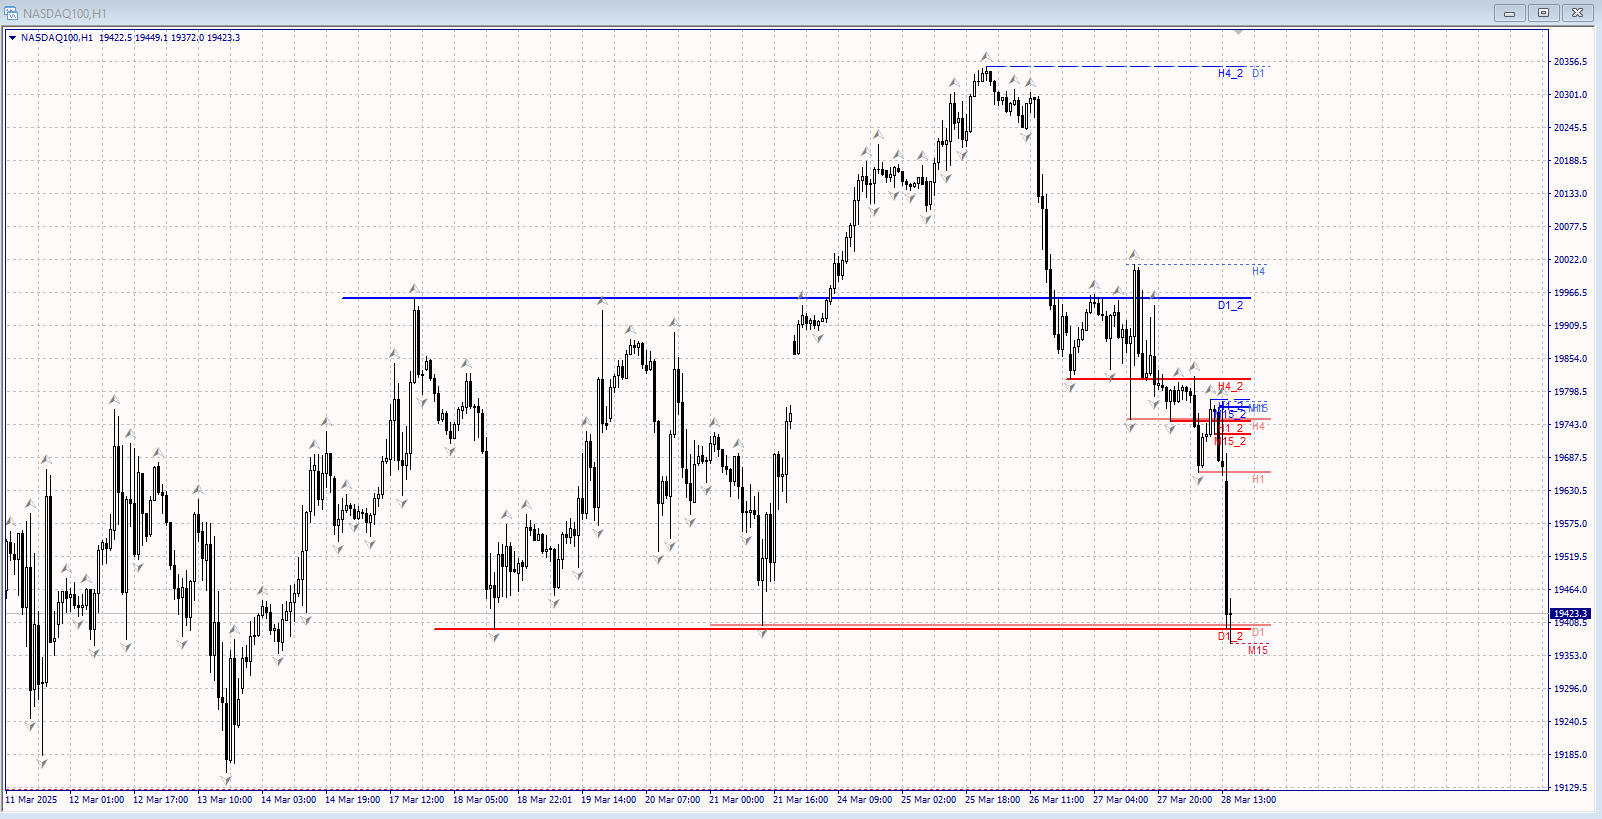
Now you will always have important price levels displayed to help you make informed decisions.
Learn more about the Geo Fractals version 2 indicator.
Coming soon for MT5!
https://www.mql5.com/ru/market/product/23792
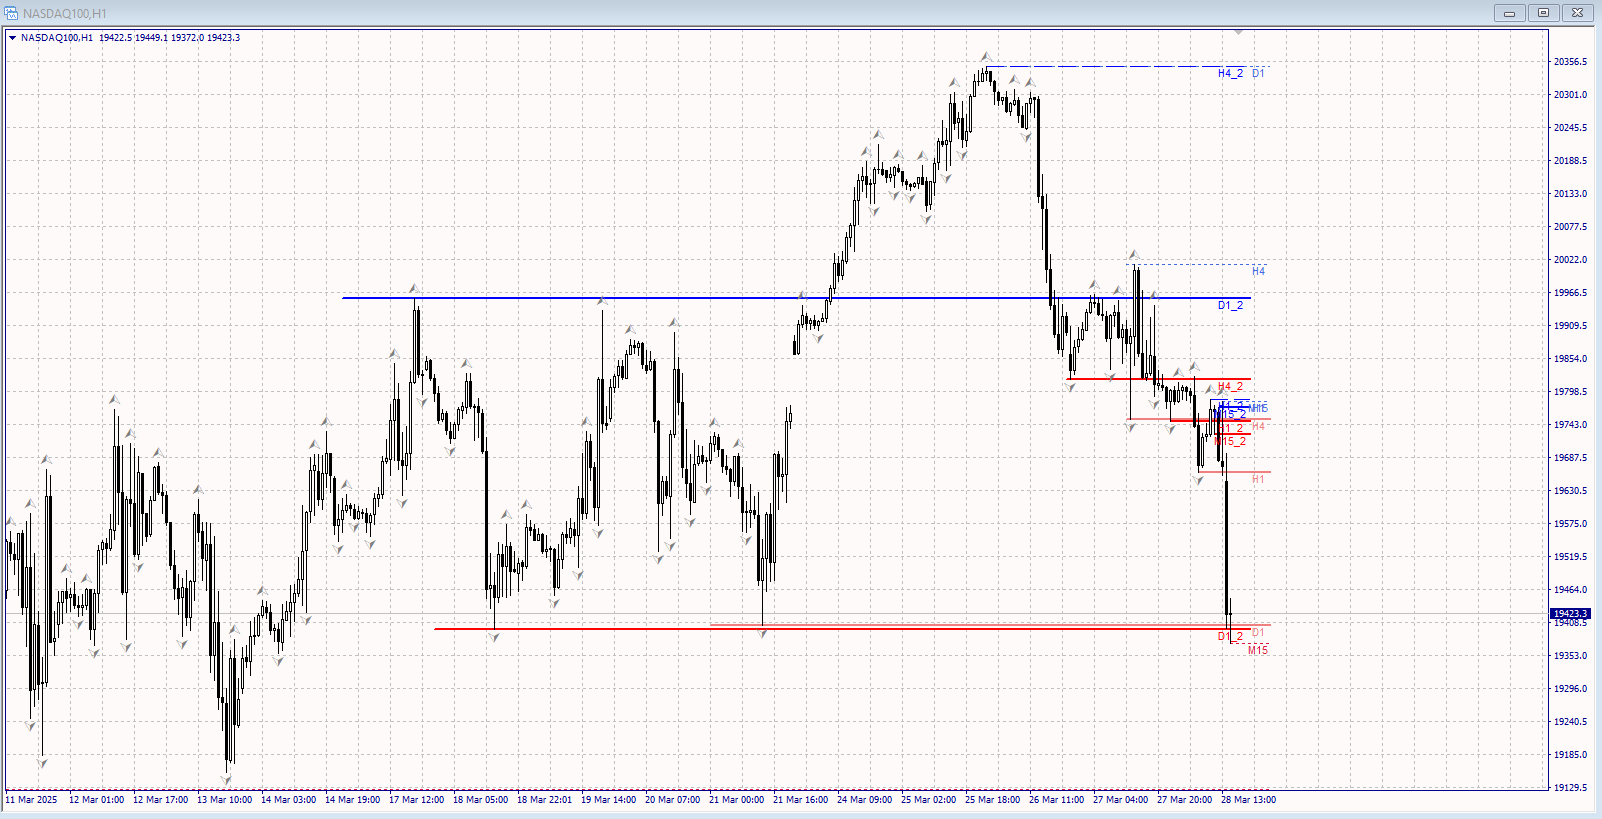
Теперь у вас всегда будут отображены важные ценовые уровни для принятия решений.Узнайте больше об индикаторе Geo Fractals версия 2.
Скоро и для МТ5!
https://www.mql5.com/ru/market/product/23792
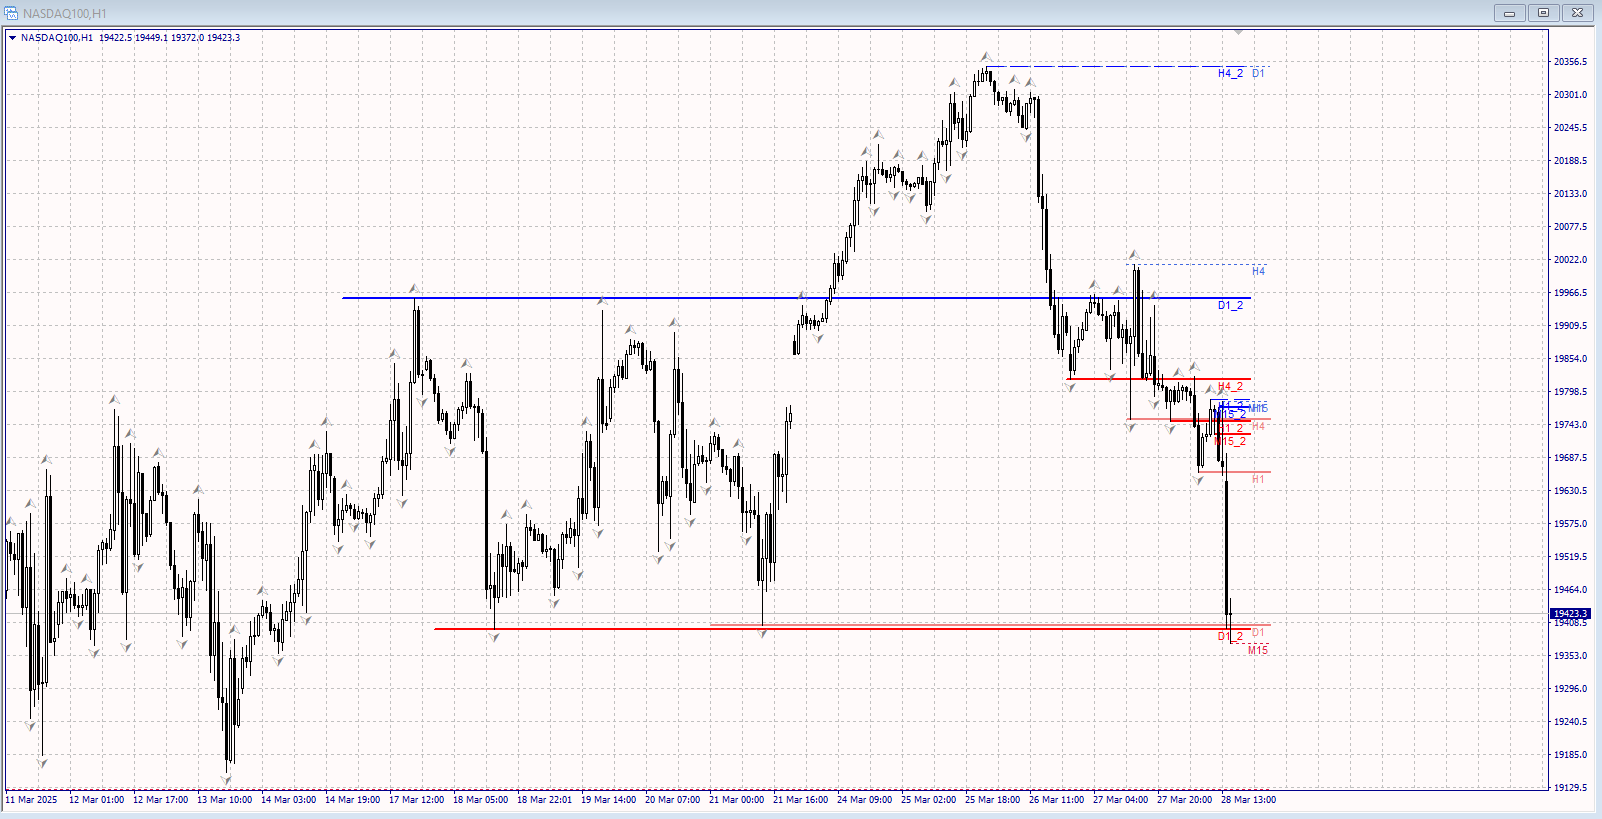
The price itself automatically draws your real support and resistance levels!!!
价格本身在自动模式下绘制您真实的支撑位和阻力位。!!!
Супер индикатор! Новая версия!
https://www.mql5.com/ru/market/product/23792?source=Site+Profile+Seller#
Популярный индикатор Geo_2Fractals обновился!
Версия 2.2 теперь отображает не только последние фракталы выбранных таймфреймов, но и предыдущие — это дает полную картину ключевых уровней поддержки и сопротивления!
Больше не нужно гадать, где провести важный уровень — индикатор сделает это за вас! Фракталы раскрывают истинную структуру рынка, и теперь вы видите их все сразу.
Название: Geo_2Fractals — Интеллектуальный индикатор фракталов для MetaTrader 4.
(Версия для MT5 скоро выйдет!)
Автоматически определяет ключевые уровни на всех таймфреймах!
Описание:
Geo_2Fractals — профессиональный инструмент для трейдеров, которые ищут точные уровни поддержки и сопротивления. Индикатор автоматически сканирует и отображает фракталы на выбранных таймфреймах, избавляя от рутины и позволяя сосредоточиться на торговле. Благодаря продуманной логике визуализации, даже на перегруженных графиках все уровни остаются четкими.
Основные возможности:
✅ Мультитаймфрейм-анализ:
Показывает фракталы с 7 таймфреймов (от M1 до W1) на одном графике
Гибкие настройки видимости (включите только нужные ТФ)
Настраиваемое смещение меток (по умолчанию: 20 пунктов)
✅ Продвинутая визуализация:
Два типа фракталов: первые и вторые (количество можно регулировать)
Разные стили для непробитых и пробитых уровней
Кастомизация цветов, толщины линий и стилей (точки, пунктир, сплошные)
✅ Оповещения о пробоях:
Яркое выделение пробитых уровней
Поддержка всех валютных пар и инструментов
✅ Адаптивность:
Работает с 4- и 5-значными котировками
Оптимизированный код — минимальная нагрузка на систему
Преимущества для трейдеров:
⏱ Экономия времени — больше не нужно искать фракталы вручную
🎯 Точность — алгоритм не пропускает важные уровни
📊 Четкость — метки автоматически избегают наложений
⚙️ Гибкость — настройте индикатор под свою стратегию
📈 Мультифрейм-анализ — ключевые уровни старших ТФ прямо на вашем графике
Как это работает:
Сканирует выбранные таймфреймы в фоновом режиме.
Определяет фракталы по классическим правилам (хай/лоу + 2 свечи с каждой стороны).
Отображает уровни с вашими настройками:
Цвета для верхних/нижних фракталов
Стили линий (сплошные для пробитых, пунктир для активных уровней)
Регулируемое смещение меток
Для кого:
Трейдеры, использующие фракталы в стратегиях
Скальперы, работающие на M1-M15
Свинг-трейдеры, анализирующие H4-W1
Любители Price Action, сочетающие фракталы с другими методами
Требования:
MetaTrader 4 (версия для MT5 в разработке)
Совместим с советниками и другими индикаторами
Низкое потребление ресурсов
Измените свой подход к торговле с Geo_2Fractals!
🚀 Превратите фракталы в мощный инструмент вашей системы!
Приобретите Geo_2Fractals сегодня и откройте новый взгляд на структуру рынка!
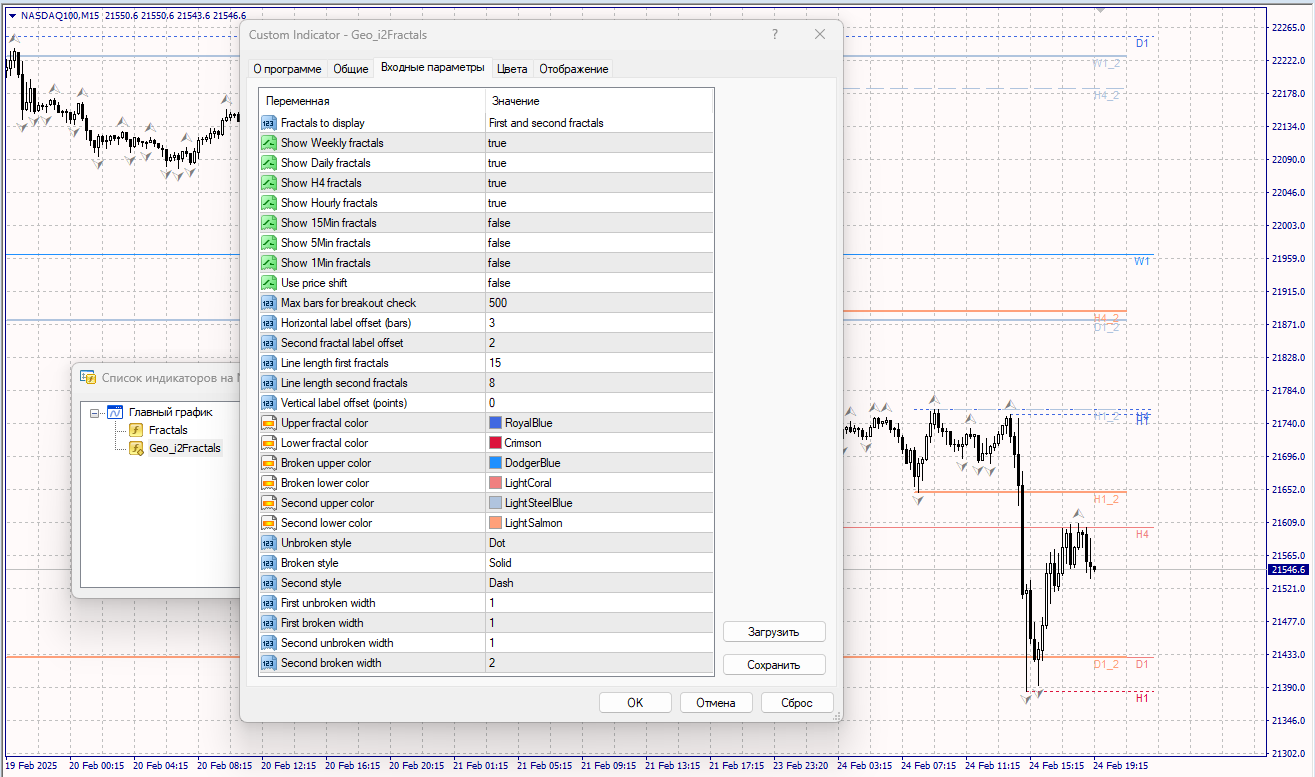
热门指标 Geo_2Fractals 最新版本现已上线!
2.2 版本 不仅显示所选时间框架的最新分形,还支持显示 历史分形——助您全面捕捉关键支撑与阻力位!
无需再猜测如何绘制关键价位——指标自动为您标记!分形揭示 真实市场结构,现在您可一览无余。
名称:Geo_2Fractals — MetaTrader 4 智能分形指标
(MT5 版本即将推出!)
全时段自动识别关键价位!
产品描述:
Geo_2Fractals 是一款为交易者量身打造的专业工具,精准定位支撑与阻力位。它自动扫描并展示您所选时间框架的分形,省去手动操作,让您专注于交易决策。凭借智能可视化逻辑,即使图表信息密集,所有价位依然清晰可辨。
核心功能:
✅ 多时间框架分析:
在单一图表上展示 7 个时间框架(M1 至 W1)的分形
灵活可见性设置(仅启用所需时间框架)
可自定义标签偏移量(默认:20 点)
✅ 高级可视化:
两种分形类型:第一分形与第二分形(数量可调)
未突破与已突破价位的差异化样式
自定义颜色、线宽与样式(点线、虚线、实线)
✅ 突破提醒:
突出显示已突破的价位
支持全部货币对与交易品种
✅ 高适应性:
完美兼容 4/5 位数报价
代码优化——极低资源占用
交易者收益:
⏱ 节省时间——告别手动跨周期搜索分形
🎯 精准定位——算法确保无关键价位遗漏
📊 清晰展示——标签智能避让,图表再忙也不混乱
⚙️ 高度灵活——自定义设置适配任何策略
📈 多周期洞察——直接在图表上捕捉高时间框架关键位
运作原理:
后台扫描所选时间框架
按经典规则识别分形(高点/低点 + 两侧各两根K线)
按您的偏好展示价位:
自定义上下分形颜色
线型区分(实线标记已突破位,虚线标记有效位)
可调水平标签偏移
适合人群:
在策略中使用分形的交易者
专注 M1-M15 周期的短线交易者
分析 H4-W1 图表的中长线交易者
将分形与其他分析方法结合的价格行为爱好者
系统要求:
MetaTrader 4(MT5 版本即将推出)
兼容智能交易系统(EA)与其他指标
轻量化运行,资源占用极低
用 Geo_2Fractals 重塑您的交易!
🚀 让分形成为您交易系统的核心武器!
立即获取 Geo_2Fractals,开启市场结构分析新视角!
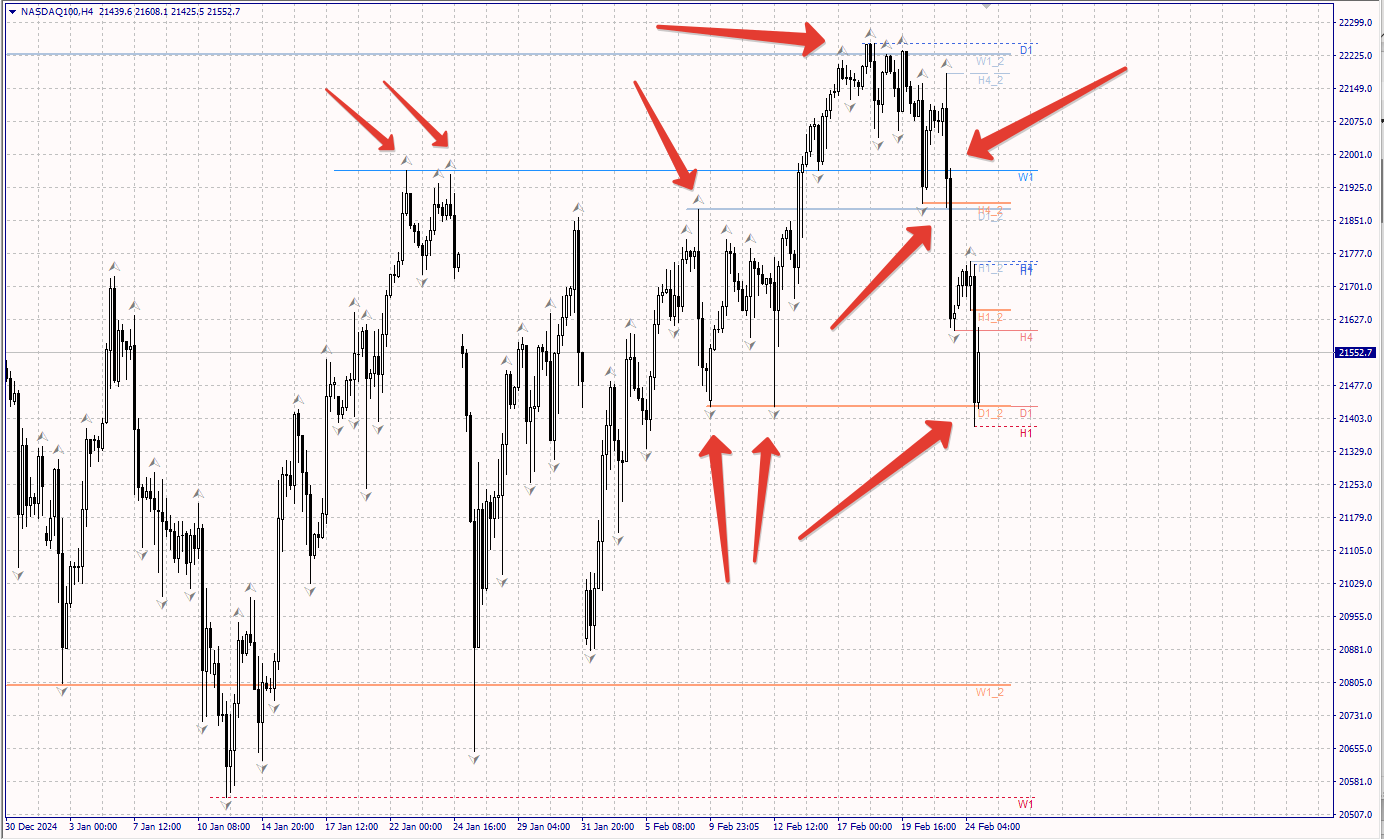
The latest update of the popular Geo_2Fractals indicator is here!
Version 2.2 now displays not only the latest fractals from selected timeframes but also previous fractals—giving you a complete view of critical support and resistance levels!
No more guessing how to draw key levels—the indicator does it for you! Fractals reveal the true market structure, and now you can see them all at once.
Name: Geo_2Fractals — Intelligent Fractals Indicator for MetaTrader 4.
(MT5 version coming soon!)
Automatically identifies key levels across all timeframes!
Description:
The Geo_2Fractals indicator is a professional tool for traders seeking precise support and resistance levels. It automatically detects and displays fractals across your chosen timeframes, eliminating manual work and letting you focus on trading decisions. With its smart visualization logic, levels remain clear and readable even on crowded charts.
Key Features:
✅ Multi-Timeframe Analysis:
Display fractals from 7 timeframes (M1 to W1) on a single chart
Flexible visibility settings (enable only the timeframes you need)
Customizable label offset (default: 20 pips)
✅ Advanced Visualization:
Two fractal types: First and Second (adjustable count)
Distinct styles for unbroken and broken levels
Customize colors, line thickness, and styles (dots, dashes, solid)
✅ Breakout Alerts:
Visual highlighting of broken levels
Supports all currency pairs and instruments
✅ Adaptability:
Works flawlessly with 4- and 5-digit pricing
Optimized code—minimal resource usage
Trader Benefits:
⏱ Save time—no more manual fractal hunting across timeframes
🎯 Precision—algorithm ensures no critical levels are missed
📊 Clarity—labels avoid overlap, even on busy charts
⚙️ Flexibility—customize settings to fit any strategy
📈 Multi-frame insights—spot key levels from higher timeframes directly on your chart
How It Works:
Scans selected timeframes in the background.
Detects fractals using classic rules (high/low + 2 candles on each side).
Displays levels with your preferred settings:
Custom colors for upper/lower fractals
Line styles (solid for broken levels, dashed for active levels)
Adjustable horizontal label offsets
Who It’s For:
Traders using fractals in their strategies
Scalpers analyzing M1-M15 timeframes
Swing traders focusing on H4-W1 charts
Price Action enthusiasts combining fractals with other methods
Requirements:
MetaTrader 4 (MT5 version upcoming)
Compatible with Expert Advisors and other indicators
Lightweight and resource-friendly
Transform your trading with Geo_2Fractals!
🚀 Turn fractals into a powerful element of your trading system!
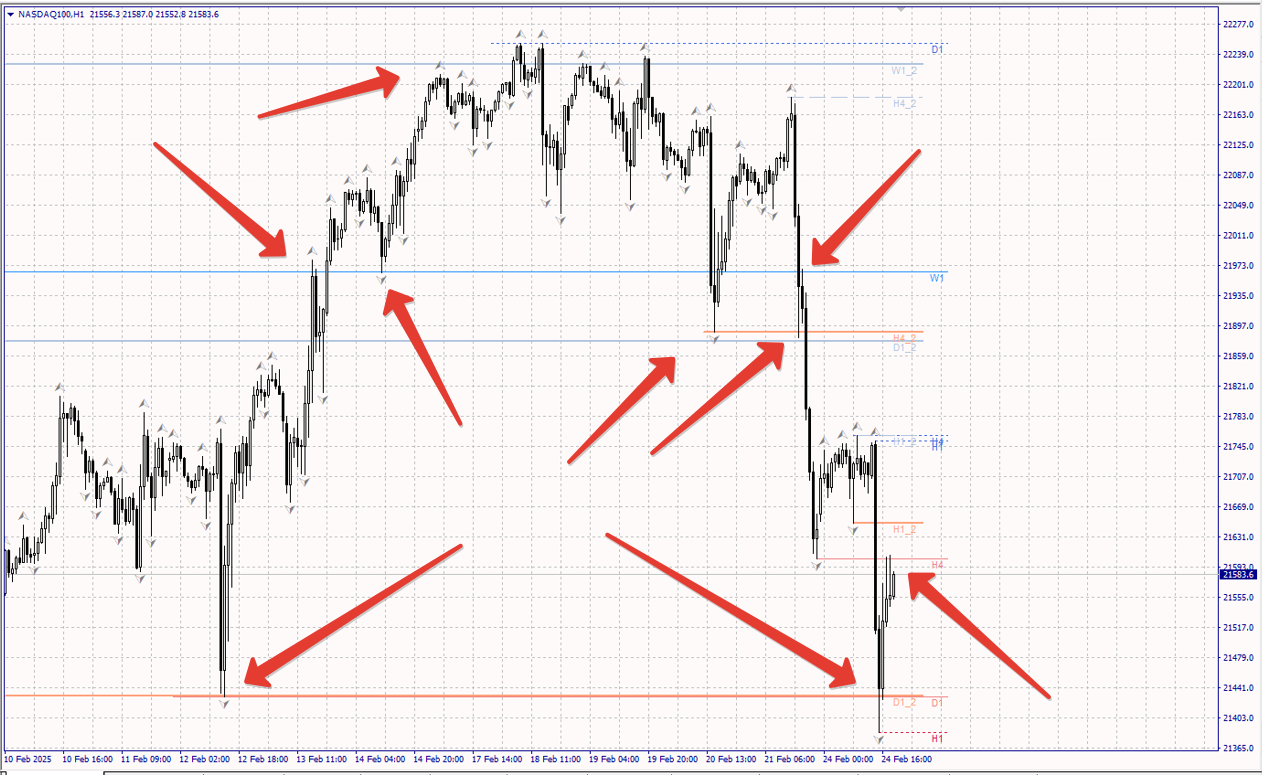
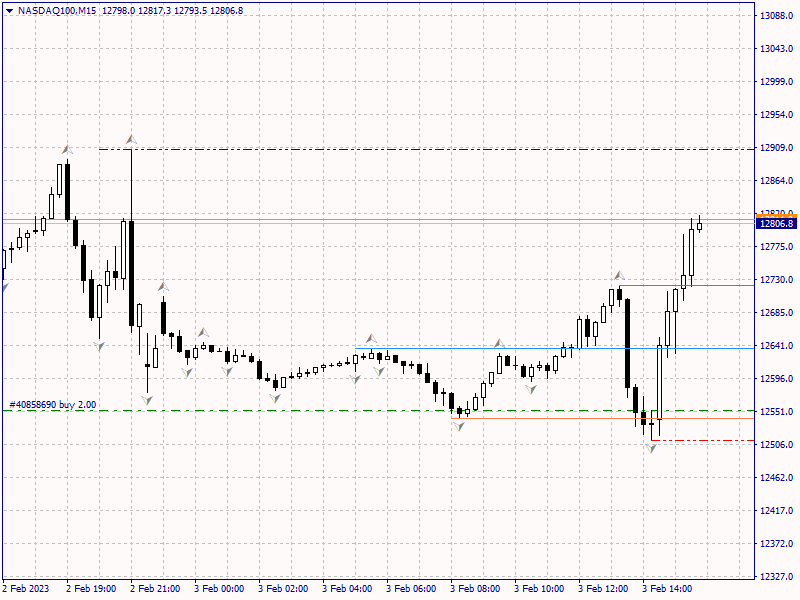
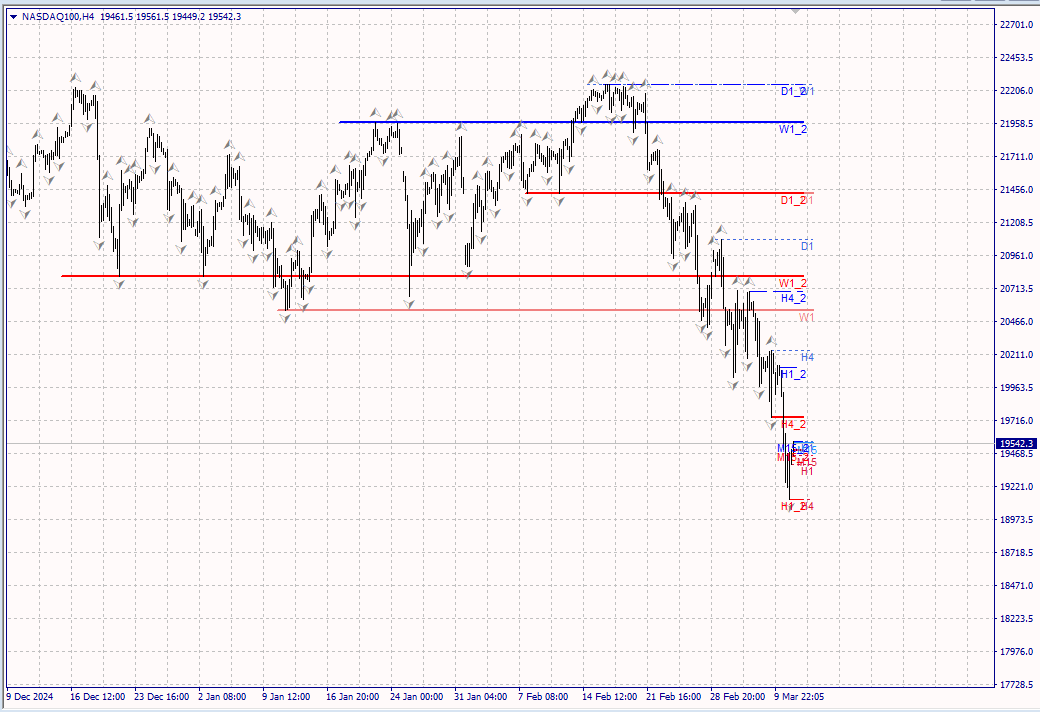
Look at how clearly the price works out the levels that the Geo_Fractal indicator automatically draws
查看价格如何清楚地计算出Geo_Fractal指标自动绘制的水平
Vea con qué claridad el precio trabaja los niveles que el indicador Geo_Fractal dibuja automáticamente
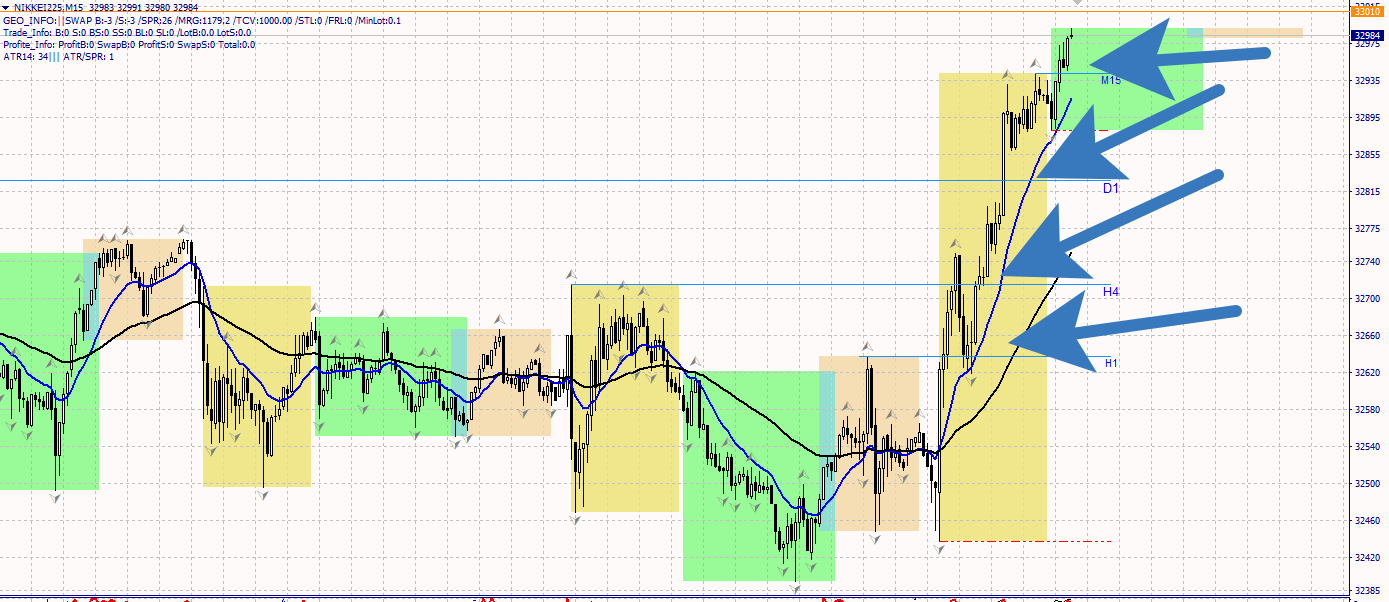
GeoInfo5 是信息量最大的指标之一,它以简洁的形式显示交易工具的基本信息。 Meta Trader4终端的版本在交易者中广受欢迎。 该指标是免费的,将永远是免费的。 推出版本现在也可用于MetaTrader5。 在图表左上角的行中以简短的形式显示有关工具主要参数的信息: 价差,交换买入订单,交换卖出订单,当前价差,抵押品(保证金),蜱虫大小,停止水平,订单冻结水平。 信息显示基于一个手和点。 信息以如下形式输出: Spread ... = 23 pips /SWAP B:4.200 /S:-8.470 /MRG:256.0/TCV:0.10/STL:0/FRL /MinLot:0.1 已经介绍了关于周期的平均范围和周期/点差的比率范围的信息的显示,这允许您选择在这些市场条件下最有效操作的最佳时间框架。 数据以格式呈现: ATR14:906.786///ATR/SPR:3.956 如果 ATR/SPR 比率较小,则选择更高的时间框架以实现更高效的操作可能是有意义的。 对于紧急工具(期货),到期日以以下格式显示: Exp Date:2022.02.18 参数
GeoInfo5 是信息量最大的指标之一,它以简洁的形式显示交易工具的基本信息。 Meta Trader4终端的版本在交易者中广受欢迎。 该指标是免费的,将永远是免费的。 推出版本现在也可用于MetaTrader5。 在图表左上角的行中以简短的形式显示有关工具主要参数的信息: 价差,交换买入订单,交换卖出订单,当前价差,抵押品(保证金),蜱虫大小,停止水平,订单冻结水平。 信息显示基于一个手和点。 信息以如下形式输出: Spread ... = 23 pips /SWAP B:4.200 /S:-8.470 /MRG:256.0/TCV:0.10/STL:0/FRL /MinLot:0.1 已经介绍了关于周期的平均范围和周期/点差的比率范围的信息的显示,这允许您选择在这些市场条件下最有效操作的最佳时间框架。 数据以格式呈现: ATR14:906.786///ATR/SPR:3.956 如果 ATR/SPR 比率较小,则选择更高的时间框架以实现更高效的操作可能是有意义的。 对于紧急工具(期货),到期日以以下格式显示: Exp Date:2022.02.18 参数
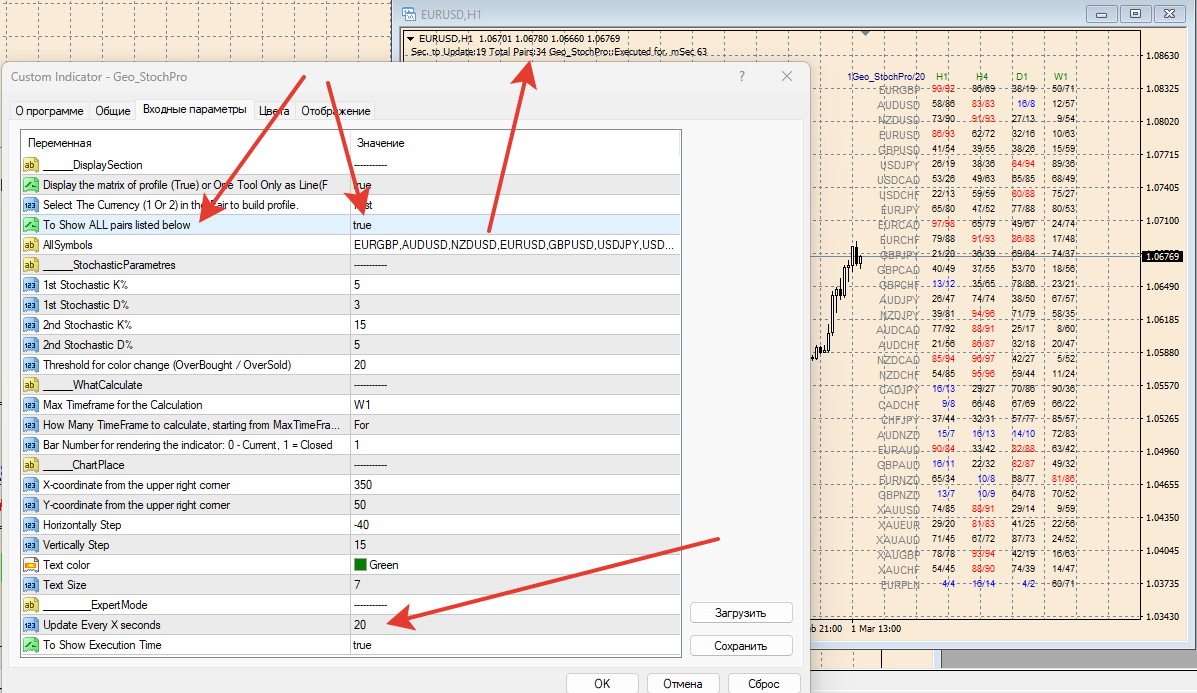
Для снижения нагрузки на терминал и процессор введен таймер запуска пересчета индикатора.
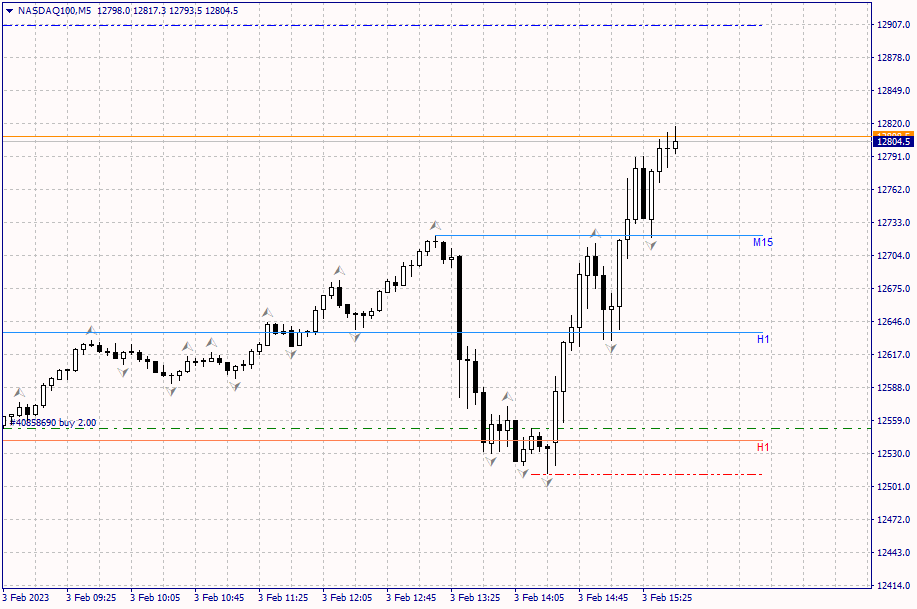
Пример точного входа на скрине.
В новой версии исправлены ошибки.
Благодаря идее @fxproaddicted в индикатор добавлена возможность "услышать" такое событие, как закрытие ордера.
Я использую начальный фрагмент "Money" от Pink Floyd.
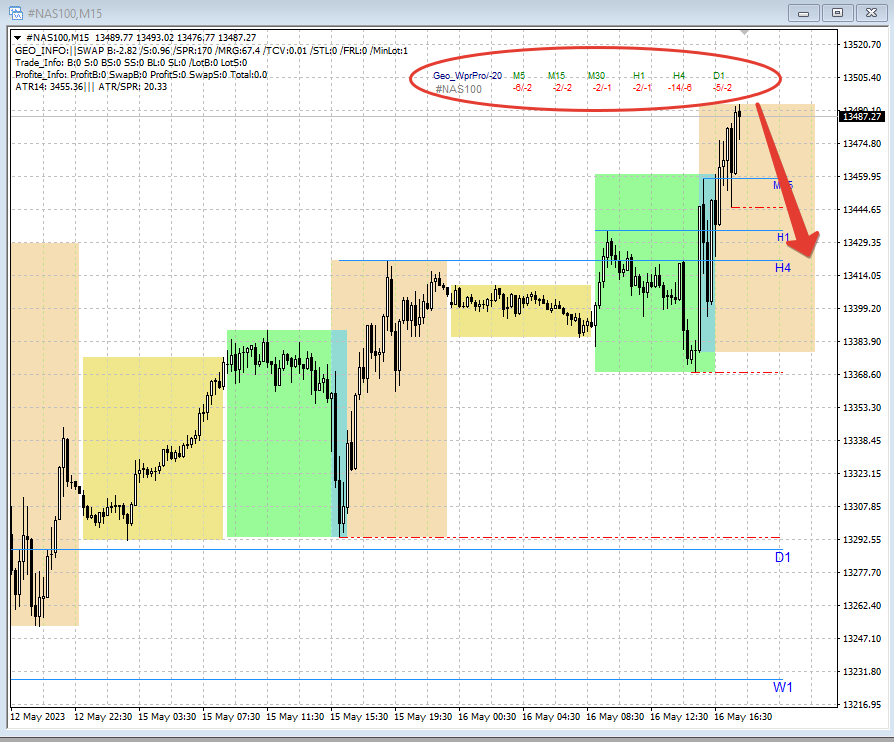
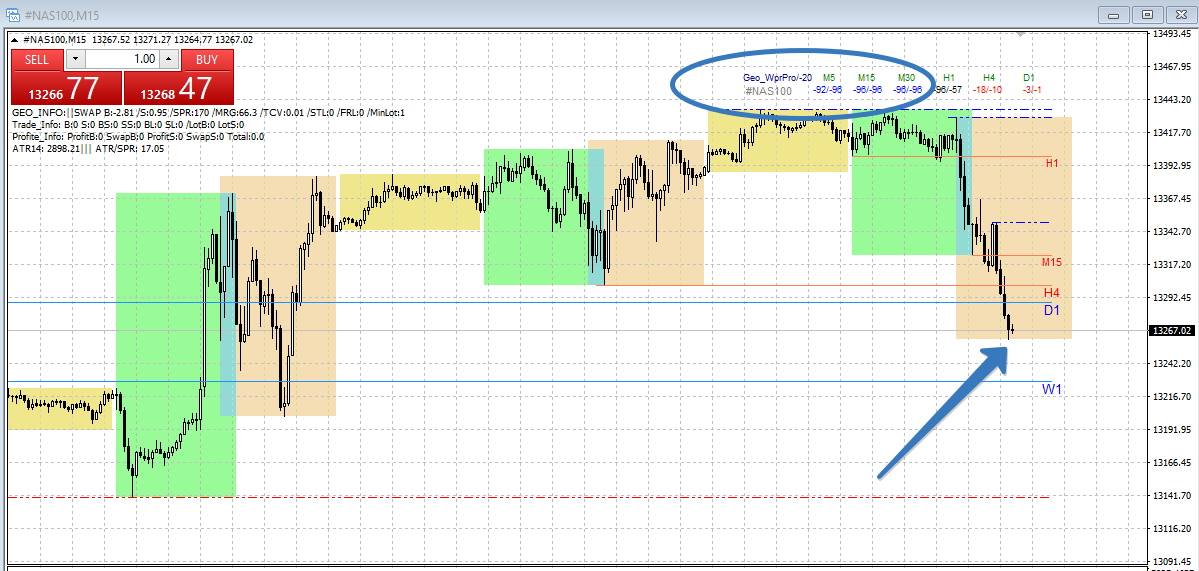
Geo_Info - one of the most informative indicators, in a compact form it displays basic information about a trading instrument, open positions, displays NET levels.
displays information about the main parameters of the instrument in a line in the upper left corner of the chart:
Swap for a Buy order, swap for a Sell order, current spread, margin (margin), tick size, stop level, order freeze level. Information is displayed per lot and in points.
Information is output as follows: SWAP B:4.200 /S:-8.470 /SPR:342 /MRG:256.0/TCV:0.10/STL:0/FRL
You can enable/disable the display of this information in the indicator parameters.
It is possible to display in the second line in the upper left corner of the chart in a short form information about the main parameters of trading positions on this instrument: the number of Buy, Sell, BuyStop, SellStop, BuyLimt, SellLimit orders, as well as the total number of lots of open positions.
The information is output as follows: B:0 S:1 BS:0 SS:0 BL:0 SL:1/LotB:0 LotS:0.1
You can enable/disable the display of this information in the indicator parameters.
The new version displays information on the amount of current profit and accumulated swaps for the instrument in total for BUY and SELL positions in the following format:
Profite_Info: ProfitB:125 SwapB:-2 ProfitS:-20 SwapS:-1 Total:102
For forward instruments (futures), the expiration date is displayed in the following format:
Exp Date:2022.02.18
Display of information about the average range per period and the ratio range per period / spread has been introduced, which allows choosing the optimal timeframe for the most efficient operation in given market conditions. The data is presented in the format:
ATR14: 906.786||| ATR/SPR: 3.956
If the ATR/SPR ratio is low, it may make sense to choose a higher timeframe for more efficient work.
In addition, now you have the opportunity to display on the chart "Zero Lines" (line names - "ZeroBuy" and "ZeroSell") for each group of buy and sell orders, that is, the NET levels of Buy and Sell positions, where the total profit of all orders to buy (to sell) (including accumulated swaps) will be equal to 0. Each level is displayed by a line of its own color. Levels are calculated based on open orders.
Also, if there are pending orders, "Zero Lines" (line names - "ZeroBuyP" and "ZeroSellP") are additionally displayed, which display NET levels, taking into account if pending orders work.
These levels are displayed as rays.
Useful for traders who work with several positions, using top-ups, grids. The lines thus reflect the NET position for each group (buy and sell) of both open orders and pending orders.
FREE FOREVER!!!
Geo_Info - один из наиболее информативных индикаторов, в компактном виде отображает основную информацию о торговом инструменте, открытых позициях, отображает НЕТТО-уровни.
выводит в строку в левом верхнем углу графика в кратком виде информацию об основных параметрах инструмента:
Своп для ордера Buy, своп для ордера Sell, текущий спред, залог (маржу), размер тика, уровень стопов, уровень заморозки ордеров. Информация выводится из расчета на один лот и в пунктах.
Информация выводится в следующем виде: SWAP B:4.200 /S:-8.470 /SPR:342 /MRG:256.0/TCV:0.10/STL:0/FRL
Включить/отключить отображение этой информации можно в параметрах индикатора.
Есть возможность вывода во вторую строку в левом верхнем углу графика в кратком виде информацию об основных параметрах торговых позиций на данном инструменте: количество ордеров Buy, Sell, BuyStop, SellStop, BuyLimt, SellLimit, а также суммарное количество лотов открытых позиций.
Информация выводится в следующем виде: B:0 S:1 BS:0 SS:0 BL:0 SL:1/LotB:0 LotS:0.1
Включить/отключить отображение этой информации можно в параметрах индикатора.
В новой версии выводится информация о размере текущей прибыли и накопленных свопов по инструменту суммарно по позициям BUY и SELL в формате:
Profite_Info: ProfitB:125 SwapB:-2 ProfitS:-20 SwapS:-1 Total:102
Для срочных инструментов (фьючерсов) выводится дата экспирации в формате:
Exp Date:2022.02.18
Введено отображения информации о среднем диапазоне за пероид и соотношени диапазон за период / спред, что позволяет в данных рыночных условяих выбирать оптимальный таймфрейм для наиболее эффективной работы. Данны предствлены в формате:
ATR14: 906.786||| ATR/SPR: 3.956
Если соотношение ATR/SPR невилико, возможно, имеет смысл выбрать более старший таймфрейм для более эффективной работы.
Кроме этого, теперь вы имеете возможность вывести на график "Линии нуля" (имена линий - "ZeroBuy" и "ZeroSell") для каждой группы ордеров на покупку и на продажу, то есть уровни НЕТТО позиций Buy и Sell, где суммарная прибыль всех ордеров на покупку (на продажу) (с учетом накопленных свопов) будет равна 0. Каждый уровень отображается линией своего цвета. Уровни рассчитываются на основе открытых ордеров.
Также, при наличии отложенных ордеров, дополнительно выводятся "Линии нуля" (имена линий - "ZeroBuyP" и "ZeroSellP"), которые отображают НЕТТО-уровни с учетом, если отложенные ордера сработают.
Эти уровни отображаются лучами.
Полезен для трейдеров, которые работают несколькими позициями, использующих доливки, сетки. Линии таким образом отражают НЕТТО-позицию для каждой группы (на покупку и на продажу) как открытых ордеров, так и с учетом отложенных.
Включить/отключить отображение линий, а также выбрать цвет линий можно в параметрах индикатора.
Параметры
ShowSymbolInfo = True - True или False - отображать или нет информацию об инструменте
ShowTradeInfo = True - True или False - отображать или нет информацию о торговых позициях
ShowZeroLines = True - True или False - отображать или нет "Линии Нуля" уровней на покупку и на продажу
ZeroBuyColor = clrCornflowerBlue - цвет "Линии Нуля" для открытых BUY-ордеров.
ZeroSellColor = clrSalmon - цвет "Линии Нуля" для открытых SELL-ордеров.
ZeroBuyPColor = clrDodgerBlue - цвет "Линии Нуля" для BUY-ордеров с учетом отложенных.
ZeroSellPColor = clrPaleVioletRed - цвет "Линии Нуля" для SELL-ордеров с учетом отложенных.


