MACD stopper x2 free
- 指标
- 版本: 1.2

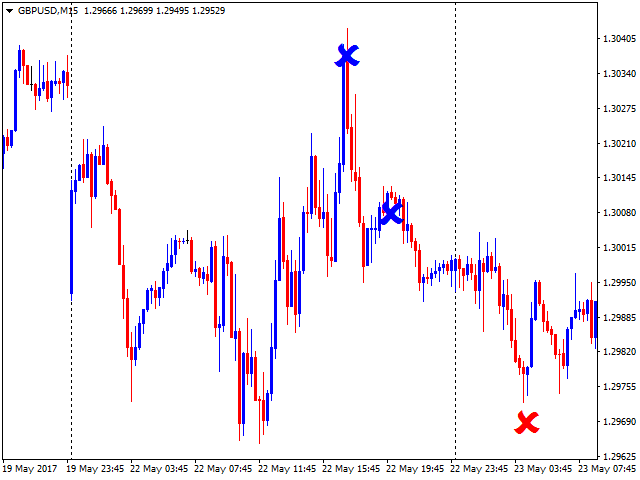
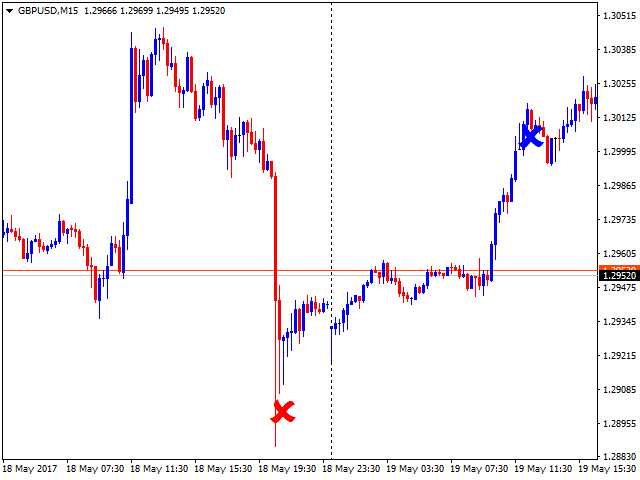
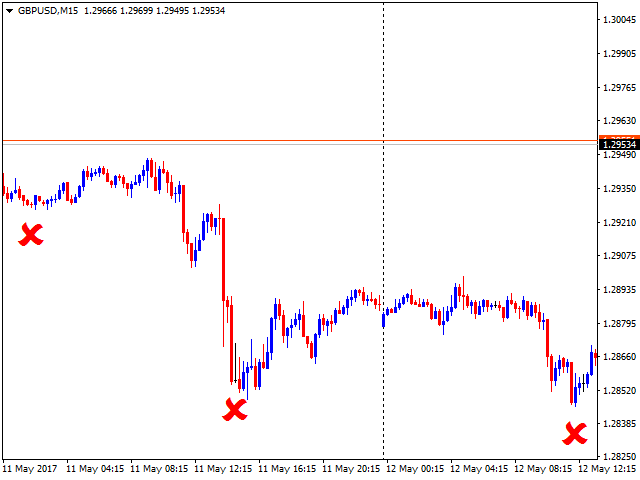
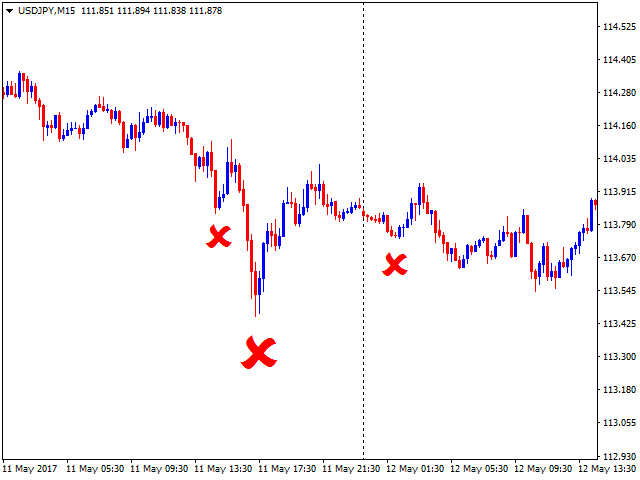
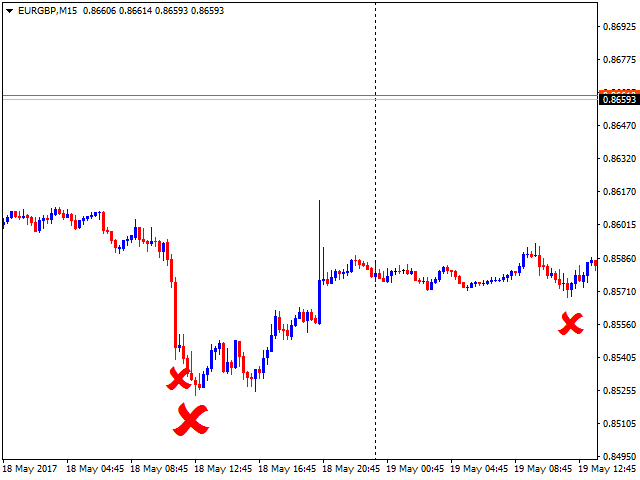
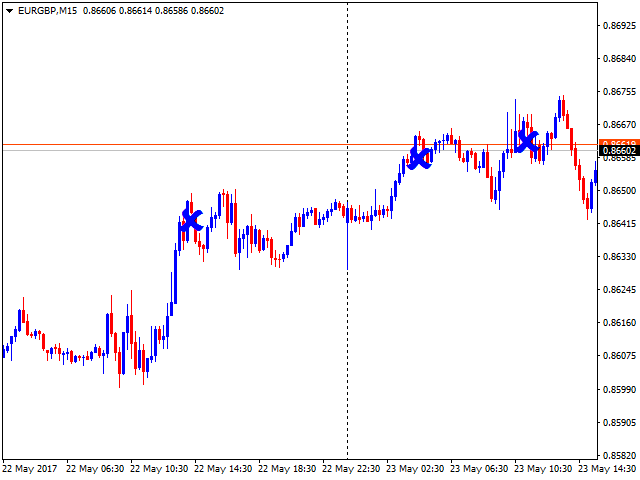
The MACD_stopper_x2 indicator shows where the trend has a tendency to stop or reverse. It uses the standard MACD indicator and a proprietary formula for processing data obtained from MACD.
There are 2 types of stop/reversal signals:
- Small cross - probability of a trend stop/reversal is 70-80%;
- Large cross - probability of a trend stop/reversal is 80-80%;
If there are open trades (for example, BUY) on the symbol the indicator is attached to, and the BUY trend ends, the indicator sends push notifications and emails to the user.
Indicator parameters
- Days_paint - the number of days, during which the stop signals are to be drawn.
- AlertAndSendPush - send push notifications and email to the user.
Attention! Free version (works only on USDCAD). The paid (unlimited) version of the indicator is available here - https://www.mql5.com/en/market/product/23278


用户没有留下任何评级信息