SignalX Range Compression Scanner

  • 指标
  • Ahmed Ismail Muhammad Ismail Al Talhat
    Ahmed Ismail Muhammad Ismail Al Talhat
    • Algorithmic Trading Systems Developer 在  SignalX
    • 埃及
    • 2382
    SignalX — Algorithmic Trading Systems | MQL4 · MQL5 · MetaTrader 4 & 5
    I build trading software I can defend line by line: Expert Advisors, indicators and utilities for MT4 and MT5 — each with hard risk controls, documented inputs, and no hidden grid or martingale.
    ◆ WHAT I BUILD
  • 版本: 1.0
  • 激活: 8

What this is

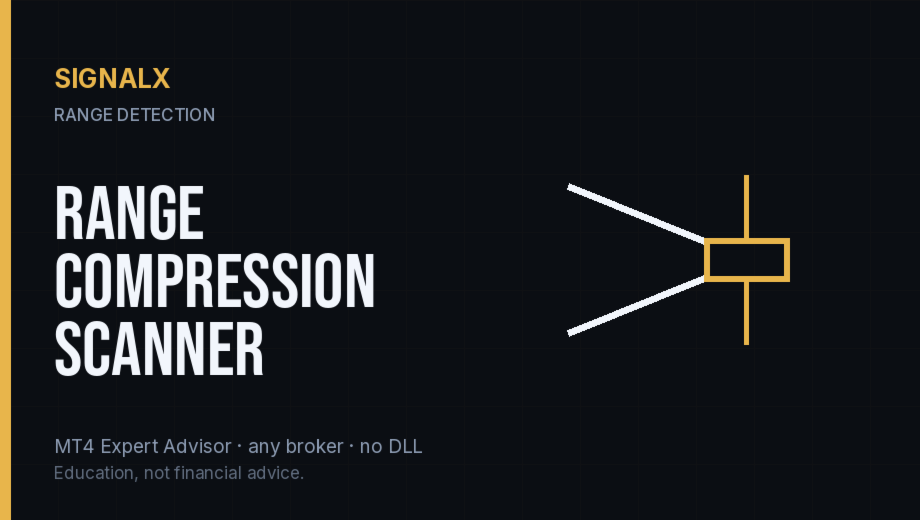
Ranges compress before they expand. This indicator finds the bars where the Bollinger band width is in the lowest percentage of a lookback window and where the compression has lasted for a minimum number of bars, then draws each zone as a box with the upper and lower breakout levels extended to the right and the box height in points.

What it does

Marks historical squeeze zones where Bollinger width sits in the lowest x% of the lookback, boxes each run, extends the two breakout levels and reports the box height in points.

  • Joint width-percentile + minimum-duration test, with the box drawn as the actual tradable range instead of a coloured histogram.
  • Runs on a single chart; it does not need to be the chart you trade from.
  • No DLL calls. No external services. No network requests.
  • No account, terminal, symbol or time limitation is embedded.

Inputs

Input Type Default
InpBBPeriod int 20
InpBBDeviation double 2.0
InpLookback int 150
InpWidthPctThreshold double 20.0
InpMinCompressedBars int 5
InpHistoryBars int 400
InpMaxZones int 20
InpDrawBreakoutLines bool true
InpAlertOnBreakout bool true
InpShowLabel bool true

How to use it

  1. Attach the EA to a chart of the symbol you trade.
  2. Set the inputs to match your own risk approach. Defaults are deliberately conservative.
  3. Allow live trading in the Expert Advisors settings for this EA.
  4. Test on a demo account first. That is not a formality; the defaults are not tuned to your broker.

Notes

  • Written for MetaTrader 4, any broker, any account currency. Sizing maths uses the symbol's own tick value.
  • Works alongside other EAs, including with a magic number you choose, so it will not fight them for orders it does not own.
  • It performs management and measurement only; it does not generate trading signals.

Honest limits

  • This is a tool, not a strategy. It does not predict anything and it cannot make a losing method profitable.
  • No performance figures are published for it because tools of this kind do not have a meaningful backtest curve of their own.
  • If your broker quotes oddly (very wide spreads, non-standard tick values) verify the sizing on a demo account before using real funds.

Trading involves risk of loss. Nothing here is financial advice.
推荐产品
Implement
Vitalii Zakharuk
5 (1)
Implement analyzes market dynamics for pivot points. If you want to learn how to spot the correct reversals for consistently likely profitable trading, buy this indicator. Shows favorable moments of entering the market in stripes. Ready-made trading system. The principle of operation of the indicator is to automatically determine the current state of the market when placed on a chart, analyze historical data based on historical data and display instructions for further actions on the trader's
This indicator is meant for Harmonic Traders, it helps them in identifying the formed patterns by analyzing the market past data, looking for Harmonic Patterns. The Patterns that this indicator can detect are: AB=CD Butterfly Gartely Crab Bat The indicator shows the following: The completed pattern, with the critical zone highlighted in Gray box The suggested 3 take profit levels (in green) The Suggested Stop Loss level (in Red) The formed pattern ratios can be checked by hovering the mouse on t
适用于MT4平台的“专业指数趋势直方图”加密货币外汇指标,无重绘。 - 专业指数趋势直方图指标在趋势检测方面非常有效。 - 最佳使用方法是结合支撑/阻力位和回测技巧(参见图片): - 一旦指标检测到新趋势,找到当地的支撑/阻力位,并在该位置设置相应的挂单,等待该区域的回测。 - 如果新趋势是上涨,则设置买入限价挂单;如果新趋势是下跌,则设置卖出限价挂单。 - 指标有两种颜色:红色代表下跌趋势,蓝色代表上涨趋势(颜色可在设置中更改)。 - 支持手机和电脑端提醒。 - 指标带有信息显示功能,显示其所关联的外汇货币对的当前点差和隔夜利息。 - 信息显示还显示账户余额、净值和保证金。 - 信息显示可以放置在图表的任意角落。 点击此处查看高质量交易机器人和指标! 这是仅在MQL5网站上提供的原创产品。
High Low Predict
Thomas Bradley Butler
This indicator is designed to help you forecast the potential high and low prices for the current trading day, based on the high and low of the previous day. It does this by applying a customizable percentage increase or decrease to those levels. How It Works: The idea is simple: It looks at the previous day's high and low prices and then adjusts them by a percentage you choose. Here's what that means: Predicted High: This is calculated by taking the high price of the previous day and adding a p
Rira VWAP Bands
Vitor Palmeira Abbehusen
VWAP Bands gives you the regular Volume-Weighted Average Price and also the deviation bands. Use this indicator to see the possible amount of market movement, find support and resistance lines, find good spots for entry and exit,  and the most important feature is to find possible pivot points. This indicator has been mathematically improved by Rira team. The calculation begins at the start of each trading day
Interactive Structure Dashboard(SMC Engine) Interactive Structure Dashboard(交互式市场结构仪表盘) 是一款专业级、机构级的 市场结构(Market Structure) 与 Smart Money Concepts(SMC) 指标,旨在自动化您的自上而下(Top-Down)市场分析流程。通过实时跟踪市场流动性变化与订单流,该指标能够有效过滤市场噪音,帮助交易者精准识别高概率交易区域。 结合实时多品种监控面板(HUD Dashboard)和智能区域反应监测系统,您只需打开一个图表,即可同时监控整个交易列表,并覆盖 6 个不同时间周期 。 核心功能 智能摆动点识别引擎 采用严格的多K线分形算法自动识别真实市场结构高点和低点,彻底避免手动绘制造成的误差。 动态 BOS(结构突破)投影 自动识别并绘制 Break of Structure(BOS) 水平,并持续跟踪市场结构变化,确保关键结构位置始终保持准确。 Smart Money 区域识别 一旦市场结构发生突破,系统立即计算并标记尚未回测的: Order Block
My Point MT4
Claudia Ramona Angerer
4 (1)
Diagnosis of major and minor pivot Trend detection with many signals Can be used in all symbols Can be used in all time frames Settings: Back Show: The number of candles it displays If you need any adjustments, or have any questions or suggestions, message me How to trade: Blue: sell signal Red: buy signal Blue and red at the same time: no signal Exit signal: Opposite signal
本指标是实践实战交易完善的波浪自动分析的指标 !  案例... 注: 波浪分级用西方叫法不习惯,因受到缠论(缠中说禅)命名方式习惯的影响,我是将基础波浪命名为 笔 ,将二级波段命名为 段 ,同时具有趋势方向的段命名为 主趋段 (以后笔记中都是这种命名方式,先告知大家),但是算法上和缠论关系不大切勿混淆.反映的是本人分析盘面总结的 千变万化纷繁复杂的运行规律 . 对波段进行了标准化定义,不再是不同人不同的浪  ,    对人为干扰的画法进行了排除,在严格分析进场起到了关键的作用 . 使用这个指标,等于将交易界面提升美感,抛弃最原始的K线交易带你进入新的交易层次.如果不是为了交易,在宣传上也将使客户观感提升层次. 指标内容: 1. 基础波浪 (笔) : 首先我们找出了价格波动过程中的基础波动拐点,当然他的有序性低,为下一步的计算提供基础. 2. 二级波段( 段 ) :在基础波浪的基础上,通过算法分析得到层级更明显的二级波段,二级波段为波浪提供了分析基础 3. 波浪( 浪 ): 有着更清晰的趋势,更清晰直观的方向.分析一个波浪是否延续,需要看二级波段的形态,分析二级的构成,可以得出波浪
Bermaui Channel
Muhammad Elbermawi
5 (19)
这是一个价格通道,在图表上显示五个重要的价格水平。这些级别是: 1. 前 x 根柱线的最高价 (HH)。 2. 前 x 根柱线的最高低点 (HL)。 3. 中线。 4. 前 x 根柱线的最低最高价 (LH)。 5. 前 x 根柱线的最低价 (LL)。 如何Bermaui通道捕获 超买 区域 将 HH 和 HL 水平之间的距离视为超买区域。 当价格蜡烛或柱线穿过 HL 向上时,这表明价格正在进入其超买区域。 当价格蜡烛或柱线穿过 HL 向下时,这表明价格正在超出其超买区域。 当价格蜡烛穿过 HH 时,它会创造一个新的高点。这可能表明一个新的上升趋势的开始,该趋势将继续进行,直到价格再次反转下跌方向。 Bermaui Channels 如何捕捉 超卖 区域 将 LL 和 LH 之间的距离视为超卖区域。 当价格蜡烛或柱线穿过 LH 向下时,这表明价格正在进入超卖区域。 当价格蜡烛或柱线穿过 LH 向上时,这表明价格正在超出其超卖区域。 当价格蜡烛穿过 LL 时,它会创造一个新的低点。这可能表明新的下跌趋势的开始,该趋势将继续进行,直到价格反转其方向再次回到上行。 伯毛伊海峡特色 Berma
Emotions are a weakness. QHO mathematics is the future of your trading! You know what really truly frustrating?  Information garbage and noise. All those legacy, lagging indicators on the charts look like an attempt to steer a rocket ship with a steam engine. They are useless. They look at the past while the market is already flying forward on next-gen tech. We created QHO. This is not just another indicator. This is pure mathematics crushing market chaos right on your chart. Imagine completely
Release Price is a highly discounted SALE Price! Price will increase after first 50 sales Read detailed post with screenshots here: https://www.mql5.com/en/blogs/post/771350 Features (What the indicator does for you) Detects both bullish and bearish Cups: Finds the classic “cup‑and‑handle” and its upside‑down version. Mathematical cup shape: Uses quadratic regression to make sure the cup looks like a smooth “U” rather than a jagged “V”. Two entry line options: Horizontal resistance line or a
TMoney OrderblockDay
Moises Orlando Urbina Sojo
The indicator is triggered at the start of each trading day and detects both bullish and bearish ORDERBLOCK potentials. These levels are of high operational probability, being able to use a minimum ratio of 3 to 1 to maximize profits. It is recommended to use TimeFrame M5 to M30 for a proper display and consider pending orders at the OB levels of the chart and place the SL up to a maximum of 20 pips from the entry price. Submit the indicator to Backtesting to become familiar with its performan
Chart patterns scanner
Jan Flodin
4.67 (6)
这个多时间框架和多品种指标识别双顶/底,头     &     肩膀、三角旗/三角形和旗形图案。也可以仅在颈线/三角形/旗杆突破发生时设置警报(颈线突破 = 顶部/底部和头肩的确认信号)。 该指标也可用于单一图表模式。请在产品的     博客 。     结合您自己的规则和技术,该指标将允许您创建(或增强)您自己的强大系统。 特征 可以同时监控您的市场报价窗口中可见的所有交易品种。将该指标仅应用于一张图表,并立即监控整个市场。 可以监控从 M1 到 MN 的每个时间范围,并在模式被识别或颈线突破(顶部/底部和头肩)时向您发送实时警报。 支持所有 Metatrader 原生警报类型。 可以使用 RSI 作为趋势过滤器来正确识别潜在的逆转。 该指示器包括一个交互式面板。当单击一个项目时,将打开一个带有相关代码和时间范围的新图表。 该指标将信号写入一个文本文件,智能交易系统 (EA) 可以使用该文件进行自动交易。比如 这个产品 。您可以在     博客 。 输入参数 输入参数的描述和解释可以在 这里 找到。 重要的 请注意,由于具有多功能性,既不会在安装指标的图表上绘制买卖建议,也不会绘制线
SuperDuperScalper Pro MT4 SuperDuperScalper Pro MT4 is a professional MetaTrader 4 scalping indicator built for traders who want faster decisions, cleaner entries, and a visually powerful trading dashboard without chart confusion. In fast-moving markets, most traders lose time switching between indicators, checking trend direction manually, and second-guessing whether a signal is strong enough. SuperDuperScalper Pro MT4 solves that problem by combining trend detection, signal confirmation, F
-   Real price is 60$   - 50% Discount ( It is 30$ now ) Contact me for instruction, any questions! Introduction Triangle chart patterns are used in   technical analysis , which is a trading strategy that involves charts and patterns that help traders identify trends in the market to make predictions about future performance.   Triangle Pattern Scanner Indicator It is usually difficult for a trader to recognize classic patterns on a chart, as well as searching for dozens of charts and time f
Sensitive Signal
Aleksey Ivanov
5 (2)
使用作者开发的过滤方法的 “ 敏感信号 ” 指示器允许以高概率建立真实趋势运动的开始。该指标过滤随机价格走势,因此对货币兑换交易非常有效。作者开发的过滤在几次迭代中进行,揭示了常规价格运动的真实轨迹(更确切地说,这种运动的最可能的曲线)并绘制它。            “敏感信号”指示器的指示生动,非常简单,不需要注释。蓝色三角形位于价格运动的常规成分的上升趋势中,红色三角形呈下降趋势。因此,当红色三角形被蓝色替换时,买入的入口点。当蓝色三角形被红色替换时,您需要打开一个卖出位置。 指标的敏感度级别由选项决定   « Select sensitivity level» 。同时,您需要了解增加灵敏度级别不仅会减少信号的延迟,还会增加发出错误信号的可能性。 箭头也指示了价格走势发生变化的可能时刻。 指标还认为止盈是信号后价格达到的最可能值。 该指标计算并显示止损仓位线,该止损位线是根据价格概率的当前分布以及趋势逆转之前由止损价平仓的所选概率水平来计算的。             该指标还具有内置的资金管理功能,您可以在其中基于接受的风险水平,存款金额和止损仓位来计算手数。       
这个多时间框架和多符号供需区仪表板指示器在价格达到供需区时发送警报。也可以使用它来提醒常规的双顶/双底而不是区域。它可以用于从 M1 到 MN 的所有时间范围。可以使用 RSI、背离(MACD、RSI 或 Awesome)和蜡烛图过滤器(pin bar、吞没、镊子和晨星/夜星)来仅过滤掉最强的设置。结合您自己的规则和技术,该指标将允许您创建(或增强)您自己的强大系统。 在产品博客 的末尾,您将能够下载示例智能交易系统 (EA) 的源代码,该示例使用 iCustom() 函数从指标获取交易信号。尽管 EA 功能齐全,但主要目的是使用代码并将其粘贴到您自己开发的 EA 中或将您自己的额外进入/退出逻辑添加到此 EA 中。鉴于我的时间有限,我将无法提供任何编程支持。我很抱歉。 特征 这 足以放置一个指标图表上,你会出现在仪表板的任何新的信号接收警报。支持所有 Metatrader 原生警报类型。 可以选择要在仪表板中显示的时间范围。 在仪表板内持续执行发散等级排序。可以禁用此排序,以便更轻松地找到特定符号。然后,交易品种将按照它们在交易品种参数中输入的相同顺序显示,或者按照它们在市场报价窗
Auto Elliott Engine
Enrique Gauto Sand
Auto Elliott Engine The Auto Elliott Engine is a tool designed for MetaTrader 4 that automates the identification, decomposition, and projection of price structures based on the Elliott Wave Theory. Powered by a pattern-recognition engine, this indicator processes price action to identify market configurations, translating data into structured scenarios. Key Features Multi-Degree Recognition: Analyzes price action across multiple fractal levels. From higher degrees, such as Supercycle or Cycle,
American Hunters
Mehmet Ozhan Hastaoglu
This indicator guides you like a hunter. Tacheprofit and StopLoss levels. See the difference in the experiment. Works in all periods. Works at all rates. You can win with this system. The crossing of the mean and the re-test were done according to the rule. You can see the transactions by moving backwards on the strategy test screen. The whole system is automatically calculated.
MetaForecast M4
Vahidreza Heidar Gholami
5 (2)
MetaForecast能够根据价格数据中的谐波来预测和可视化任何市场的未来走势。虽然市场不总是可预测的,但如果价格中存在模式,MetaForecast可以尽可能准确地预测未来。与其他类似产品相比,MetaForecast通过分析市场趋势可以生成更精确的结果。 输入参数 Past size (过去的尺寸) 指定MetaForecast用于创建生成未来预测模型的柱数量。该模型以一条黄色线绘制在所选柱上。 Future size (未来的尺寸) 指定应预测的未来柱数量。预测的未来以粉色线表示,并在其上绘制了蓝色回归线。 Degree (程度) 此输入确定了MetaForecast将在市场上进行的分析级别。 Degree 描述  0 对于程度0,建议使用较大的值来设置“过去的尺寸”输入,以覆盖价格中的所有高峰、低谷和细节。  1 (建议的) 对于程度1,MetaForecast可以理解趋势,并通过较小的“过去的尺寸”生成更好的结果。  2 对于程度2,除了趋势,MetaForecast还可以识别反转点。对于大于1的程度,必须使用较高的“细节”和“噪音减少”输入值。  大于2 不建议使用大于
Crypto_Forex MT4 版“趋势入场柱状图”指标,无需重绘。 - 趋势入场柱状图指标可用于在 Entry_bar 出现后搜索趋势方向的入场信号。 - 该指标的独特之处在于它同时考虑价格和交易量进行计算。 - 趋势入场柱状图有两种颜色:红色表示看跌趋势,蓝色表示看涨趋势。 - 一旦趋势稳定(至少 10 个连续的相同颜色柱状图),请等待 Entry_bar。 - 入场信号是柱状图中第一列颜色与第一列相反,第二列颜色为初始趋势颜色(参见图片)。 - 使用短线目标 - 根据当前趋势,选择图表上最接近的高点/低点。 - 指标内置移动端和 PC 端警报。 指标使用方法: - 买入信号:稳定的看涨趋势(蓝色柱状图柱状图)+ 柱状图上的 1 个红色柱状图 + 1 个蓝色柱状图(在此开多头仓位)。 - 卖出信号:持续看跌趋势(红色柱状图)+ 1 条蓝色柱状图 + 1 条红色柱状图(在此开空头仓位)。 点击这里查看高质量的交易机器人和指标! 这是仅在 MQL5 网站上提供的原创产品。
Trend Forecasting
Mohamed Hassan
4.76 (17)
Summer Sale: 50% OFF!!! Promotion is valid until 08 August 2025!  This indicator is unstoppable when combined with our other indicator called Katana. After purchase, send us a message and you could get Katana for FREE as a BONUS After purchase, send us a private message for your instructions.  The Trend Forecasting indicator is a very unique & easy tool that is able to make prediction about future price movement based on the signals generated by MACD . It helps you have an estimation on the are
1.根据图表周期,确定趋势大小。在一段行情内最高价附近,为上涨趋势。在一段行情内最低价附近,为下跌趋势。 2. 趋势确立后,下一步就是确定短期趋势的超买和超卖。 超卖、多头;  超买,做空。   3.  根据超买和超卖以及利润点进行平仓。  实盘信号: https://www.mql5.com/zh/signals/1538661?source=Site+Signals+My EA 设置: 您需要把EA加载到要交易的货币对上(M15 时间范围) 现好的货币对: EURUSD,GBPUSD,GBPJPY,USDJPY,XAGUSD,GBPAUD 使用此EA,请是使用ECN账号。 可以使用我推荐的货币对,也可以使用其他货币对。 信号上100使用0.01手,建议使用更高的资金降低风险。 推荐杠杆 1:200 或更高 可以使用参数列表里内置的参数,也可以自定义参数。 参数设置: Applicable_Symbol - 表现最好的货币品种  cycle_time - 加载图表周期 Built_in_parameters - 选择内置的货币参数或选择自定义参数 Lot - 开单手数 AutoLo
This indicator is designed for M1 time-frame and shows: Sum of ticks when the price goes up (color Green -The major component of a candlestick = the body). Sum of points when the price goes up (color Green -The extension lines at the top of the candle). Sum of points when the price goes down (color Red -The major component of a candlestick = the body). Sum of points when the price goes down (color Red -The extension lines at the lower end of the candle). Keep in mind that Sum of Points will be g
KT Auto Fibo
KEENBASE SOFTWARE SOLUTIONS
Auto Fibonacci indicator that draws the Fibonacci retracement on the swing you are looking at, and redraws it the moment you zoom or scroll the chart. Zoom in on a pullback and the levels measure that pullback. Zoom out and they measure the whole trend. There are no anchor points to drag and no levels to redraw after every new high. Key features Measures the highest high and the lowest low on your screen, the current candle included. Follows zoom, scroll and window size at once, even when the ma
Moving Average Crossover Scanner and Dashboard Advanced Moving Average Scanner Moving Average Crossover Dashboard The indicator scans the market and sends signals and alerts for Moving Averages crossovers, death cross and golden cross. Crossovers are one of the main moving average ( MA ) strategies. MA Crossover ( cut ) strategy is to apply two moving averages to a chart: one longer and one shorter. When the shorter-term ( fast MA ) MA crosses above the longer-term ( slow MA ) MA, it's a buy sig
Signal Eskiya
Vitalii Zakharuk
Signal Eskiya, in addition to channel lines, reflects entry signals in the form of arrows. Trading strategies using the channel indicator belong to the classic methods of technical analysis, are easy to execute, and therefore available even to beginners. Price ranges work equally well on any trading assets and timeframes, they can be used both independently and with additional confirmation from oscillators and market volumes. American traders say: “Trend is your friend”, which means “Trend is
Fibonacci BB Breakout Indicator is a powerful MT4 tool that automatically detects Bollinger Bands breakouts and draws Fibonacci extension levels as trend lines on your chart. It simplifies trading by highlighting potential support, resistance, and target zones after strong moves, with customizable alerts and an info panel for quick status checks.  Key Features - Automatic Breakout Detection: Spots bullish (price closes above upper BB) or bearish (below lower BB) breakouts on the previous close
Divergence dashboard
Jan Flodin
4.64 (11)
这种多时间框架和多品种背离仪表板指示器会在在多个时间框架而不是单个背离中识别出一个或两个不同的背离时发送警报。它可以用于从 M5 到 MN 的所有时间范围。可以启用移动平均线或 RSI 趋势过滤器以仅过滤掉最强的设置。结合您自己的规则和技术,该指标将允许您创建(或增强)您自己的强大系统。 特征 可以检测以下振荡器/指标的背离:MACD(信号线或主线(直方图))、随机指标、OsMA、RSI、CCI、Awesome、OBV、ADX、ATR、MFI、动量和加速器。 可以选择要在仪表板中显示的时间范围。 在仪表板内持续执行发散等级排序。可以禁用此排序,以便更轻松地找到特定符号。然后,交易品种将按照它们在交易品种参数中输入的相同顺序显示,或者按照它们在市场观察窗口中的显示顺序显示。 通过在矩形内单击,将打开一个带有相关交易品种和时间范围的新图表。 指标可以将信号写入全局变量,智能交易系统可以使用这些变量进行自动交易。比如 这个产品 。 将指标放在一张图表上就足够了,您将收到来自您选择的任何交易品种的警报。支持所有 Metatrader 原生警报类型。 将考虑常规/经典(趋势逆转)和隐藏(趋势延续
Transition Trend
Tatiana Savkevych
The Transition Trend indicator shows the points of potential market reversal. The indicator's smart algorithm detects the trend, filters out market noise and generates entry signals and exit levels. Simple, visual and efficient trend detection. Uses just one parameter for settings. The indicator does not redraw and does not lag. You can set up message alerts as sound or email. Works on all currency pairs and all timeframes. Ready-made trading system.
该产品的买家也购买
Trend SniperX MT4
Sarvarbek Abduvoxobov
5 (5)
Trend Sniper X 是一款用于 MetaTrader 5 的多周期趋势追踪指标,旨在帮助交易者清晰、精准地识别趋势方向及潜在的反转点。 适用于 MT5: https://www.mql5.com/en/market/product/181101 价格信息: 当前价格为促销价,随着后续更新和新功能的推出,价格可能会发生变动。 Code2Profit 频道 通过多周期分析掌控市场! 如何使用 Trend Sniper X 最大化胜率:关键规则与交易时段技巧 技术规格 交易平台 MetaTrader 5 指标类型 多周期趋势指标 运行时间周期 任意图表周期,支持独立选择更高周期(M1–MN1) 主要交易品种 外汇、黄金 (XAUUSD) 及其他 CFD 差价合约 推荐账户 任何账户类型 可视化呈现 彩色趋势 K 线(买入/卖出/弱势/转变)+ 买入/卖出信号箭头 附加模块 市场交易时段框(悉尼、东京、伦敦、纽约) 核心功能 多周期趋势分析: 将更高周期的趋势方向直接投影到当前图表上,提供清晰的宏观视角。 弱势/不确定 K 线检测: 高亮显示趋势状况不明确的 K 线,帮助交易者远离震
Scalper Vault
Oleg Rodin
5 (40)
Scalper Vault 是一套功能强大且配置完善的交易系统,专为追求日内交易稳定性的交易者而设计。 作为一套完整且独立的交易系统,该高精度指标能够为外汇和二元期权交易者提供机构级的市场分析。 购买后请联系我,获取我的独家交易技巧以及一份超值赠品! Scalper Vault 能够消除凭感觉交易和复杂的各种手动分析,让您只需专注于执行交易,并运用简单易行的交易技巧进行操作。 精准的顺势交易信号:其核心算法通过分析市场结构,仅在市场主导趋势的方向上提供高胜率信号,从而大幅减少错误的入场操作。 精确的顶部与底部探测:系统能够识别市场动能耗尽的状态,从而锁定潜在的反转区域。 基于江恩(Gann)理论的买卖区域:系统会自动绘制江恩数学市场点位,让您能清晰洞察大型机构交易者在何处寻求买入或卖出。 100% 不会重绘(Non-Repainting):一旦K线收盘,生成的信号便会永久固定在图表上。绝无动态偏移,绝无虚假信号——您在历史数据中所见,即为该指标的真实表现。 广泛的市场适用性:适用于各类货币对、黄金、指数以及加密货币交易。
Currency Strength Wizard
Oleg Rodin
4.85 (61)
货币强度向导是一个非常强大的指标,为您提供成功交易的一体化解决方案。该指标使用多个时间范围内所有货币的数据来计算这个或那个外汇对的力量。此数据以易于使用的货币指数和货币电力线的形式表示,您可以使用它们来查看这种或那种货币的力量。 您所需要的只是将指标附加到您要交易的图表上,该指标将向您显示您交易的货币的真实强度。该指标还向您显示买卖量压力的极值,您可以在顺势交易时利用这些压力。该指标还显示了基于斐波那契的可能目标。该指标可用于各种交易时间范围。该指标支持各种货币对的交易。 该指标为您提供所有类型的警报,包括推送通知。 购买后请联系我。我将与您分享我的交易技巧,并免费为您提供丰厚的红利指标! 祝您交易愉快,获利丰厚!
PRO Renko System
Oleg Rodin
5 (31)
PRO Renko Arrow Based System for trading renko charts.  准确的信号交易任何外汇工具. 另外,我将免费提供系统的附加模块! PRO Renko系统是RENKO图表上高度准确的交易系统。该系统是通用的。 该交易系统可应用于各种交易工具。 该系统有效地中和了所谓的市场噪音,打开了获得准确反转信号的通道。 该指标易于使用,只有一个参数负责产生信号。 您可以很容易地使算法适应您感兴趣的交易工具和renko酒吧的大小。 我很乐意通过提供任何咨询支持来帮助所有客户有效地使用该指标。 祝您交易成功!购买后,立即写信给我! 我将与您分享我的建议和我的renko发电机。 另外,我将免费提供系统的附加模块!
SR Liquidity
Oleg Rodin
5 (2)
SR Liquidity 是一款旨在揭示市场流动性高度集中且价格反应最剧烈的隐蔽区域的交易指标。这些特殊的流动性区域充当着强有力的支撑位与阻力位,为您清晰呈现市场最可能发生反转的位置。 SR Liquidity 指标并非简单地绘制常规的支撑/阻力线,而是通过分析实际的价格行为,识别买卖压力积聚的区域。这些区域实际上是推动市场真实波动的流动性池。通过在图表上直观呈现这些区域,该指标能助您在价格反应发生前预判走势——这意味着它实际上能够预测价格方向可能发生的变化。它将原始的价格行为转化为清晰且具实操价值的市场蓝图,标示出那些可能成为市场转折点的关键价位。 该指标适用于任何交易品种和时间周期——包括外汇、指数、金属、加密货币等。支持任意时间周期。 购买后请联系我,以获取交易指南及免费赠送的优质附加指标!
Atomic Analyst
Issam Kassas
5 (14)
Atomic Analyst — MetaTrader 4 如有产品、设置或技术支持方面的问题,请直接在 MQL5 上给我发消息。 该指标将复杂的市场计算转换为简单的视觉信号、彩色K线、趋势读数、止损水平和多个止盈区域,使交易者能够快速理解并应用于真实市场环境。 主要交易用途: 剥头皮和日内交易: 专为快速决策、清晰箭头、提醒、K线颜色和结构化进出场区域而设计。 日内交易和波段交易: 帮助交易者利用趋势方向、强度、动能和多周期分析跟随更大的市场波动。 主要功能: • 价格行为、强度和动能分析 • 多周期趋势扫描器 • 总体趋势百分比计算 • 买入和卖出箭头 • 止损和多个止盈水平 • 最多 5 个基于斐波那契的止盈水平 • 移动止损逻辑 • 用于趋势和动能的彩色K线 • 实时提醒到终端、手机和电子邮件 • 现代化用户友好面板 • 实时交易监控 • 买入和卖出潜力显示 • 总交易数量显示 • 每日、每周和总利润显示 • 每日佣金计算 • Bid、Ask 和点差显示 • K线计时器、本地时间和服务器时间 • 终端连接状态 • 账户货币显示 • 可直接从面板控制时间周期 • 可手动使用,
M1 Sniper
Oleg Rodin
4.97 (30)
M1 SNIPER 是一款易于使用的交易指标系统。它是一个专为 M1 时间框架设计的箭头指标。该指标可以作为独立的系统在 M1 时间框架下进行剥头皮交易,也可以作为您现有交易系统的一部分使用。虽然该交易系统专为 M1 时间框架交易而设计,但它也可以用于其他时间框架。我最初设计此方法是为了交易 XAUUSD 和 BTCUSD。但我发现这种方法在其他市场交易中也同样有用。 指标信号既可以顺势交易,也可以逆势交易。我教授一种特殊的交易技巧,帮助您利用指标信号进行双向交易。该方法基于使用特殊的动态支撑位和阻力位区域。 购买后,您可以立即下载 M1 SNIPER 箭头指标。此外,我还为所有 M1 SNIPER 工具用户免费提供下方屏幕截图所示的 Apollo Dynamic SR 指标!这两个指标的组合可以帮助您更轻松、更准确地利用 M1 时间框架进行交易。 购买后请联系我,免费获取交易提示和奖励指标! 祝您交易成功!
SIO Oscillator:自优化半方差失衡振荡器 购买指标,即可免费获得基于该指标的智能交易系统(EA)。 大多数振荡器对所有价格波动一视同仁。SIO 将上行压力与下行压力分开,并衡量两者之间的失衡程度,清楚显示究竟是买方还是卖方在真正掌控市场。当失衡达到极值时,SIO 会给出明确的信号,并附带入场价、止损(Stop Loss)和止盈(Take Profit)水平。 SIO 的独特之处在于它不依赖固定参数。内置的自优化器会持续寻找适合当前品种和周期的参数,并在使用之前对其进行验证。 两种信号模式 均值回归(Mean Reversion):在失衡极值处交易,预期价格回归平衡。 趋势跟随(Trend Following):顺着持续、占主导地位的失衡方向交易。 自动模式:由优化器根据近期数据选择表现更好的模式。 具备真实验证的自优化器 滚动前推优化(Walk-forward):参数只用历史数据选出,然后应用于之后的K线。 真正的样本外保留期(Hold-out):结果会在优化器从未训练过的数据上得到确认。 平台图(Plateau map):所有测试参数的可视化热力图。SIO 优先选择结果稳
Quant Direction
Georgios Kalomoiropoulos
Quant Direction 是一款三维市场分析工具。它通过同时计算多个维度上的精确百分比偏差,提供完全客观的、基于算法的市场分析视角。该算法采用先进的人工智能建模工具开发,并经过全面测试,旨在以独特的精准度解读市场。它可以分析您平台上的任何货币对或金融工具。 无论您是短线 交易者、日内 交易者还是波段交易者,Quant Direction 都是您的理想之选。 交易者的真正优势 Quant Direction 的真正优势在于彻底消除情绪、屏幕疲劳和过度思考。它无需手动点击十几个图表来寻找方向并反复质疑自己的偏好,引擎即可在几毫秒内即时处理 8 个时间周期(从 5 个月到月线)。它能准确告诉你任何时刻谁在掌控市场,确保你始终朝着概率最高的方向进行交易。 市场分析的三个维度 该算法将市场分为三个不同的交易维度,为您提供完整的宏观和微观视角: 超短线交易分析: 捕捉即时、快速的动量变化和较低时间框架的执行点。 日内分析: 识别真实的、潜在的每日方向性偏差。 波动分析: 专注于宏观趋势,确保您不会与大盘机构的走势背道而驰。 独家评分引擎 Quant Direction 的底层采用了一套
Trend Lines PRO
Roman Podpora
5 (2)
TREND LINES PRO 帮助您了解市场真正的方向转变点。该指标显示真实的趋势反转点以及主要参与者重新入场的时机。 您可以看到 BOS线、 趋势变化和更高时间框架的关键水平——无需复杂的设置或不必要的干扰。信号不会重绘,并在K线收盘后仍然保留在图表上。 VERSION MT 5    -   与……搭配使用时,可发挥其最大潜力   RFI LEVELS PRO 指示器 该指标显示的内容: 实际变化 趋势(BOS 线) 一旦信号出现,它就始终有效!这与会重绘的指标有着重要的区别,后者可能会发出信号后又改变信号,从而导致资金损失。现在,您可以更精准、更准确地进入市场。此外,还有一个功能,会在箭头出现后为K线着色,直到达到目标价位(止盈)或出现反转信号为止。 重复条目   以及主要玩家的充值 为了提高寻找入场点时的视觉清晰度,我们创建了一个模块,该模块首先显示买入/卖出区域,并在该区域内寻找最佳入场点。此外,我们还加入了智能逻辑来管理止损位,该逻辑会随着时间的推移逐步降低止损位的大小,从而降低入场交易时的初始风险(移动止损位)。 信号强度水平(BOS) 该指标采用三个显著性等级来衡量
AW Prime Oscillator
AW Trading Software Limited
5 (1)
两个振荡器的组合。第一个显示入场点,第二个显示当前趋势。该指标可以通过两种模式的箭头显示振荡信号,所有快速振荡信号或仅在当前趋势方向的信号。它具有多时间范围面板和三种类型的信号通知。 好处: 适合当日交易和倒卖交易 趋势过滤 简单而灵敏的设置 多时间框架面板 适合融入顾问。 适用于任何交易品种和任何时间范围 三种类型的通知 MT5 version ->  HERE  / Problem solving ->  HERE 指标策略 该指标由两个不同的振荡器组成: 慢趋势线(粗) - 当指标的最高水平从上到下交叉时,它是下降趋势的指标,当较低的水平水平(指标的低水平)从下到上交叉时,它是下降趋势的指标上升趋势。此外,在较低区域找到一条慢线表明当前趋势是下降趋势,反之亦然,在上方区域找到一条慢线表明当前趋势是上升趋势。这就是该指标确定当前市场趋势的方式。 快速入场线(细):识别从下到上与下线相交处的入场点,这是买入信号,在从上到下穿越上线时,这是卖出信号。除了振荡线之外,调整指标线也很重要,因为这会影响信号的数量和准确性。 本产品使用不同的振荡器来显示慢线和快线,每个振荡器必须单独调整。 为
Hidden Cycles
Lev Vladimirovic Marushkin
5 (1)
The Only 100% Universal Tool! Stop trading against nature! This is your chance to secure the only indicator rooted in the absolute laws that govern the entire universe. Most tools guess—this one reveals the truth. Buy another toy or buy the truth. Your choice... Based on Universal Laws — NOT Some Guy’s Algorithm: Let the market adjust to the Hidden Cycles Geometry — not the other way around. Most indicators are based on a man-made formula. They often lag, fail over time, or need constant re-o
Smart Trend Trading System
Issam Kassas
4.8 (10)
Smart Trend Trading System 是适用于 MetaTrader 4 的图表指标,将趋势信息、入场和出场信号以及价格水平集中呈现在同一图表上。 它将 10 多种交易工具 整合到一个系统中,包括趋势检测、反转区域、Smart Cloud、移动止损逻辑、支撑与阻力、K线着色、提醒以及多周期分析。 该系统旨在帮助您应对不同的市场环境: 趋势市场: 识别主要趋势,发现回调,跟随动能,并通过止损指导和移动止损选项寻找更清晰的入场机会。 震荡市场: 识别区间震荡状态,寻找价格反应区域,并在价格触及重要水平时获得更清晰的信号。 剥头皮和日内交易: 使用快速信号、K线颜色、提醒和多周期确认,辅助短线交易决策。 主要功能: • 10 多个指标整合为一个交易系统 • 7 多种策略和信号组合 • 趋势跟随、反转、剥头皮、日内交易和波段交易模式 • 入场和出场箭头 • Smart Cloud • Smart Reversal Zones • 支撑和阻力水平 • Smart Trailing Stop • 多周期趋势分析 • 成交量、趋势和反转K线着色 • 手机、电子邮件和终端提醒 •
Neo Wave PRO
Nikolay Raykov
5 (1)
Price & Time Market Structure Indicator A professional market structure tool that analyzes waves through both price and time — not price alone. Main Description NeoWave PRO is a professional market structure indicator for MetaTrader 4 designed for traders who want to move beyond traditional one-dimensional wave tools such as ZigZag, swing indicators, and basic high/low systems. Most wave indicators analyze only one thing: Price. But a real market wave is not only a price movement. A true wave de
PZ Turning Points MT4
PZ TRADING SLU
1 (1)
该指标检查不同时期分形的价格结构,以确定市场中可能的反转点,从而为已经具有基本或技术估值模型的仓位交易者提供时机。与它的弟弟 Reversal Fractals不同 ,该指标不会因为所选时期而错过反转,并且会以之字形方式找到反转分形,而忽略那些没有足够动量来引发持续价格波动的反转。 [ 安装指南 | 更新指南 | 故障排除 | 常见问题 | 所有产品 ] 转折点可以开始长期趋势 指示器不重涂 它实现了各种警报 可自定义的颜色和尺寸 该指示符是无功或滞后信号,因为分形是奇数个条形的地层,是中间地带中最高或最低的条形,并且指示符在分形中的所有条形都闭合时绘制。但是,具有预先设定的方向偏差的交易者会发现该指标非常有用,可以提早进入切入点。 该指标既不是下探信号指标,也不是完整的交易系统。请不要这样评价或审查它。 输入参数 最小分形数:分形上的最小条形数。必须为奇数,例如3、5、7、9、11、13,... 最大分形:分形上的最大条形数量。必须为奇数,例如3、5、7、9、11、13 ... 最大历史柱数:指标加载时评估的过去柱数。 颜色:自定义箭头和线条的颜色和大小。 警报:启用或禁用各
CRT Multi-Timeframe Market Structure & Liquidity Sweep Indicator Non-Repainting | Multi-Asset | MT5 Version Available MT5 Version:   https://www.mql5.com/en/market/product/162075 Full User Guide — explains what each feature does and why:   https://www.mql5.com/en/blogs/post/767525 Quick Start User Guide  — explains how to configure and in what order:  https://www.mql5.com/en/blogs/post/767540 Indicator Overview CRT Ghost Candle HTF Fractal is a complete institutional-grade market structure too
Neuro Poseidon MT4
Daria Rezueva
4.74 (46)
Neuro Poseidon is a new indicator by Daria Rezueva. It combines precise trading signals with adaptive TP/SL levels - creating best possible trades as a result! Message me and get  Neuro Poseidon Assistant  as a gift to automize your trading process! What makes it stand out? 1. Proven profitability on all assets and timeframes 2. Only confirmed BUY and SELL signals present on the chart 3. Adaptive TP & SL levels generated by the software for each trade 4. Easy to understand - suitable for all
Non repaint MT4
Yan Zhen Du
5 (1)
This is a professional chart indicator designed for traders focused on stability and clear price action. It helps filter market noise and provides clear visual entry and exit zones for your trading decisions. Core Features: Strictly Non-Repainting: The system is built with strict non-repaint logic. What you see on the chart is the true historical performance. Confirmed Signals: Signals are triggered and confirmed only after the candle closes . Once a trading arrow appears on a closed candle, it
Forex Breath System
Oleg Rodin
5 (6)
Forex Breath System 它是一个基于趋势的交易系统,可用于任何市场。您可以将此系统用于货币、金属、商品、指数、加密货币甚至股票。它也可以在任何时间范围内使用。该系统是通用的。它显示趋势并提供趋势箭头信号。当信号出现在趋势方向时,该指标还可以为您提供特殊类型的警报,从而使趋势交易成为一项简单的任务。 该指标非常易于使用,因为它根本不需要处理任何难以理解的设置。 您只需将其附加到图表中即可开始交易。无论您喜欢哪种交易风格,系统都会帮助您了解市场的方向以及趋势方向上可能的入场点。 该系统将对所有交易者有所帮助,无论他们的交易经验水平如何。 该指示器提供所有类型的警报,包括推送通知。 购买后请联系我以获得交易说明和丰厚奖金! 祝您交易愉快、盈利!
Advanced Supply Demand
Bernhard Schweigert
4.91 (302)
现在优惠 30%! 任何新手或专业交易者的最佳解决方案! 该指标是一款独特、高质量、且价格合理的交易工具,因为我们已经整合了许多专有功能和新公式。 依据此更新,您将能够显示双重时间帧区域。 您不仅可以显示一个较高的时间帧,还可以同时显示图表时间帧,加上更高的时间帧:显示嵌套时区。 供需双方所有交易者都会喜欢它。 :) 重要信息披露 高级供需的最大潜力,请访问 https://www.mql5.com/zh/blogs/post/720245   想象您的交易如何得以改善,是因为您能够精准定位入场或目标位吗? 构建于新的底层算法,它可以更轻松地识别出买卖双方之间的潜在失衡。 这是因为它以图形方式展示供需最强劲区域,及其过去的表现(显示旧区域)。 这些功能旨在帮助您更轻松地发现最佳入场区域和价位。 现在您可以针对您的交易品种和时间帧来优化和编辑区域强度! 高级供需指标适用于所有产品和时间帧。 它是一个新的公式,非常新的功能是两个区域强度函数可由用户输入进行调整! 这在交易中是一大优势。 当您学习如何使用专有功能,例如带有价格游离最小 X 因子的区域强度时,您能够判断该区域强劲与否。 供需
Super Signal – Skyblade Edition 專業級無重繪 / 無延遲趨勢信號系統,擁有卓越勝率 | 適用於 MT4 / MT5 在較低的時間週期上效果最佳,例如 1 分鐘、5 分鐘與 15 分鐘圖表。 核心特色: Super Signal – Skyblade Edition 是一套專為趨勢交易設計的智能信號系統。 其採用多重濾波邏輯,僅篩選出具有明確方向性、動能強勁且波動結構健康的走勢進場點。 本系統 不預測高點或低點 ,只有在同時滿足以下三項條件時才會觸發交易信號: 趨勢方向明確 動能持續增強 波動率結構穩定 此外,系統還結合市場流動性分析,以進一步提升信號的準確性與觸發時機。 信號特性: 所有箭頭信號皆為 100% 無重繪,無延遲 信號一旦出現即固定於圖表,不會閃爍或消失 提供圖表箭頭、資訊面板、彈出通知、聲音提示及推播訊息 支援 EA 呼叫(Buffer 輸出),可整合至自動化交易或信號跟單系統 提供預設參數模板,免調整即可使用,適合新手快速上手 總結: Super Signal – Skyblade Edition 是一款邏輯清晰、穩定高效的專業趨勢型
Liquidity Scalper System
Stanislav Konin
5 (2)
Liquidity Scalper System: 基于流动性的指标形式交易系统。 大多数指标只显示一个箭头,止损放在哪里、目标在哪里、信号是否可信,都要交易者自己判断。Liquidity Scalper System 覆盖完整的交易周期:寻找流动性池,在其被突破时给出信号,立即计算 Entry、Stop Loss 和三个目标,并在面板上显示统计数据以及新数据上的验证结果。系统自行选择设置,并每天更新。 工作原理 1. 系统寻找流动性池:市场参与者止损单聚集的价位。 2. 当价格突破流动性池,且突破经由动能(必要时还经由成交量)确认后,图表上出现 BUY 或 SELL 箭头。 3. 立即绘制 Entry、Stop Loss、TP1、TP2 和 TP3 水平,并填充区域。 4. 右侧构建流动性分布图:可以看到价格上方和下方大成交量集中的位置。 与众不同之处 • 自动优化取代手动调参。 系统在历史数据上测试 32 种设置组合,为当前品种和周期选出最佳组合。优化目标可选:Win Rate、净利润或盈利因子。 • 新数据验证。 设置在一部分历史上训练,并在优化器未见过的更新数据上检验(out
Gann Made Easy
Oleg Rodin
4.84 (174)
Gann Made Easy 是一个专业且易于使用的外汇交易系统,它基于使用先生理论的最佳交易原则。 W.D.江恩。该指标提供准确的买入和卖出信号,包括止损和获利水平。您甚至可以使用推送通知在旅途中进行交易。 购买后请联系我,即可免费获得交易指导和超棒的额外指标! 您可能已经多次听说过江恩交易方法。通常 Gann 的理论不仅对于新手交易者而且对于那些已经有一定交易经验的人来说都是非常复杂的东西。这是因为江恩的交易方法在理论上并不那么容易应用。我花了几年时间来完善这些知识,并将最好的原则应用到我的外汇指标中。 该指标非常易于应用。您所需要的只是将其附加到您的图表并遵循简单的交易建议。该指标不断进行市场分析工作并寻找交易机会。当它检测到一个好的入口点时,它会为您提供一个箭头信号。该指标还显示止损和获利水平。 换句话说,当您像先生一样进行交易时,该指标会为您提供最佳江恩建议。江恩亲自告诉你此时此刻该做什么。但最好的部分是您不需要了解任何有关江恩交易原则的知识,因为该指标会为您完成整个市场分析工作。
True Direction Oscillator
Muhammad Elbermawi
4.85 (364)
或 (TDO),它是一种使用“ 纯动量 ”原理衡量价格变化率的指数。 当证券价格从 10 上涨到 15 时,价格变化率为 150%,但当它从 15 回落到 10 时,价格变化率仅为 33.3%。这就是为什么像“价格变化率”(ROC) 或“动量”这样的技术分析指标给出的上升价格走势读数高于下降价格走势读数的原因。 TDO 解决了这个问题,以帮助交易者正确读取动量。 重要信息 TDO 用户手册: https://www.mql5.com/en/blogs/post/717970 TDO 常见问题: https://www.mql5.com/en/blogs/post/722015 TDO 视频库: https://www.mql5.com/en/blogs/post/722018 TDO Expert Advisor 示例: https://www.mql5.com/en/blogs/post/731141 TDO 特性 TDO 以百分比计算纯动量,因此它用于比较来自不同市场的不同证券。 (例如:将 EURUSD 与 Gold & Dow Jones Industrial 进行比较)
GoldRush Trend Arrow Signal
Kirk Lee Holloway
5 (2)
GoldRush 趨勢箭頭信號 GoldRush 趨勢箭頭信號 指標為 XAU/USD 中的高速、短期短線交易者提供精確、實時的趨勢分析。 專為1分鐘時間框架設計,此工具顯示方向箭頭以明確顯示入場點,使短線交易者能在波動市場中自信操作。 該指標包含主要和次要警示箭頭。主要信號為白色和黑色方向箭頭,用於指示趨勢方向的轉變;次要信號為藍色和紅色箭頭,用於確認主要箭頭指示的方向並提示潛在交易入場點。 注意:當趨勢方向發生變化後僅出現一個主要警報箭頭時,請注意可能會出現多個次要藍/紅箭頭。次要信號將在滿足信號標準的任何蠟燭圖後出現,因此在長期趨勢移動中,螢幕上將顯示大量次要箭頭(如附帶的截圖所示)。您可在設置中開啟或關閉任一箭頭類型。 以下是我使用此指標進行交易的方式: - 對於買入入場,我會耐心等待白箭頭在蠟燭收盤時出現,並在下一根可用蠟燭收盤時出現藍箭頭時進行買入交易。 - 對於賣出入場,我會耐心等待黑箭頭在蠟燭收盤時出現,並在下一根可用蠟燭收盤時出現紅箭頭時進行賣出交易。 - 獲利了結/止損設置由使用者自行負責,但我個人使用最低R:R為1:2,並發現這在倫敦/紐約開盤等
Advanced Currency Strength28 Indicator
Bernhard Schweigert
4.91 (659)
目前40%的折扣 任何新手或专家交易者的最佳解决方案! 这个指标是一个独特的、高质量的、可负担得起的交易工具,因为我们纳入了一些专有的功能和一个新的公式。只需一个图表,你就可以读出28个外汇对的货币强度!想象一下,你的交易将如何得到改善,因为你的交易是在你的手中进行的。想象一下,你的交易将如何改善,因为你能够准确地确定新趋势或剥头皮机会的触发点? 用户手册:点击这里  https://www.mql5.com/en/blogs/post/697384 这是第一本,原版的! 不要买一个毫无价值的崇拜者的克隆品。 特别的 子窗口中的箭头显示强劲的货币势头GAP将指导你的交易! 当基础货币或报价货币处于超卖/超买区域(外盘斐波那契水平)时,在个人图表的主窗口中出现警告信号。 当货币力量从外围区间回落时,回撤/反转警报。 十字星模式的特别警报 可选择多个时间框架,以快速查看趋势! 货币强度线在所有的时间框架中都非常平稳,当使用较高的时间框架来识别总体趋势,然后使用较短的时间框架来确定精确的入口时,效果非常好。你可以根据自己的意愿选择任何时间框架。每个时间框架都由其自身进行了优化。
目前八折优惠! 对任何新手或专家交易者来说都是最好的解决方案! 这个仪表板软件适用于28种货币对。它基于我们的两个主要指标(高级货币强度28和高级货币冲动)。它对整个外汇市场提供了一个伟大的概述。它显示高级货币强度值,货币运动速度和28个外汇对在所有(9)时间段的信号。想象一下,当你可以使用图表上的单一指标观察整个市场,以确定趋势和或剥头皮的机会时,你的交易将得到改善 我们已经在这个指标中建立了一些功能,使你更容易识别强势和弱势货币,同时识别和确认潜在的交易。该指标以图形方式显示货币的强势或弱势是增加还是减少,以及它在所有时间段的表现。 增加的新功能是动态市场斐波那契水平,它适应当前的市场条件变化,这是一个已经在我们的高级货币强度28和高级货币冲动指标中使用的成熟的加分项。 在交易时,总是将弱势货币和强势货币配对,这个新指标将帮助你做到这一点。 用户手册:点击这里  https://www.mql5.com/en/blogs/post/708783 特点  显示每个时间段的ACS28和GAP-speed(冲动)的货币强度值。 列:颜色代码以7种颜色显示货币强度:强势
TDI Multi Timeframe Scanner: This Dashboard indicator uses the TDI (Trader's Dynamic Index) Indicator to find best trades. Read detailed How to Use Guide: https://www.mql5.com/en/blogs/post/758252 Extra indicators also available in above post. Checks for: - SharkFin Pattern Free indicator for SharkFin: https://www.mql5.com/en/market/product/42405/ - TDI Trend: Strong/Weak Trend Up/Down - TDI Signal: Strong/Medium/Weak Signal for Buy/Sell - Consolidation - Overbought/Oversold - Volatility Ban
Italo Trend Indicator
Italo Santana Gomes
4.74 (34)
BUY INDICATOR AND GET EA FOR FREE AS A BONUS + SOME OTHER GIFTS! ITALO TREND INDICATOR  is the best trend indicator on the market, the Indicator works on all time-frames and assets, indicator built after 7 years of experience on forex and many other markets. You know many trend indicators around the internet are not complete, does not help, and it's difficult to trade, but the Italo Trend Indicator is different , the Italo Trend Indicator shows the signal to buy or sell, to confirm the signal t
Top Bottom Tracker MT4
Rodrigo Arana Garcia
Top Bottom Tracker 是一款基于复杂算法的指标,可分析市场趋势并检测趋势的高点和低点 / MT5 版本。 价格将逐步上升,直至达到 500 美元。下一个价格 --> $99 功能特点 无重绘 新数据到来时 该指标不会改变其数值 交易货币对 所有外汇货币对 时间框架 所有时间框架 参数 ==== 指标配置 ==== 配置参数 // 40(值越高,发出的信号越少但越准确) 上水平值 // 80(上水平线的值) 下水平线值 // 20(下水平线值) 指标计算条数 // 3000(您希望指标计算多少条。数值 0 将计算所有条形图的指标) ==== 警报配置 ==== 弹出警报 // true (在终端上发出警报) 电子邮件报警 // true (通过电子邮件报警) 警报时间间隔 // 10 (警报时间间隔,以分钟为单位) 警告 我只在 MQL5.com 上销售我的产品。如果有人联系您向您推销我的产品,那么他们就是骗子,只想要您的钱。 此外,如果您从外部网站购买我的产品,我向您保证,这些产品都是假冒版本,与正版产品效果不同。
作者的更多信息
SignalX Account Pulse MT5
Ahmed Ismail Muhammad Ismail Al Talhat
What this is A free single-strip readout of the numbers that decide whether an account survives a bad hour: equity, free margin, margin level with a colour state that warns before the margin call, floating profit and loss, and the current spread measured against its sixty-bar average. It takes no decisions for you and it is free on purpose. What it does Free strip showing equity, free margin, margin level with margin-call colouring, floating P/L, open position count and current spread against it
FREE
SignalX Account Pulse
Ahmed Ismail Muhammad Ismail Al Talhat
What this is A free single-strip readout of the numbers that decide whether an account survives a bad hour: equity, free margin, margin level with a colour state that warns before the margin call, floating profit and loss, and the current spread measured against its sixty-bar average. It takes no decisions for you and it is free on purpose. What it does Free strip showing equity, free margin, margin level with margin-call colouring, floating P/L and current spread against its 60-bar average. Fre
FREE
Gold Apex EA MT4
Ahmed Ismail Muhammad Ismail Al Talhat
# Gold Apex EA **Gold Apex EA** 是一款专为 MetaTrader 4 平台开发的先进自动化智能交易系统(Expert Advisor),专门针对黄金(XAUUSD)在 1 分钟图表上的高频剥头皮交易和动量执行而设计。该系统旨在通过系统化规则和严格的风险控制,应对贵金属交易中固有的快速价格行为和流动性变化。 ## 核心交易策略 该系统基于超短期算法框架运行,旨在捕捉低时间框架上的清晰定向动量: * **M1 动量分析:** 扫描 1 分钟图表上的传入tick和K线数据,以检测突发的动量扩张和流动性转变。 * **波动率过滤:** 集成了平均真实波幅(ATR)波动率门槛,以滤除低幅、震荡的市场阶段,确保仅在活跃的市场条件下建仓。 * **严格的止损纪律:** 每个订单在执行时即带有预定义的止损和止盈,防止出现未对冲的敞口或失控的回撤。 * **无网格或马丁格尔:** 完全依赖具有清晰风险边界的单一、独立交易执行,而不是恢复或平均化方法。 ## 核心优势 * **专业优化:** 专为 M1 时间框架上 XAUUSD 的价格动态和波动特征量身定制。
SignalX Session Breakout
Ahmed Ismail Muhammad Ismail Al Talhat
SIGNALX SESSION BREAKOUT MetaTrader 4 终极机构级价格行为与区间映射指标 产品概述与市场优势 欢迎使用 SignalX Session Breakout —— 专为专业交易者、算法开发者和价格行为专家打造的顶级技术分析解决方案,在 MetaTrader 4 上提供绝对的数学精度。 在现代金融市场中,早期区间盘整(如亚洲流动性区间或伦敦开盘前的建仓期)期间的机构足迹识别,决定了整个交易日的主要方向动能。散户交易者经常苦于手动划线、不同经纪商的时区差异以及搞乱执行区域的杂乱图表。 SignalX Session Breakout 完全自动化了这一工作流程。它能够瞬间锁定机构开盘区间,构建动态突破偏移通道,并将干净、不干扰视线的结构区直接投影到您的实时图表上。无论您交易的是外汇主要货币对(EURUSD、GBPUSD、USDJPY)还是黄金(XAUUSD)等贵金属,该指标都能为您提供捕捉高概率动能爆发所需的机构级优势。 核心架构优势 自动化机构区间计算: 瞬间计算并投影任意自定义时间窗口在历史交易日中的绝对最高价和最低价,无需手
SignalX Trade Panel
Ahmed Ismail Muhammad Ismail Al Talhat
What this is An on-chart control panel for manual MT4 trading. Instead of typing a lot size and hoping it is right, you set a risk percent once and every button on the panel sizes the position from your stop distance and the symbol tick value. What it does On-chart BUY/SELL buttons that size the position from a risk percent, plus CLOSE ALL and BE ALL. Interactive chart panel with risk-based sizing; no dependency on any indicator. Runs as an Expert Advisor attached to a single chart. No DLL calls
SignalX ATR Stop Planner
Ahmed Ismail Muhammad Ismail Al Talhat
What this is A planning tool that projects a volatility-based stop and target onto the chart and tells you the lot size that a fixed risk percent implies at that distance. Useful before you commit to a trade, and useful for building the habit of sizing from risk rather than from feeling. What it does Draws ATR-based stop and target levels and shows the lot size for a fixed risk percent. Volatility-adaptive stop projection drawn live on the chart. Runs as an Expert Advisor attached to a single ch
SignalX Break Even Guardian
Ahmed Ismail Muhammad Ismail Al Talhat
What this is A trade manager that works in R multiples. Once a position reaches a chosen R multiple it protects the trade, optionally takes partial profit, and only then starts trailing. It never opens trades. What it does Moves stops to break-even at a chosen R multiple, optionally takes a partial close, then trails. R-multiple driven management rather than fixed pip triggers; partial-close state persisted globally. Runs as an Expert Advisor attached to a single chart. No DLL calls. No external
SignalX Daily Risk Guard
Ahmed Ismail Muhammad Ismail Al Talhat
What this is An account-level circuit breaker. It watches the day's closed results plus floating profit and loss, and when a daily loss limit or a maximum trade count is reached it can stop new orders on the panel and flatten what is open. What it does Stops the day when a loss limit or a max-trade count is reached, and can flatten open positions. Account-level daily circuit breaker computed from closed history plus floating P/L. Runs as an Expert Advisor attached to a single chart. No DLL calls
SignalX Spread Monitor
Ahmed Ismail Muhammad Ismail Al Talhat
What this is A small on-chart readout of current spread, with a warning threshold, a colour state and an optional countdown to the next candle. Spread is a cost that most EAs and most manual traders simply do not measure. What it does Live spread versus 60-bar average, current session bucket, and seconds to the next bar close. Combines spread context, session awareness and bar timing in one compact panel. Runs as an Expert Advisor attached to a single chart. No DLL calls. No external services. N
SignalX Trade Journal Export
Ahmed Ismail Muhammad Ismail Al Talhat
What this is Writes your closed trade history to a CSV file on a timer or every tick, including commission and swap, with a totals row at the end. The point is a clean spreadsheet you can actually analyse offline instead of screenshots. What it does Writes the full closed-trade history to a CSV with a totals row, on a timer or every tick. Clean spreadsheet output including commission, swap and a computed total. Runs as an Expert Advisor attached to a single chart. No DLL calls. No external servi
SignalX Session Range Levels
Ahmed Ismail Muhammad Ismail Al Talhat
What this is Draws the high and low of a configurable session window together with the recent range history, so the levels that price has repeatedly reacted to are visible without hand-drawing them every day. What it does Marks the high and low of a configurable session for the last N sessions as extending levels. Historical session ranges kept as live trend lines, configurable wrap-around sessions. Runs as an Expert Advisor attached to a single chart. No DLL calls. No external services. No netw
SignalX Exposure Lens
Ahmed Ismail Muhammad Ismail Al Talhat
What this is Most multi-pair traders think in positions, not in currencies. Three long EURUSD trades and one short EURJPY feel diversified, but the book is really one large long EUR position. Exposure Lens opens every trade, splits it into its base and quote leg, nets every leg of the same currency together, converts the result into your account currency and shows what share of your equity each currency actually represents. What it does Nets every open position into per-currency long/short expos
SignalX Order Session Guard
Ahmed Ismail Muhammad Ismail Al Talhat
What this is Pending orders left overnight and positions carried through the weekend are two of the most common ways a planned trade turns into an unplanned risk. This utility handles the clock for you: it cancels pending orders that have been sitting for longer than you allow, closes everything at a session end time you choose, and forces a cut-off before the Friday close. What it does Expires stale pending orders, flattens all positions at a chosen session end time, and forces a Friday cut-off
SignalX Volatility Regime Gauge
Ahmed Ismail Muhammad Ismail Al Talhat
What this is An ATR value of 12 points means very different things on EURUSD H1 and on gold M5. This indicator turns ATR into a percentile: the current ATR is ranked against the previous bars, and the result is plotted on a 0 to 100 scale with four bands. 20 means the market is quieter than 80 percent of the recent past; 90 means it is near the most volatile reading of the window. What it does Plots the percentile rank of ATR over a lookback window as a 0-100 oscillator with LOW / NORMAL / ACTIV
SignalX Currency Strength Meter
Ahmed Ismail Muhammad Ismail Al Talhat
What this is A currency is not strong or weak on its own; it is strong or weak against the others. This dashboard builds one score per major currency by measuring the change of every pair that currency appears in and crediting the base side with that change while debiting the quote side by the same amount. Averaging those credits gives eight numbers that can be compared directly. What it does Builds one strength score per currency from the change of every pair it appears in, and ranks all eight
SignalX Daily Range Envelope
Ahmed Ismail Muhammad Ismail Al Talhat
What this is Every symbol has a typical day. When a symbol has already travelled most of that distance, the rest of the day usually holds less, and a breakout strategy that works on a fresh day can stall on a spent one. This indicator measures the average daily range from history and projects half, three quarters and all of it above and below today open, so the scale of the current move is obvious at a glance. What it does Measures the average daily range over N days and projects 50%, 75% and 10
SignalX Hourly Range Stats
Ahmed Ismail Muhammad Ismail Al Talhat
What this is Not every hour of the trading day moves the same amount, and the difference matters: a breakout at a dead hour is far more likely to fail than the same setup during the session when the symbol actually travels. This indicator averages the high-low range of each hour of the server day over a number of days and shows all twenty-four hours as a ranked table. What it does Averages the high-low range of every hour of the server day over N days and ranks all 24 hours with a bar and a perc
SignalX Level Alert Grid
Ahmed Ismail Muhammad Ismail Al Talhat
What this is Watching several charts for a handful of price levels is a poor use of attention. This tool watches the levels for you. You type a list such as 1.0850;1.0900;EURUSD 1.2700 into one input, and it alerts when price approaches, touches or crosses each level. Every level fires once, so an alert means something happened rather than repeating all day. What it does Watches a list of price levels, on one symbol or several, and alerts on approach, touch and cross, each firing once per level.
SignalX Margin Buffer Guard
Ahmed Ismail Muhammad Ismail Al Talhat
What this is When margin runs low, the broker closes whatever it decides to close, usually the largest position and usually at the worst moment. This utility acts before that point with two stages: an alert at a warning level you set, and then an orderly close of the least profitable position once a lower level is reached, pausing between closes and stopping as soon as margin recovers. What it does Warns at one margin level and starts closing the least profitable position, one at a time with a c
SignalX Pending Order Grid
Ahmed Ismail Muhammad Ismail Al Talhat
What this is Placing a ladder of pending orders by hand is slow and error-prone, and one mistyped lot size turns a plan into an accident. This tool builds the whole ladder in one action: a fixed number of levels per side, a fixed distance between them, one lot size, and optional stop loss and take profit in points. Before anything is sent it draws exactly where the orders would sit, and it only places them when you set the arming input to true. What it does Places a symmetric ladder of buy-limit
SignalX Pivot Levels
Ahmed Ismail Muhammad Ismail Al Talhat
What this is Pivot levels give a reference frame for the day without any indicator clutter: where the previous period balance sits, and where the likely support and resistance are. This indicator draws daily, weekly and monthly pivots at once, in classic, Fibonacci, Camarilla or Woodie form, labelled with their prices. What it does Draws daily, weekly and monthly pivots at once in one of four methods: classic, Fibonacci, Camarilla or Woodie. Three timeframes of pivot structure in one tool with t
SignalX Prop Challenge Tracker
Ahmed Ismail Muhammad Ismail Al Talhat
What this is Evaluation accounts are scored on rules, not on feelings, and the rules are unforgiving in one direction: a profit target is a goal, but a daily loss limit or a maximum drawdown is a hard stop. This tracker keeps all three numbers on the chart at once, measured from the starting balance you enter, so the distance between where the account is and where it is allowed to go is always visible. What it does Tracks profit-target progress, worst daily loss and worst total loss against the
SignalX Spread History Export
Ahmed Ismail Muhammad Ismail Al Talhat
What this is The spread you are quoted is a cost you pay on every trade, and most traders never measure it. This recorder samples the spread on a schedule, for one symbol or for everything in Market Watch, and appends it to a CSV file inside the terminal data folder. The result is a record you can open in a spreadsheet and use to compare hours, days and brokers. What it does Samples live spread on a fixed interval, one symbol or the whole Market Watch, and appends time / symbol / spread / ask /
SignalX Weekend Gap Detector
Ahmed Ismail Muhammad Ismail Al Talhat
What this is Weekend gaps are one of the few market events that can be measured exactly on your own chart. This indicator marks every gap between the Friday close and the Monday open, draws it as a zone, and reports what share of the recent gaps were filled and how long the fill took on average for this symbol. What it does Finds every weekend gap, draws it as a zone and reports what share of the last N gaps were filled and how many bars the fill took on average. Converts a folk belief into a pe
Visual Lot Size Calculator
Ahmed Ismail Muhammad Ismail Al Talhat
Visual trade planning and lot calculation utility for MetaTrader 5. Description: This utility allows traders to plan their entries visually directly on the chart. By using interactive graphical boxes, you can define your entry, stop loss, and take profit levels before opening a position. The software automatically calculates the required volume (lots) based on your account settings. It provides real-time data updates as you move the graphical elements on the screen. Key Features: Interactive In
SignalX Spread Monitor MT5
Ahmed Ismail Muhammad Ismail Al Talhat
What this is A small on-chart readout of current spread, with a warning threshold, a colour state and an optional countdown to the next candle. Spread is a cost that most EAs and most manual traders simply do not measure. What it does On-chart readout of current spread in points, its 60-bar average, spread against a warning level, the active session and a countdown to the next bar close. Puts the cost of the trade on the chart next to the price, with a warning state, instead of hiding it in the
SignalX Level Alert Grid MT5
Ahmed Ismail Muhammad Ismail Al Talhat
What this is Watching several charts for a handful of price levels is a poor use of attention. This tool watches the levels for you. You type a list such as 1.0850;1.0900;EURUSD 1.2700 into one input, and it alerts when price approaches, touches or crosses each level. Every level fires once, so an alert means something happened rather than repeating all day. What it does Watches a list of price levels, on one symbol or several, and alerts on approach, touch and cross, each firing once per level.
SignalX Session Range Levels MT5
Ahmed Ismail Muhammad Ismail Al Talhat
What this is Draws the high and low of a configurable session window together with the recent range history, so the levels that price has repeatedly reacted to are visible without hand-drawing them every day. What it does Marks the high and low of a configurable session window and keeps the last N sessions on the chart as boxes, with breakout levels extended to the right and each box labelled with its range in points. Session structure on demand at any hour window, drawn as the actual tradable b
SignalX Volatility Regime Gauge MT5
Ahmed Ismail Muhammad Ismail Al Talhat
What this is An ATR value of 12 points means very different things on EURUSD H1 and on gold M5. This indicator turns ATR into a percentile: the current ATR is ranked against the previous bars, and the result is plotted on a 0 to 100 scale with four bands. 20 means the market is quieter than 80 percent of the recent past; 90 means it is near the most volatile reading of the window. What it does Plots the percentile rank of ATR over a lookback window as a 0-100 oscillator with LOW / NORMAL / ACTIV
筛选:
无评论
回复评论