SignalX Spread Monitor MT5

What this is

A small on-chart readout of current spread, with a warning threshold, a colour state and an optional countdown to the next candle. Spread is a cost that most EAs and most manual traders simply do not measure.

What it does

On-chart readout of current spread in points, its 60-bar average, spread against a warning level, the active session and a countdown to the next bar close.

  • Puts the cost of the trade on the chart next to the price, with a warning state, instead of hiding it in the Market Watch column.
  • Runs on a single chart; it does not need to be the chart you trade from.
  • No DLL calls. No external services. No network requests.
  • No account, terminal, symbol or time limitation is embedded.

Inputs

InputTypeDefault
InpX int12
InpY int24
InpFontSize int9
InpSpreadWarn double25.0
InpShowCountdown booltrue
InpShowAverage booltrue
InpGoodColor colorclrLimeGreen
InpBadColor colorclrTomato

How to use it

  1. Attach the utility to a chart; it draws itself and needs no other file.
  2. Set the inputs to match how you read the chart. Defaults are deliberately plain.
  3. Nothing is sent anywhere: it reads the chart it sits on and writes only to that chart.
  4. Test on a demo account first. That is not a formality; the defaults are not tuned to your broker.

Notes

  • Written for MetaTrader 5, any broker. It uses only standard platform functions; no DLL, no external library.
  • Coexists with other tools on the same account; it only touches what you point it at.
  • It performs management and measurement only; it does not generate trading signals.

Honest limits

  • This is a tool, not a strategy. It does not predict anything and it cannot make a losing method profitable.
  • No performance figures are published for it because tools of this kind do not have a meaningful backtest curve of their own.
  • If your broker quotes oddly (very wide spreads, non-standard tick values) verify the sizing on a demo account before using real funds.

Trading involves risk of loss. Nothing here is financial advice.

推荐产品
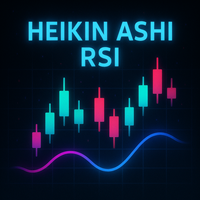
Let us introduce the Heikin Ashi RSI Oscillator! This indicator combines the concepts of Heikin Ashi candles with the RSI (Relative Strength Index) to produce an oscillator-like format that can be used to filter out some of the noise associated with standard RSI readings. This provides traders with a smoother representation of market conditions. Here are some articles to read more about the RSI and Heikin Ashi candles: https://www.investopedia.com/terms/r/rsi.asp https://www.investopedia.com/ter
CosmiCLab FIBO
Kirils Subins
CosmiCLab SMC FIBO CosmiCLab SMC FIBO is a professional trading indicator designed for traders who use Smart Money Concepts (SMC), market structure analysis and Fibonacci retracement levels. The indicator automatically detects market swings and builds Fibonacci levels based on the latest impulse movement. It also identifies market structure changes such as BOS (Break of Structure) and CHOCH (Change of Character), helping traders understand the current market direction. CosmiCLab SMC FIBO also pr
Fabii Half Trend Baseline
Fabien Georges Andre Guillemaud
不要再逆着更高周期的趋势交易。两条基准线,一张图表。不重绘。 任何品种,任何周期。2 分钟内用在您的图表上。可在 Strategy Tester 中免费试用演示。 Get more indicators here Baselines, volatility filters and oscillators. No repaint. 为什么需要它 您因为图表上的线变绿而入场。随后您打开更高周期,发现大趋势指向相反方向。信号是真实的,但信号背后的趋势并不站在您这一边。 每一笔逆着大趋势的交易,都会削弱您入场时的优势。 您将获得 Fabii Half Trend Baseline 在一张图表上同时显示您当前周期的趋势和更高周期的趋势,您不必再切换窗口去确认大方向。 来自更高周期的第二条基准线绘制在主线后方,因此您无需打开另一张图表就能看到大趋势。 基准线只随趋势移动,不会后退,因此您一眼就能看到趋势会在哪里被打破。 在已确认的反转处显示 Buy 和 Sell 箭头,因此趋势改变的那一刻您会得到清晰的标记。 可选的 K 线着色跟随趋势,因此您可以直接从 K 线读出趋势。 趋势转换和更高周期
Equity Sculper EA
Christopher Calmerin
Put your trading profits to work. Equity Sculptor EA is an MT5 trade-management tool that uses new closed profits to gradually reduce losing positions across your account. Account-wide management: All symbols and magic numbers, including manual trades. Two funding modes: Rescue Wallet or Legacy Balance. Flexible settings: Customize profit allocation, trim size and trade selection. Clear dashboard: View your funds, performance and configurations. Persistent tracking: Saved accounting continues af
Heiken_Ashi_Bars - MT5 高级趋势可视化指标 概述 Heiken_Ashi_Bars 是一款强大且视觉直观的自定义指标,旨在过滤市场噪音并突出真实的潜在趋势。传统的K线图往往走势剧烈,容易导致错误信号和过早出场。通过对价格数据进行平均化,该指标平滑了价格走势,使您更容易发现趋势延续、反转和高胜率的入场区域。 无论您是剥头皮交易者、日内交易者还是波段交易者,Heiken_Ashi_Bars 都能为您提供清晰、无压力的图表交易环境。 主要功能与优势 极致降噪: 过滤微小的价格波动和盘整噪音。 清晰的视觉信号: 颜色编码的柱体让多头和空头动能一目了然。 不重绘 (No Repaint): 指标在当前K线收盘后锁定信号,绝对不重绘历史数据。 高度优化: 代码简洁,确保终端零延迟。 广泛适用: 完美适用于所有金融工具(外汇、指数、贵金属、加密货币)。 如何交易 上升趋势 (买入信号): 等待连续的看涨 Heiken Ashi 柱体(最好没有下影线)。 下降趋势 (卖出信号): 等待连续的看跌 Heiken Ashi 柱体(最好没有上影线)。 反转与犹豫: 实体小且上下影线长的
CCI Fixed Dual
Edoardo Centorame
什么是 CCI FIXED DUAL CCI FIXED DUAL 是一个专业级 Trend Direction Filter,旨在精准识别: 市场的主导方向 走势的结构质量 主趋势与加速阶段之间的一致性 它不是一个直接入场指标。 它不是一个传统振荡器。 它是一个市场环境工具,旨在帮助交易者决定何时交易以及何时不交易,从而大幅减少市场噪音和判断错误。 CCI FIXED DUAL 的基本理念 CCI FIXED DUAL 所基于的原则简单但强大: 一个信号只有在与市场结构一致时才有价值。 因此,该指标: 不使用单一数值 不会对价格做出冲动反应 不会刻意寻找反转点 而是建立在以下基础之上,构建出一种层级化的趋势解读: 基于 Typical Price 的 CCI 不同速度的 LWMA 移动平均线 短期 中期 和长期之间的动态比较 因此,其结果是对市场方向的一种稳定 干净 且可靠的表达。 指标的技术结构: CCI FIXED DUAL 由四个主要部分组成,全部显示在独立窗口中。 1 CCI magenta 线 这是指标的信息基础。 衡量典型价格的偏离程度 提供应用平滑处理的原始材料 它并不
Has rsi signal
Evgenii Savinov
HAS RSI Signal — 带有止损/止盈计算的专业趋势指标 HAS RSI Signal 是一款强大的交易工具,结合了经典指标与现代噪声过滤算法。该指标通过 Heiken Ashi Smoothed (HAS) 平滑蜡烛图和 RSI 震荡指标进行市场分析,在趋势反转或价格退出超买/超卖区域时,为交易者提供清晰的人场信号。 主要优势: 双重过滤: 使用 Heiken Ashi Smoothed 算法消除市场“噪音”,同时通过 RSI 确认动能强度。 自动计算点位: 指标不仅提供信号,还会根据当前市场波动率 (ATR) 自动计算 止损 (Stop Loss) 和 止盈 (Take Profit) 点位。 视觉直观: 信号以彩色蜡烛图的形式直接显示在主图表上,保持交易界面的整洁有序。 多维度通知: 内置终端弹窗警报、声音提示以及手机推送通知 (Push),确保您不会错过任何交易机会。 核心原理: 指标持续监控 RSI 的极端区域。当价格离开临界区且 HAS 算法确认方向转变时,即生成交易信号。ATR 参数允许止损和止盈根据市场当前的波动性进行动态调整。 核心参数设置: InpPeri
Prime Vortex Pro (MT5) — Multi-Layer Confluence Trend & Reversal Signal Indicator Built natively for MetaTrader 5. Fewer signals. Stronger confluence. Why Prime Vortex Pro Exists Most signal indicators fire on nearly every candle — dozens of arrows a day, most of them noise that pulls traders into weak, low-probability setups. Prime Vortex Pro flips that approach: silence is the default. A signal only appears when multiple, independent layers of market evidence — trend, trend strength, market st

【均线流二号】 一眼看透多空力量,把行情节奏握在手里 还在几百根均线里看得眼花缭乱?还在犹豫"该不该进场、该在哪止损"? 均线流二号把传统均线"升级"成一套完整的趋势作战系统——图表上不再是零散的价格线, 而是一条可视化的"多空河流"。多达100条均线同时滚动,每一根K线上, 哪一方正在掌控、力量有多强、即将发生什么,全都清清楚楚地摆在你眼前。 为什么值得你拥有? 一眼看趋势,告别主观猜测 全屏均线流实时着色:多头红、空头绿,方向一目了然。无论你是新手还是老手, 都不用再靠"感觉"判断行情,K线处于多头区还是空头区,扫一眼就知道。 三级信号,捕捉行情起爆点 系统自动给出三类买卖提示: · 顺势信号——趋势刚确立,跟对方向入场; · 反转信号——趋势即将掉头,提前布局; · 极开信号——多空力量极致收敛后的爆发行情,机会价值最高。 做多信号在K线下方标注,做空信号在上方标注,绝不混淆。 不止告诉你方向,还画好止损与止盈 每一笔潜在交易都自带"作战地图":止盈线、止损线、极价线自动绘制, 什么时候离场、什么时候设保护,不再靠拍脑袋。配合"前小线宽突破"检测, 专
LT Rainbow Trend
Thiago Duarte
5 (1)
== LT RAINBOW TREND - 包含 36 条移动平均线的趋势指标 == 概述 LT Rainbow Trend 是一款先进的技术趋势分析指标,它集成了 36 条同时运行的移动平均线,并配备了智能彩虹(Rainbow)颜色系统。该指标专为希望以极高视觉清晰度顺应主趋势交易的交易者而设计,将复杂的多时间周期(Multi-timeframe)分析转化为简单、多色且高度直观的视觉呈现。 对于深谙“趋势是你的朋友”的交易者而言,该指标是您的不二之选 —— 它能确保您提前洞察趋势 strength 的力度、方向以及潜在的反转点。 运作原理 该指标持续监控分布在 4 个趋势区域内的 36 条移动平均线: 红色(趋势转变区) 第 31 至 20 条移动平均线 趋势即将发生反转的强信号 橙色(趋势减弱区) 第 19 至 10 条移动平均线 表明趋势动能正在减弱,但仍有持续的可能;价格可能正步入盘整 蓝色(回调/回踩区) 第 9 至 8 条移动平均线 顺应当前趋势的正常回调。若价格位于该区域外并开始进入绿色区域,则代表强劲趋势 绿色(强趋势区) 第 10 至
An indicator of pattern #31 ("Long Island") from Encyclopedia of Chart Patterns by Thomas N. Bulkowski. The second gap is in the opposite direction. Parameters: Alerts - show alert when an arrow appears   Push - send a push notification when an arrow appears (requires configuration in the terminal) GapSize - minimum gap size in points ArrowType - a symbol from 1 to 17 ArrowVShift - vertical shift of arrows in points   ShowLevels - show levels ColUp - color of an upward line ColDn - color of a d
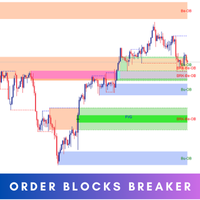
Introducing   Order Blocks Breaker , a brand-new way to identify and leverage order blocks in your trading strategy. After developing multiple order block tools with unique concepts, I’m proud to present this tool that takes things to the next level. Unlike previous tools,   Order Blocks Breaker   not only identifies order blocks but also highlights   Breaker Order Blocks —key areas where the price is likely to retest after a breakout. MT4 -  https://www.mql5.com/en/market/product/124101/ This t
BlueBoat – Prime Cycle is a technical indicator for MetaTrader 5 that visualizes market cycles based on the Fimathe cycle model (Marcelo Ferreira) . It identifies and displays historic and live cycle structures such as CA, C1, C2, C3, etc., helping traders understand the rhythm and timing of price movement across multiple sessions. This tool is ideal for manual analysis or as a supporting signal in discretionary strategies. Key Features Historical Cycle Analysis – Backtest and visualize as many
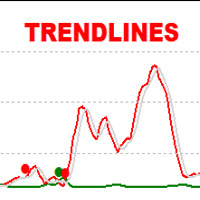
The   Trendlines Oscillator   helps traders identify trends and momentum based on the normalized distances between the current price and the most recently detected bullish and bearish trend lines. The indicator features bullish and bearish momentum, a signal line with crossings, and multiple smoothing options. USAGE The   Trendlines Oscillator   works by systematically: Identifying pivot highs and lows. Connecting pivots to form bullish (support) and bearish (resistance) trendlines. Measuring
SlopeChannelB MT5
MIKHAIL VINOGRADOV
SlopeChannelB – 一种技术分析工具,构建倾斜的价格运动通道,为评估当前市场状况和寻找交易信号提供独特机会。 指标的主要特点: 倾斜的价格运动通道 : 该指标有助于可视化支持和阻力水平,这些水平可能表明潜在的反转点或趋势持续。 线条颜色多样和背景突出显示 : 倾斜的支持和阻力级别以不同颜色显示,通道本身还通过背景额外突出,简化图表的视觉分析。 三种计算线条的选项 : 指标使用回归分析来构建通道线。您可以选择以下三种方法之一: Robust (默认) – 对异常值具有鲁棒性的方法。 OLS (普通最小二乘法) 。 Median (中位数计算) 。 最优模型选择 : SlopeChannelB根据五个质量标准的分析自动选择最适合的通道线变体。 质量参数直接在图表上显示,帮助您评估结果。您还可以使用按钮手动切换通道构建选项。 双信号系统 : 第一信号 – 当价格达到倾斜的阻力或支持级别时发生。 第二信号 – 记录价格从级别到通道中心的移动。 这些信号有助于寻找反弹的入场点,但始终需要其他工具的确认。 与其他指标联合使用 : 建议将SlopeChannelB与振荡器或趋势
Crypto_Forex MT5 版“锤子线和射击之星”指标,无需重绘,无延迟。 ................................................................................. - “锤子线和射击之星”指标是价格行为交易的强大指标。 - 指标可检测图表上的看涨锤子线和看跌射击之星形态: - 看涨锤子线 - 图表上显示蓝色箭头信号(见图)。 - 看跌射击之星 - 图表上显示红色箭头信号(见图)。 - PC, Mobile alerts. - “锤子线和射击之星”指标非常适合与支撑/阻力位结合使用。 .................................................... 点击这里查看高质量的交易机器人和指标! 这是仅在 MQL5 网站上提供的原创产品。
Candlestick Pattern Scanner is a multi-timeframe and multi-symbol dashboard and alert system that checks all timeframes and currency pairs for different candlestick patterns that are formed in them. Scanner is integrated   with support and resistance zones so you can check the candlestick patterns in most important areas of the chart to find breakout and reversal patterns in the price chart. Download demo version   (works on M4,M6,M12,H3,H8 timeframes and 20 symbols of Market Watch window) Read
适用于MT5平台的“WPR双均线指标”,无重绘。 - WPR本身就是短线交易的最佳震荡指标之一。 - “WPR双均线指标”允许您查看WPR震荡指标的快慢均线。 - 该指标能够帮助您及早发现价格回调。 - 此指标的参数设置非常简单,适用于任何时间周期。 - 您可以在图片中看到买入和卖出的入场条件。 - 通过 PC 和移动设备接收 WPR MAs 交叉警报。 买入信号示例: (1) - 如果快均线向上穿过慢均线,且WPR值低于-50:开立买单。 (2) - 一旦WPR值进入超买区域,高于-20:平仓。 卖出信号示例: (1) - 如果快均线向下穿过慢均线,且WPR值高于-50:开立卖单。 (2) - 一旦 WPR 值低于 -80 进入超卖区域:平仓卖单。 点击这里查看高质量的交易机器人和指标! 这是仅在 MQL5 网站上提供的原创产品。
指标 WPRV2 的完整描述 指标 WPRV2 是经典技术分析工具威廉斯百分比范围(%R)的改进版本。它主要用于金融市场,包括股票交易所、外汇和加密货币平台,以帮助分析市场趋势并确定最佳入场和出场点。 指标用途 WPRV2 指标的主要目的是测量当前价格相对于最近高低点的位置。通过这种方式,可以了解: 当前价格是否接近历史高位? 当前价格是否接近历史低位? 这有助于交易者及时响应价格反转或现有趋势持续的信号。 WPRV2 指标特点 1. 图形表示法 该指标在主资产图表之外单独显示,并由两条线组成: 主线 ( WPR ):展示给定周期内 %R 满足值的变化情况。 附加红色线 ( Current ):仅显示当前指标值及前一个数据点,可视化跟踪移动方向。 2. 水平水平线与通知功能 用户可以设置三个水平水平线(默认为 -20%、-50% 和 -80%),当价格达到这些极限区域时会发出警报。当主线向上或向下穿越水平线时,指标将生成可视化和声音提示,便于立即决策。 3. 时间参数调节 主要配置项是计算期间长度 ( WPRPeriod ),决定考虑价格极值的时间段。较短的周期使得指标对短期价格波动
YazanPro Pattern Scanner
Yazan Adnan Ramadan Ibrahim
概述 YazanPro Pattern Scanner 是一款 MetaTrader 5 指标,面向在多个市场上使用图表形态的交易者。它在最多 9 个周期上检查最多 150 个品种,寻找经典图表形态和 40 种K线形态,并把所有结果连同每个形态已到达的阶段列在一张表中。您无需逐个打开图表,就能看到哪里的形态刚刚完成、突破、回踩或确认,点击一下即可打开画好形态的那张图表。 主要功能 最多 150 个品种,来自您的市场报价窗口、经纪商的全部可交易品种或您自己的列表:外汇、金属、指数、股票、能源和加密货币。 M1 到 MN1 的 9 个周期中任意一个,用按钮开启或关闭(默认 M15、H1、H4 和 D1)。 双顶双底和三重顶底、头肩形态、三角形、楔形、旗形和三角旗、矩形、通道以及杯柄形态。 七个阶段:形成中、已完成、突破、回踩、确认、假突破和过期。 最后一根已收盘K线上的 40 种K线形态。 突破成交量、到突破线的距离以及最近的支撑或阻力,以 ATR 为单位。 计数方块、阶段和方向筛选,以及用于大规模扫描的分页。 当前图表的形态会被画出,包括突破、回踩、确认、目标线和止损线。 点击某一行即可
Confluence Meter:26 个指标,一个综合评级 Confluence Meter 会计算 26 个常用指标的信号,并将它们汇总为简洁的"卖出 / 中性 / 买入"评级。无需打开几十个窗口,也不必手动比对读数。看一眼面板,就能知道所选周期上市场偏向哪一边。 MT4-version:  https://www.mql5.com/en/market/product/199466 Our products: https://www.mql5.com/en/users/trendhunter/seller 图表上显示的内容 **Oscillators 仪表盘。**由 11 个震荡指标组成的评级:RSI、Stochastic、CCI、ADX、Awesome Oscillator、Momentum、MACD、Stochastic RSI、Williams %R、Bulls/Bears Power 和 Ultimate Oscillator。 **Moving Averages 仪表盘。**由 15 个趋势指标组成的评级:周期为 10、20、30、50、100、200 的 SMA 和
历史订单统计 (Advanced History Collector Panel) MT5 版本 历史订单统计 是一款专为 MetaTrader 5 (MT5) 设计的高级账户分析与可视化工具。它能够深度复盘您的交易历史,将枯燥的成交数据转化为直观的图表与详细的统计报表。 核心功能: 多维度数据统计 :精准计算每日/周/月的盈亏、订单总量、多空对比及手数分布。 可视化图表系统 :内置盈亏折线图、净值曲线、持仓品种分布柱状图等多种统计视图,支持实时动态绘制。 深度风险分析 :自动统计最大浮盈、最大浮亏及账户余额变动,助您洞察资金管理中的薄弱环节。 高度自定义 UI :支持字体、颜色、面板尺寸及统计时间范围的完全自定义,适配各种分辨率屏幕。 数据自动化 :支持历史数据导出与自动加载,确保统计结果的连续性与实时更新。 无论是复盘交易策略还是日常资金监控,本指标都是您提升交易纪律、优化风控的得力助手。
FREE
Rainbow Collection
Minh Truong Pham
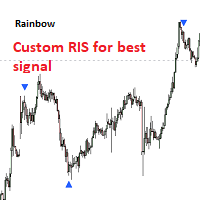
Slopes are an increasingly key concept in Technical Analysis. The most basic type is to calculate them on the prices, but also on technical indicators such as moving averages and the RSI. In technical analysis, you generally use the RSI to detect imminent reversal moves within a range. In the case of the Blue indicator, we are calculating the slope of the market price and then calculating the RSI of that slope in order to detect instances of reversal. The Blue indicator is therefore used as
适用于 MT5 平台的“双射击之星形态”( Double Shooting Star pattern )加密货币与外汇交易指标——无重绘,无延迟。 - “双射击之星形态”指标是一款功能强大的价格行为(Price Action)交易工具,特别适用于下跌趋势市场。 - 该指标能识别一种罕见但高效的形态:图表上的看跌双射击之星形态。 - 看跌双射击之星形态——图表上显示红色箭头信号(请参阅图片)。 - 内置电脑端及移动端提醒功能。 - “双射击之星形态”指标非常适合与支撑/阻力位结合使用。 - 提供 4 种不同样式的信号箭头。 Click here to see high quality Trading Robots and Indicators! 这是仅在 MQL5 网站上提供的原创产品。
Candle Fusion Pro
Martin Alejandro Bamonte
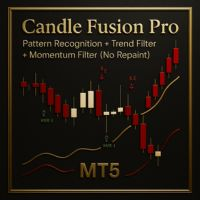
Candle Fusion Pro — 蜡烛图形态识别 + 趋势过滤器 + 动量过滤器(无重绘) 检测强大的蜡烛图形态,并通过实时趋势与动量分析确认其强度。 Candle Fusion Pro 是一款为依赖 价格行为精度 、趋势结构和 多重确认 的交易者而打造的终极可视化工具。 核心功能 基于形态的入场 :检测超过 10 种高级日式蜡烛图形态 ,包括: 流星形态(级别 2、3、4) 看涨/看跌吞没 晨星 / 晚星 十字星与十字星形态 锤子线(级别 2、3、4) 刺透线和乌云盖顶 无重绘、无延迟 :箭头和形态标签仅在蜡烛收盘时绘制, 不会随行情变化而改变 。 实时确认 : 趋势过滤器 (根据时间周期自动调整) RSI 强度标签 :颜色显示(绿色 <30,橙色,中性,红色 >70) ADX 动量过滤器 :显示趋势延续或震荡状态(阈值为 25): 强趋势 = 趋势延续 , 弱趋势 = 横盘震荡 可视化优势 : 箭头偏移和文字大小根据时间周期自动调整 整洁界面,趋势方向、RSI、ADX 一目了然 可选图表配色增强视觉聚焦 智能提醒 : 可按图形单独启用或关闭提醒 支持总开关控制所有提醒
KCI Candle
Syamsurizal Dimjati
KCI Candle: Advanced Kinematics Price Action The KCI (Kinematics Computing Index) Candle is a next-generation analytical tool designed to transform raw market data into crystal-clear visual intelligence. By painting the chart's candles based on deep mathematical kinematics, this indicator provides traders with an immediate, unambiguous reading of the current market direction and momentum. Built for professional traders who demand clean charts and pure data, the KCI Candle eliminates second-guess
FREE
Trading Utility for Forex Currency Pairs Only not for Gold  Functions Auto Lot Calculation based on Risk Auto stoploss  Auto TakeProfit Breakeven Auto Close Half % Close in percentage with respect to the PIPs Pending Orders BuyLimit Sell Limit with distances BuyStop Sell Stop    with distances Trading Informations Risk in percentage For Multiple trades Combine Takeprofit and Combine Stoplosses
NQX Smooth Trend Flip Weekly Bias 是一款适用于 MetaTrader 5 的信号指标:平滑趋势翻转信号(仅顺周线偏向方向发出信号)。 NQX 专有逻辑:检测一段行情后平滑K线的颜色翻转。仅顺周线偏向方向发出信号。它会绘制建议入场位、较短的止损和较远的目标(3:1、5:1、10:1,波段最高可达 20:1);由您决定。 图表上显示的内容 - 在已收盘的信号K线上显示箭头(已收盘的信号绝不重绘)。 - 建议入场位、较短的止损和较远的建议目标(默认为风险的 6 倍),以及 3 x 1、5 x 1 和 10 x 1 参考线。 - 价格触及某一水平时,图表上会显示标签(目标或止损)。 - 显示最近一次信号以及可见历史中出现的信号数量的面板。 - 新信号的弹窗提醒和推送通知(可选)。 NQX 独家逻辑:没有其他任何 NQX 指标使用相同的入场信号与市场过滤器组合,因此其信号为本指标所独有。 设置 - 主要建议目标(风险倍数)及额外目标线(默认为 3 x 1、5 x 1 和 10 x 1)。 - 最小和最大止损距离(ATR 倍数),以及信号保持开启的最大K线数。 -
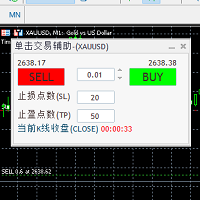
自带一键下单交易快捷键和K线收盘时间倒计时秒数的交易面板。 面板中可设置止盈止损点数;显示的倒计时秒数为图表周期中当前K线的收盘倒计时间; 自带一键下单交易快捷键和K线收盘时间倒计时秒数的交易面板。 自带一键下单交易快捷键和K线收盘时间倒计时秒数的交易面板。 自带一键下单交易快捷键和K线收盘时间倒计时秒数的交易面板。 自带一键下单交易快捷键和K线收盘时间倒计时秒数的交易面板。 自带一键下单交易快捷键和K线收盘时间倒计时秒数的交易面板。 自带一键下单交易快捷键和K线收盘时间倒计时秒数的交易面板。 自带一键下单交易快捷键和K线收盘时间倒计时秒数的交易面板。 自带一键下单交易快捷键和K线收盘时间倒计时秒数的交易面板。
Price Action Trade Panel EA MT5
Juvenille Emperor Limited
5 (4)
价格行为交易面板 MT5 根据指定(默认为 8 个)过去蜡烛的纯价格行为数据计算任何符号/工具的买入/卖出力量水平平衡。通过监控指标面板上可用的 32 个符号/工具的价格行为,这将为您提供最接近的市场情绪。超过 60% 的买入/卖出力量水平为买入/卖出特定符号(使用默认设置)提供了相当稳固的水平。价格行为交易面板 MT5 有 3 种计算模式,可用于标准、快速或缓慢接近价格行为,还提供可调整数量的价格行为蜡烛,以便更清晰或更平滑地适应实时变动。 价格行为交易面板 MT5 也是您可以找到的最简单易用的 MT5 交易面板。它的所有选项和功能都集中在一个表面上,无需打开额外的窗户或面板。它是一个订单管理、风险计算器、部分关闭和帐户保护实用程序的合一,使用起来极其方便!通过使用价格行为交易面板 MT5,您可以比传统的手动交易方法更快、更准确地进行交易,这让您有更多的时间和更清晰的头脑专注于您的交易决策。价格行为交易面板 MT5 也是一个很好的账户保护实用程序,它可以在达到账户止盈或止损净值后关闭所有未平仓交易、删除所有挂单并关闭所有带有任何 EA 的终端图表。 提示 :您可以在您的模拟账户中
该产品的买家也购买
Trade Assistant MT5
Evgeniy Kravchenko
4.43 (216)
它有助于计算每笔交易的风险,容易安装新的订单,具有部分关闭功能的订单管理, 7 种类型的追踪止损和其他有用的功能。   附加材料和说明 安装说明   -   应用程序说明 线条功能  - 在图表上显示开仓线、止损线、止盈线。 有了这个功能,就可以很容易地设置一个新的订单,并在开仓前看到它的附加特性。   风险管理  - 风险计算功能在考虑到设定的风险和止损单的大小的情况下,计算新订单的成交量。它允许你设置任何大小的止损,同时观察设定的风险。 批量计算按钮 - 启用 / 禁用风险计算。 在 " 风险 " 一栏中设置必要的风险值,从 0 到 100 的百分比或存款的货币。 在 " 设置 " 选项卡上选择风险计算的变量: $ 货币, % 余额, % 资产, % 自由保证金, % 自定义, %AB 前一天, %AB 前一周, %AB 前一个月。   R/TP 和 R/SL - 设置止盈和止损的关系。 这允许你设置相对于损失的利润大小。 例如, 1 : 1 - 这决定了 TP = SL 的大小。 2 : 1 - 这意味着 TP 是 SL 的两倍。 RR - 它禁用比率。   订单管理 该面板支
Farmed Hedge Yield Farming | All Markets (Manual - Hybrid - Semi/Automated EA) VERIFIED TRADING RESULTS - Farmed Hedge Yield Axi Copy:  https://www.mql5.com/en/signals/2356376 - Farmed Hedge Yield Exn Copy:   https://www.mql5.com/en/signals/2356404 - Farmed Hedge Yield V Copy:  https://www.mql5.com/en/signals/2357156 IMPORTANT NOTICE: FarmedHedge is a MANUAL-FOCUSED TRADING UTILITY ,not a fully automated EA. Results shown on this Signal include manual trades and overall strategic management.
欢迎来到 Trade Manager EA——这是一个终极风险管理工具,旨在使交易变得更直观、精准和高效。它不仅仅是一个下单工具,而是一个用于无缝交易计划、仓位管理和风险控制的全面解决方案。不论您是新手交易员、资深交易员,还是需要快速执行的剥头皮交易员,Trade Manager EA 都可以满足您的需求,适用于外汇、指数、大宗商品、加密货币等各种市场。 借助 Trade Manager EA,复杂的计算已成过去。只需分析市场,在图表上用水平线标记入场、止损和止盈,设置您的风险水平,Trade Manager 就会立即计算出理想的头寸规模,并实时显示以点、账户货币计价的止损和止盈。每笔交易都得以轻松管理。 主要功能: 头寸规模计算器 :根据定义的风险瞬间确定交易规模。 简单的交易计划 :在图表上用可拖动的水平线直接计划交易,设置入场、止损和止盈。 实时显示 SL 和 TP :以账户货币、点或分显示止损和止盈,便于分析。 高级保护工具 盈亏平衡选项 : 基本盈亏平衡 :当您的交易达到设定水平时自动保护利润。 多级盈亏平衡 :设置多达 4 个级别以逐步保护利润。 尾随止损选项 : 基本尾随
Telegram to MT5 Multi-Channel Copier   可将您 Telegram 和 Discord 频道中的交易信号自动复制到 MetaTrader 5。无需机器人、无需浏览器扩展、无需手动复制。信号一到 Telegram 或 Discord,EA 几秒内就在您的终端开仓。 在复制某个频道之前,内置回测器还能告诉您该频道在您的账户上会有怎样的表现。 产品包含两个组件:一个监听您 Telegram 频道的 Windows 应用程序,以及在 MT5 终端执行信号的本 EA。同时提供 MT4 版本   点此 . 购买前先试用:   应用程序可免费下载。连接您自己的频道,查看每条信号的读取结果。Backtest 选项卡和实际交易需要已购买或已租用的 EA。本页面的免费演示版只能在策略测试器中运行,而策略测试器无法读取 Telegram 和 Discord。 设置指南与应用下载:   https://www.mql5.com/zh/blogs/post/779480 了解如何 回测任何 Telegram 信号频道 。 当前价格将来会上调。 工作原理 应用通过您自己的 Te
Local Trade Copier EA MT5
Juvenille Emperor Limited
4.94 (150)
Local Trade Copier EA MT5 是一款快速、灵活的交易复制工具,用于在同一台 Windows 电脑或 Windows VPS 上的多个 MetaTrader 5 账户之间复制和管理交易。 它将本地交易同步与 Receiver 端的手数管理、风险管理、交易过滤、品种映射、交易管理和账户保护功能结合在一起。 只需约 1 分钟 即可完成 Transmitter 和 Receiver 终端的设置,并可在同一经纪商或不同经纪商的账户之间复制手动交易或 EA 交易。在合适的条件下,本地 MetaTrader 终端之间的交易信息可以在 0.5 秒以内 完成同步。实际交易执行速度取决于经纪商延迟、网络状况、电脑/VPS 性能以及终端负载。 购买前先试用免费演示版 您可以在 MT5 模拟账户上测试 功能完整的 Local Trade Copier EA MT5 免费演示版 ,每次可使用 4 小时 : 下载 Local Trade Copier EA MT5 免费演示版 将下载的文件放入: MT5 → 文件 → 打开数据文件夹 → MQL5 → Experts 然后重新启动 MT
TradePanel MT5
Alfiya Fazylova
4.88 (172)
交易面板是一款多功能交易助手。该应用包含超过50种手动交易功能,并允许您自动执行大多数交易任务。 应用程序说明 : https://www.mql5.com/zh/blogs/post/761102 用于模拟账户的应用程序试用版: https://www.mql5.com/zh/blogs/post/762579 如何安装应用程序: https://www.mql5.com/zh/blogs/post/762580 如何在可视化模式下测试应用程序: https://www.mql5.com/zh/blogs/post/770278 如何在VPS MetaTrader上安装应用程序: https://www.mql5.com/zh/blogs/post/770196 贸易. 只需单击一下即可执行交易操作: 打開掛單和頭寸,並自動計算風險。 一鍵打開多個訂單和頭寸。 打開訂單網格。 按組別關閉掛單和頭寸。 反轉頭寸方向(關閉買入>打開賣出,關閉賣出>打開買入)。 鎖定頭寸(通過開啟缺少的頭寸,使買入和賣出頭寸的數量相等)。 一鍵部分關閉所有頭寸。 將所有頭寸的止盈和止損設置在同一價格水平。
News Trade EA MT5
Konstantin Kulikov
4.55 (11)
在此向大家介绍一款我本人使用多年的机器人。该产品支持半自动和全自动交易模式。 >>> Chat <<< 本程序包含基于经济日历新闻的灵活交易设置功能。不支持策略测试器检验。仅可进行实际操作。 下載最新的設定檔: https://www.mql5.com/en/blogs/post/747929 訊號監控: https://www.mql5.com/en/signals/author/test-standart 请参考博客中各类参数说明自行实现个性化设置   : https://www.mql5.com/en/blogs/post/748545   。 主要默认设置说明 单一图表英镑/GBP(英镑美元/GBPUSD、欧元英镑/EURGBP、英镑日元/GBPJPY、英镑加拿大元/GBPCAD、英镑澳大利亚元/GBPAUD、英镑瑞士法郎/GBPCHF)货币对操作。英镑/GBP是波动性最大的货币,能够为用户顺利完成交易提供更多机会。 Use_Symbols_from_Line = true; Symbols_Line = GBPUSD, EURGBP, GBPJPY, GBPCAD, GB
按照自己的交易规则复制 Telegram 信号 Telegram to MT5 Signal Trader 可将 Telegram 公开及私密频道和群组中的文字交易信号自动复制到 MetaTrader 5。通过一个桌面应用管理多个信号提供者和 MT5 账户,并为 每个提供者单独设置风险和交易参数 。 复制信号无需 Telegram 机器人,也无需配置 API。 只需通过手机号或二维码登录您自己的 Telegram 账户,然后选择您已加入的频道或群组。您无需创建机器人,也无需提供 Telegram API 令牌、API ID 或 API hash。 自行选择仓位大小,将平仓分配到多个止盈价位,并自动执行保本止损和移动止损。在跟随信号提供者的同时,掌握信号的实际交易方式。 本产品由这款 MT5 EA 和必须配合使用的 Windows 桌面应用组成。请参阅 安装指南及应用下载 。 管理多个信号提供者和账户 为每个提供者单独设置: 为每个频道设置专属的仓位计算方式、入场规则、止损、止盈和交易管理参数。 灵活分配至不同账户: 将同一提供者的信号复制到多个已连接的 MT5 账户,并为每个账户使用不
================================================================================ POC BREAKOUT - V20.72. Full Professional Grade Toolkit ================================================================================ POC Breakout is a full MetaTrader 5 trading dashboard for discretionary traders who want breakout signals, Point of Control (POC) context, volume profiles, order flow, market structure, news, alerts, and advanced trade planning in one professional workspace. Attached directly to you
Exp COPYLOT CLIENT for MT5
Vladislav Andruschenko
3.97 (35)
适用于 MetaTrader 5 的专业交易复制器 快速、专业、稳定可靠的 交易复制器 ,适用于 MetaTrader 。 COPYLOT 可在 MT4 和 MT5 终端之间复制 Forex 交易,并支持 Hedge 和 Netting 账户。 COPYLOT 的 MT5 版本支持: - MT5 Hedge → MT5 Hedge - MT5 Hedge → MT5 Netting - MT5 Netting → MT5 Hedge - MT5 Netting → MT5 Netting - MT4 → MT5 Hedge - MT4 → MT5 Netting MT4 版本 完整说明 + DEMO + PDF 如何购买 如何安装 如何获取日志文件 如何测试和优化 Expforex 的所有产品 您也可以将交易复制到 MT4 终端(MT4 → MT4,MT5 → MT4): COPYLOT CLIENT for MT4 COPYLOT 是一款专业的交易和持仓复制器,可同时与 2、3 甚至 10 个终端协同工作。 支持从 模拟账户和投资者账户 复制,也支持同时在多个终端上运行。 您可以使
The product will copy all telegram signal to MT5 ( which you are member) , also it can work as remote copier.  Easy to set up, copy order instant, can work with almost signal formats, image signal,  s upport to translate other language to English Work with all type of channel or group, even channel have "Restrict Saving Content", work with  multi channel, multi MT5 Work as remote copier: with signal have ticket number, it will copy exactly via ticket number. Support to backtest signal. How to s
EA Overfitter
Stephen J Martret
5 (3)
回测看起来很漂亮。但它明天、下周、下个月还能继续赚钱吗? EA Overfitter 让您的 EA 在 100 段它从未见过的价格历史上重新运行。一个分数告诉您这个优势是否真实。 回测告诉您的,是 EA 在某一段价格历史上的表现——那段恰好发生过的历史。您无法从中判断,这个结果有多少来自策略本身,又有多少只是那一条特定路径带来的。 EA Overfitter 回答的正是这个问题。它构建最多 100 段您的 EA 从未交易过的合成价格历史,让策略在全部这些历史上重新运行,并展示它所产生的完整结果区间。您得到的不再是一条幸运或不幸路径上的单个数字,而是一幅真实的图景:策略在陌生数据上多久能赚钱、典型结果是什么样(而不是最好的那一次),以及您的回测离它有多远。 这些世界是由您自己的近期历史重建而成,因此这不是预测——任何从历史数据出发的检验都不可能是预测。它告诉您的是:这个优势是否依赖于价格的某一种特定排列,以及回测数字距离典型结果有多远。在投入资金之前,这才是值得回答的问题。 三个步骤 1. 构建。在图表上选择时间区间和世界数量,然后按 Build。EA Overfitter 会
Power Candles 策略扫描器——自优化多符号设置查找器 Power Candles策略扫描器 采用与Power Candles指标相同的自优化引擎,可同时扫描您“市场观察”中的所有交易品种。一个面板即可显示当前哪些品种在统计上具备交易价值、每种策略的最佳应用方向、最优止损/止盈组合,并在新信号触发时立即向您发送提醒。 本工具是 Stein Investments 生态系统的一部分 - 18+ 款工具,加上 Max,您的一对一 AI 交易导师。  随时在线,深入了解每一款指标,在您需要梳理思路的那一刻就在那里。  立即认识他: https://stein.investments 您的全面市场监控。每个交易品种超过3,000次自动优化。2种警报类型。一键切换图表并采取行动。 为何您需要此工具 大多数多标的扫描器仅展示价格 波动 。每只股票的波动率、百分比变化、RSI。您仍需自行摸索正确的策略、合适的止损位以及理想的入场阈值。Power Candles策略扫描器针对每只股票自动解答这些问题,仅在数学验证过的交易设置中触发实际入场信号时才会向您发出提示。这就是全部卖点。 自动
Telegram To MT5 Ultra
Mirel Daniel Gheonu
5 (5)
Telegram To MT5 — 信号复制器 将您的 Telegram 频道中的交易信号变成真实的 MT5 订单 — 自动执行,可用于任意数量的账户,风险与规则完全由您掌控。 Telegram To MT5 将您已在 Telegram 关注的 VIP / 信号频道连接到您的 MetaTrader 5 终端。一个免费的配套桌面应用读取消息(即使是禁止机器人的频道),而本 EA 在您的账户上执行这些信号 — 应用您自己的风险设置、品种映射、止盈处理、交易时段与新闻过滤。 它是一个信号复制器,而非黑箱策略:由您决定信任哪些频道,以及每笔交易如何计算手数和管理。 分步设置与配套应用安装指南 工作原理 [您的 Telegram 频道] -> [配套桌面应用] -> [MT5 + 本 EA] -> 订单 配套桌面应用(免费,已包含)使用您的 Telegram 账户登录并监视您所选择的频道。即使是禁止机器人的 VIP 频道也能正常工作,它通过一个私有、加密的本地桥接转发每条消息。 本 EA 挂在一个图表上,在 MT5 接收这些信号,并按照您的规则开仓 / 管理交易。 应用与 EA 之间的连接是位于
Timeless Charts
Samuel Manoel De Souza
5 (9)
Timeless Charts is an all-in-one trading utility for professional traders. It combines custom chart types such as Seconds Charts and Renko with advanced order flow analysis using Footprints , Clusters , Volume Profiles , VWAP studies, and anchored analysis tools for deeper market insight. Trading and position management are handled directly from the chart through an integrated trade management panel , while Market Replay and Virtual Accounts provide environments for practicing trading skills and
Telegram to MT5 Coppy
Sergey Batudayev
5 (10)
Telegram 到 MT5: 终极信号复制解决方案 使用 Telegram 到 MT5 简化您的交易,这款现代化工具可直接从 Telegram 频道和聊天室复制交易信号到您的 MetaTrader 5 平台,无需 DLL 文件。这款强大的解决方案可确保精准的信号执行、丰富的自定义选项,节省时间并提高您的效率。 [ Instructions and DEMO ] 主要特点 直接 Telegram API 集成 通过电话号码和安全码进行身份验证。 通过用户友好的 EXE 桥轻松管理聊天 ID。 添加、删除和刷新多个频道/聊天以同时复制信号。 使用高级过滤器进行信号解析 跳过包含异常词(例如“报告”、“结果”)的不需要的信号。 支持灵活的 SL 和 TP 格式:价格、点数或点数。 自动计算指定点而不是价格的信号的切入点。 订单定制和灵活性 使用多种模式配置订单大小:固定手数、动态手数(% 风险)或特定符号手数。 使用信号数据或自定义参数调整 SL/TP。 设置滑点限制、挂单到期时间和重试参数,以实现无缝执行。 综合符号管理 排除特定符号或映射到特定经纪人的符号。 自定义信号和经纪商符号之间
MetaTrader 5 专业交易面板 —— 图表与键盘一键交易的高效控制中心 一款面向主动交易者的专业 Trading Panel,可让您比标准 MetaTrader 操作方式更快、更直观地完成开仓、平仓、修改、管理与控制。 这不是一个普通的小工具,而是一个为高频手动操作、仓位管理、挂单控制与利润管理而设计的完整交易工作台。 通过这套面板,您可以直接在图表上一键执行交易,通过键盘快速触发核心操作,并借助自动参数计算、图形提示、信息标签以及可视化管理功能,大幅减少重复性操作,让整个交易流程更加流畅、高效且专业。 使用我们的交易面板,您可以直接从图表上一键下单,执行交易操作的速度可比标准 MetaTrader 控件快约 30 倍。 全新高级版本现已推出: 使用 VirtualTradePad PRO SE 升级您的交易流程 — 适用于 MetaTrader 5 和 MetaTrader 4 的新一代专业交易面板。 MT4 版本 | 完整说明 + DEMO + PDF | 如何购买 | 如何安装 | 如何获取日志文件 | 如何测试与优化 | Expforex 的所有产品 为什么交易者会
Anchor Trade Manager
Kalinskie Gilliam
5 (8)
Your EAs cannot see each other, but Anchor can. Anchor gives you one place to coordinate your EAs, manage risk, and decide when trading is allowed. It works alongside the trading bots you already use without any changes to them. The Problem One EA opens a trade. Then another starts trading. The next thing you know, you wake up to multiple grids built across your account. Each EA may be doing exactly what it was designed to do, but together they can place far more risk on your account than you in
下一次更新 — 版本 2.52 即将推出![全新功能] 准备迎接 4 项重大新功能,全面提升您的市场分析能力与交易流程! 我们将通过 4 项全新功能,进一步提升市场分析水平,满足您的交易需求。现为您介绍: 1. TRADE OVERVIEW DASHBOARD 2. CONFLUENCE AT ZONE 3. STRONG & WEAK HIGH/LOW 4. OTE 1. TRADE OVERVIEW DASHBOARD 一个帮助您更轻松地了解整体市场状况的仪表盘,为您的交易决策提供参考指引,帮助您系统地分析市场并规划交易,所有信息尽在一个屏幕中。 多时间周期市场概览(Multi-Timeframe Market Overview) 更清晰地了解市场方向与价格结构 快速查看市场状况 为系统化市场分析和入场规划提供指引。 2. CONFLUENCE AT ZONE 当价格进入关键区域时……您将了解有多少项支持因素相互吻合。 关键区域是交易决策至关重要的地方。但仅仅是价格进入某个区域还不够。此功能可帮助您在入场交易前,识别相互吻合的因素,包括信号及其他相关因素,从而进行更全面的分析,并
VirtualTradePad PRO SE MT5 — MetaTrader 5 专业交易控制中心 VirtualTradePad PRO SE 是一款基于图表的高级交易面板,也是适用于 MetaTrader 5 的交易管理工作区。它专为希望获得更快执行、更清晰持仓控制、结构化交易管理、可视化价位规划,以及直接在图表上完成专业交易流程的交易者而设计。 这不仅仅是一个 BUY / SELL 面板。PRO SE 将手动交易、挂单、持仓管理、部分平仓、篮子利润/亏损控制、加仓均价层级、ATM 规则、信号监控、实时市场信息、策略测试器 (Strategy Tester) 流程以及面向 VPS 的运行方式整合到一个互相关联的界面中。 MT4 版本 | 完整说明和截图 | 如何购买 | 如何安装 | 如何获取日志文件 | 如何测试与优化 | Expforex 的所有产品 为什么交易者会选择这套面板 图表一键交易 ,并支持键盘快速操作 快速完成开仓、平仓、修改、反转、锁仓与部分平仓 深度控制仓位、挂单、总利润与风控逻辑 自动参数计算,减少手动输入与重复劳动 为什么 PRO SE 比标准手动交易更高
Trade Indicator Assistant   is a powerful MT5 utility designed to turn indicators into automated trading systems. Its main feature is the ability to automatically detect an indicator’s   BUY and SELL signal buffers , without requiring you to know the buffer numbers, search through indicator settings, or modify the indicator source code. Bonus Indicator:   After purchasing Trade Indicator Assistant, contact me to receive   Trade Signal Pro   completely free as a bonus indicator. [Download Demo V
EA Auditor
Stephen J Martret
5 (7)
EA Auditor is an independent analysis tool for traders evaluating Expert Advisors and trading signals on MetaTrader 5. It audits backtest reports, reviews posted developer signals, and cross-verifies the two against each other to help traders assess strategies before committing capital. The MQL5 market offers a wide range of Expert Advisors from many developers, with varying approaches, quality, and transparency. EA Auditor provides a consistent, data-driven framework for reviewing them, answer
Trade Manager DaneTrades
Levi Dane Benjamin
4.13 (31)
交易管理器可帮助您快速进入和退出交易,同时自动计算风险。 包括帮助您防止过度交易、报复性交易和情绪化交易的功能。 交易可以自动管理,账户绩效指标可以在图表中可视化。 这些功能使该面板成为所有手动交易者的理想选择,并有助于增强 MetaTrader 5 平台。多语言支持。 MT4版本  |  用户指南+演示 交易经理在策略测试器中不起作用。 如需演示,请参阅用户指南 风险管理 根据%或$自动调整风险 可选择使用固定手数或根据交易量和点自动计算手数 使用 RR、点数或价格设置盈亏平衡止损 追踪止损设置 最大每日损失百分比,在达到目标时自动平仓所有交易。 保护账户免遭过多提款并阻止您过度交易 最大每日损失(以美元为单位)在达到目标时自动关闭所有交易。 保护账户免遭过多提款并阻止您过度交易 一键实现所有交易的盈亏平衡 自动计算从手机/电话发送的交易的风险 OCO 在设置中可用 交易和头寸管理 通过设置每月、每周、每天、每小时或每分钟的最大交易次数,停止过度交易和报复性交易。 高级挂单管理。 调整何时关闭挂单的规则 追踪挂单 支持市价订单和挂单 每日最大利润目标(以美元为单位)以确保头寸并停止
MT5 to Telegram Signal Provider 是一个易于使用且完全可自定义的工具,它允许向 Telegram 的聊天室、频道或群组发送 指定 的信号,将您的账户变为一个 信号提供商 。 与大多数竞争产品不同,它不使用 DLL 导入。 [ 演示 ] [ 手册 ] [ MT4 版本 ] [ Discord 版本 ] [ Telegram 频道 ]  New: [ Telegram To MT5 ] 设置 提供了逐步的 用户指南 。 不需要了解 Telegram API;开发者提供了您所需的一切。 关键特性 能够自定义发送给订阅者的订单详情 您可以创建分层的订阅模型,例如铜、银、金。其中金订阅获得所有信号等。 通过 id、符号或评论过滤订单 包括执行订单的图表截图 在发送的截图上绘制已关闭的订单,以便额外核实 延迟发送新订单消息的可能性,以便在发送前对位置进行调整 订单详情完全透明: 新的市场订单*带截图 订单修改(止损、获利) 已关闭的订单*带截图 部分关闭的订单** 新的挂单 修改的挂单(进场价格) 挂单激活(作为新的市场订单附加) 已删除的挂单 历史订单报告
RETAILBERG FOOTPRINT CHART PRO — Order-Flow Workspace for MetaTrader 5 Version 7.00  |  Professional System  |  31 tools  |  One chart A full 150-page illustrated User Manual is included. Please read the full manual to understand this feature packed footprint chart elements and ui. https://www.mql5.com/en/blogs/post/777982 DEMO / STRATEGY TESTER — PLEASE READ FIRST
Trader Evolution
Siarhei Vashchylka
5 (7)
" Trader Evolution " - A utility designed for traders who use wave and technical analysis in their work. One tab of the utility is capable of money management and opening orders, and the other can help in making Elliott wave and technical analysis. Manual (Be sure to read before purchasing) | Version for MT4 Advantages 1. Trading in a few clicks. Immediate and pending orders are available in the panel 2. Money management. The program automatically selects the appropriate lot size 3. Simplifies
DrawDown Limiter
Haidar Lionel Haj Ali
5 (23)
DrawDown Limiter v5.0 — 高级账户保护控制器 DrawDown Limiter v5.0 是一款运行于客户端的交易账户保护控制器,用于监控您的交易账户,并在达到您所设定的风险、盈利、新闻、时间计划、Rollover 或持仓数量限制时自动采取相应措施。 它可以通过一个独立图表监控 手动交易、自动化策略、多个 EA、挂单以及浮动持仓 。它既可以保护整个交易账户,也可以通过 Magic Number 仅监控特定 EA 或一组 EA。 DrawDown Limiter 的目的不仅仅是显示回撤,而是 主动执行您设定的交易规则 ,并在保护条件保持有效期间持续执行这些规则。 DrawDown Limiter v5.0 不仅用于监控您的亏损程度,还用于控制策略何时可以继续运行、哪些风险敞口可以保留、何时必须停止交易,以及自动化交易环境何时可以安全恢复运行。 需要帮助或有任何问题?  请查看   DrawDown Limiter 用户指南 我是  Lio ,欢迎随时联系我!  我们始终愿意为您解答问题、提供帮助并持续改进产品。 统一的保护系统 DrawDown Limiter v
RS Trade Copier - 超快 本地跟单系统,配备 真正的 图形界面。别再手动输入账号了。告别200多个晦涩的参数设置。 一款可靠且灵活的工具,用于在 MT5 和 MT4 多个终端之间复制交易操作。适合专业交易员、信号服务商以及个人投资者使用。能够以高精度和低延迟将一个或多个信号源(Provider)的 交易操作同步 到一个或多个接收端(Client)。支持简单自动配置和高级手动设置。不会干扰手动或其他 EA 开的订单。完全 在 MT5 本地运行 ,无需第三方服务器。 RS Trade Copier 与其他解决方案的对比 RS Trade Copier 其他解决方案 设置 可视化分步向导。 设置大约需要 1 分钟。 200 多个晦涩的输入参数。 设置大约需要 20 分钟。 速度 异步交易操作。 批量平仓 50 个头寸仅需 ~1 秒。 缓慢的顺序执行。 批量平仓 50 个头寸需要约 25 秒。 界面 真正的图形界面,支持 11 种语言的工具提示。 无需手册即可上手。 EA 属性中“输入参数”选项卡下的长长参数列表。 需要阅读所有文档。 批量操作 完全支持。 接收端上的批量平仓瞬
Trade Dashboard MT5
Fatemeh Ameri
4.94 (135)
疲于复杂的订单下达和手动计算?Trade Dashboard 是您的解决方案。凭借其用户友好的界面,订单下达变得轻而易举,只需点击一下,您就可以开设交易、设置止损和止盈水平、管理交易手数,并计算风险回报比,让您只需专注于您的策略。告别手动计算,使用 Trade Dashboard 简化您的交易体验。 立即下载演示版本 。 您可以在这里找到仪表盘功能和特性的详细信息 。 加入 Telegram 频道 。 购买后请给我发消息以获取支持。如果您需要添加更多功能,可以在产品的评论区留下您的想法,我愿意听取任何建议,希望您能在使用我的产品时获得最佳体验 。 这是 MT4 版本。 风险管理:使用 Trade Dashboard,可以将您的风险设置为账户余额或权益的百分比,或将风险设置为总金额。在图表上直观地定义您的止损,让工具准确计算每个货币对的适当手数。该工具还可以根据您期望的风险回报比自动设置止盈水平。它甚至可以在手数计算中涵盖佣金和点差费用。此外,您的止损和止盈可以转变为虚拟水平,隐藏于经纪商。通过 Trade Dashboard 的高级风险管理功能,掌控风险,保护您的资本。 交易线
图表交易助手与风险管理面板 功能全面的图表级交易工具:支持多模式止损(SL)和止盈(TP)(ATR、风险收益比R:R、点数、账户货币)、实时分析和财经日历 Ergotick Trade Manager 是一款专为主观交易员、自营挑战交易员和剥头皮交易员打造的多合一专业交易面板。它将瞬时自动手数计算、多模式止损止盈设置、高级一揽子订单(Basket)管理、实时账户统计以及集成的财经新闻日历融为一体,提供单一、清爽的 MetaTrader 5 交互界面。 告别手动计算仓位大小!在毫秒级内自动计算出精准手数,立即执行带风险管理的订单,并通过内置的每日亏损限制保护来捍卫您的资本安全。 核心功能 1. 交互式视觉工具与手数自动计算器 图表拖拽设置(Drag & Drop): 在入场交易前,直接在图表上拖放和调整入场线、止损(SL)、止盈(TP)、保本(BE)、移动止盈1(TP1)和移动止盈2(TP2)线条。 自动手数计算器: 根据您的 账户风险百分比(%) 或 固定美元风险($) 立即计算出精确的仓位大小;或者输入 固定手数 来自动反向计算您的美元风险。 内置风险计算与 ATR 仓位管理: 支持
作者的更多信息
SignalX Account Pulse MT5
Ahmed Ismail Muhammad Ismail Al Talhat
What this is A free single-strip readout of the numbers that decide whether an account survives a bad hour: equity, free margin, margin level with a colour state that warns before the margin call, floating profit and loss, and the current spread measured against its sixty-bar average. It takes no decisions for you and it is free on purpose. What it does Free strip showing equity, free margin, margin level with margin-call colouring, floating P/L, open position count and current spread against it
FREE
SignalX Account Pulse
Ahmed Ismail Muhammad Ismail Al Talhat
What this is A free single-strip readout of the numbers that decide whether an account survives a bad hour: equity, free margin, margin level with a colour state that warns before the margin call, floating profit and loss, and the current spread measured against its sixty-bar average. It takes no decisions for you and it is free on purpose. What it does Free strip showing equity, free margin, margin level with margin-call colouring, floating P/L and current spread against its 60-bar average. Fre
FREE
Gold Apex EA MT4
Ahmed Ismail Muhammad Ismail Al Talhat
# Gold Apex EA **Gold Apex EA** 是一款专为 MetaTrader 4 平台开发的先进自动化智能交易系统(Expert Advisor),专门针对黄金(XAUUSD)在 1 分钟图表上的高频剥头皮交易和动量执行而设计。该系统旨在通过系统化规则和严格的风险控制,应对贵金属交易中固有的快速价格行为和流动性变化。 ## 核心交易策略 该系统基于超短期算法框架运行,旨在捕捉低时间框架上的清晰定向动量: * **M1 动量分析:** 扫描 1 分钟图表上的传入tick和K线数据,以检测突发的动量扩张和流动性转变。 * **波动率过滤:** 集成了平均真实波幅(ATR)波动率门槛,以滤除低幅、震荡的市场阶段,确保仅在活跃的市场条件下建仓。 * **严格的止损纪律:** 每个订单在执行时即带有预定义的止损和止盈,防止出现未对冲的敞口或失控的回撤。 * **无网格或马丁格尔:** 完全依赖具有清晰风险边界的单一、独立交易执行,而不是恢复或平均化方法。 ## 核心优势 * **专业优化:** 专为 M1 时间框架上 XAUUSD 的价格动态和波动特征量身定制。
SignalX Session Breakout
Ahmed Ismail Muhammad Ismail Al Talhat
SIGNALX SESSION BREAKOUT MetaTrader 4 终极机构级价格行为与区间映射指标 产品概述与市场优势 欢迎使用 SignalX Session Breakout —— 专为专业交易者、算法开发者和价格行为专家打造的顶级技术分析解决方案,在 MetaTrader 4 上提供绝对的数学精度。 在现代金融市场中,早期区间盘整(如亚洲流动性区间或伦敦开盘前的建仓期)期间的机构足迹识别,决定了整个交易日的主要方向动能。散户交易者经常苦于手动划线、不同经纪商的时区差异以及搞乱执行区域的杂乱图表。 SignalX Session Breakout 完全自动化了这一工作流程。它能够瞬间锁定机构开盘区间,构建动态突破偏移通道,并将干净、不干扰视线的结构区直接投影到您的实时图表上。无论您交易的是外汇主要货币对(EURUSD、GBPUSD、USDJPY)还是黄金(XAUUSD)等贵金属,该指标都能为您提供捕捉高概率动能爆发所需的机构级优势。 核心架构优势 自动化机构区间计算: 瞬间计算并投影任意自定义时间窗口在历史交易日中的绝对最高价和最低价,无需手
SignalX Trade Panel
Ahmed Ismail Muhammad Ismail Al Talhat
What this is An on-chart control panel for manual MT4 trading. Instead of typing a lot size and hoping it is right, you set a risk percent once and every button on the panel sizes the position from your stop distance and the symbol tick value. What it does On-chart BUY/SELL buttons that size the position from a risk percent, plus CLOSE ALL and BE ALL. Interactive chart panel with risk-based sizing; no dependency on any indicator. Runs as an Expert Advisor attached to a single chart. No DLL calls
SignalX ATR Stop Planner
Ahmed Ismail Muhammad Ismail Al Talhat
What this is A planning tool that projects a volatility-based stop and target onto the chart and tells you the lot size that a fixed risk percent implies at that distance. Useful before you commit to a trade, and useful for building the habit of sizing from risk rather than from feeling. What it does Draws ATR-based stop and target levels and shows the lot size for a fixed risk percent. Volatility-adaptive stop projection drawn live on the chart. Runs as an Expert Advisor attached to a single ch
SignalX Break Even Guardian
Ahmed Ismail Muhammad Ismail Al Talhat
What this is A trade manager that works in R multiples. Once a position reaches a chosen R multiple it protects the trade, optionally takes partial profit, and only then starts trailing. It never opens trades. What it does Moves stops to break-even at a chosen R multiple, optionally takes a partial close, then trails. R-multiple driven management rather than fixed pip triggers; partial-close state persisted globally. Runs as an Expert Advisor attached to a single chart. No DLL calls. No external
SignalX Daily Risk Guard
Ahmed Ismail Muhammad Ismail Al Talhat
What this is An account-level circuit breaker. It watches the day's closed results plus floating profit and loss, and when a daily loss limit or a maximum trade count is reached it can stop new orders on the panel and flatten what is open. What it does Stops the day when a loss limit or a max-trade count is reached, and can flatten open positions. Account-level daily circuit breaker computed from closed history plus floating P/L. Runs as an Expert Advisor attached to a single chart. No DLL calls
SignalX Spread Monitor
Ahmed Ismail Muhammad Ismail Al Talhat
What this is A small on-chart readout of current spread, with a warning threshold, a colour state and an optional countdown to the next candle. Spread is a cost that most EAs and most manual traders simply do not measure. What it does Live spread versus 60-bar average, current session bucket, and seconds to the next bar close. Combines spread context, session awareness and bar timing in one compact panel. Runs as an Expert Advisor attached to a single chart. No DLL calls. No external services. N
SignalX Trade Journal Export
Ahmed Ismail Muhammad Ismail Al Talhat
What this is Writes your closed trade history to a CSV file on a timer or every tick, including commission and swap, with a totals row at the end. The point is a clean spreadsheet you can actually analyse offline instead of screenshots. What it does Writes the full closed-trade history to a CSV with a totals row, on a timer or every tick. Clean spreadsheet output including commission, swap and a computed total. Runs as an Expert Advisor attached to a single chart. No DLL calls. No external servi
SignalX Session Range Levels
Ahmed Ismail Muhammad Ismail Al Talhat
What this is Draws the high and low of a configurable session window together with the recent range history, so the levels that price has repeatedly reacted to are visible without hand-drawing them every day. What it does Marks the high and low of a configurable session for the last N sessions as extending levels. Historical session ranges kept as live trend lines, configurable wrap-around sessions. Runs as an Expert Advisor attached to a single chart. No DLL calls. No external services. No netw
SignalX Exposure Lens
Ahmed Ismail Muhammad Ismail Al Talhat
What this is Most multi-pair traders think in positions, not in currencies. Three long EURUSD trades and one short EURJPY feel diversified, but the book is really one large long EUR position. Exposure Lens opens every trade, splits it into its base and quote leg, nets every leg of the same currency together, converts the result into your account currency and shows what share of your equity each currency actually represents. What it does Nets every open position into per-currency long/short expos
SignalX Order Session Guard
Ahmed Ismail Muhammad Ismail Al Talhat
What this is Pending orders left overnight and positions carried through the weekend are two of the most common ways a planned trade turns into an unplanned risk. This utility handles the clock for you: it cancels pending orders that have been sitting for longer than you allow, closes everything at a session end time you choose, and forces a cut-off before the Friday close. What it does Expires stale pending orders, flattens all positions at a chosen session end time, and forces a Friday cut-off
SignalX Range Compression Scanner
Ahmed Ismail Muhammad Ismail Al Talhat
What this is Ranges compress before they expand. This indicator finds the bars where the Bollinger band width is in the lowest percentage of a lookback window and where the compression has lasted for a minimum number of bars, then draws each zone as a box with the upper and lower breakout levels extended to the right and the box height in points. What it does Marks historical squeeze zones where Bollinger width sits in the lowest x% of the lookback, boxes each run, extends the two breakout level
SignalX Volatility Regime Gauge
Ahmed Ismail Muhammad Ismail Al Talhat
What this is An ATR value of 12 points means very different things on EURUSD H1 and on gold M5. This indicator turns ATR into a percentile: the current ATR is ranked against the previous bars, and the result is plotted on a 0 to 100 scale with four bands. 20 means the market is quieter than 80 percent of the recent past; 90 means it is near the most volatile reading of the window. What it does Plots the percentile rank of ATR over a lookback window as a 0-100 oscillator with LOW / NORMAL / ACTIV
SignalX Currency Strength Meter
Ahmed Ismail Muhammad Ismail Al Talhat
What this is A currency is not strong or weak on its own; it is strong or weak against the others. This dashboard builds one score per major currency by measuring the change of every pair that currency appears in and crediting the base side with that change while debiting the quote side by the same amount. Averaging those credits gives eight numbers that can be compared directly. What it does Builds one strength score per currency from the change of every pair it appears in, and ranks all eight
SignalX Daily Range Envelope
Ahmed Ismail Muhammad Ismail Al Talhat
What this is Every symbol has a typical day. When a symbol has already travelled most of that distance, the rest of the day usually holds less, and a breakout strategy that works on a fresh day can stall on a spent one. This indicator measures the average daily range from history and projects half, three quarters and all of it above and below today open, so the scale of the current move is obvious at a glance. What it does Measures the average daily range over N days and projects 50%, 75% and 10
SignalX Hourly Range Stats
Ahmed Ismail Muhammad Ismail Al Talhat
What this is Not every hour of the trading day moves the same amount, and the difference matters: a breakout at a dead hour is far more likely to fail than the same setup during the session when the symbol actually travels. This indicator averages the high-low range of each hour of the server day over a number of days and shows all twenty-four hours as a ranked table. What it does Averages the high-low range of every hour of the server day over N days and ranks all 24 hours with a bar and a perc
SignalX Level Alert Grid
Ahmed Ismail Muhammad Ismail Al Talhat
What this is Watching several charts for a handful of price levels is a poor use of attention. This tool watches the levels for you. You type a list such as 1.0850;1.0900;EURUSD 1.2700 into one input, and it alerts when price approaches, touches or crosses each level. Every level fires once, so an alert means something happened rather than repeating all day. What it does Watches a list of price levels, on one symbol or several, and alerts on approach, touch and cross, each firing once per level.
SignalX Margin Buffer Guard
Ahmed Ismail Muhammad Ismail Al Talhat
What this is When margin runs low, the broker closes whatever it decides to close, usually the largest position and usually at the worst moment. This utility acts before that point with two stages: an alert at a warning level you set, and then an orderly close of the least profitable position once a lower level is reached, pausing between closes and stopping as soon as margin recovers. What it does Warns at one margin level and starts closing the least profitable position, one at a time with a c
SignalX Pending Order Grid
Ahmed Ismail Muhammad Ismail Al Talhat
What this is Placing a ladder of pending orders by hand is slow and error-prone, and one mistyped lot size turns a plan into an accident. This tool builds the whole ladder in one action: a fixed number of levels per side, a fixed distance between them, one lot size, and optional stop loss and take profit in points. Before anything is sent it draws exactly where the orders would sit, and it only places them when you set the arming input to true. What it does Places a symmetric ladder of buy-limit
SignalX Pivot Levels
Ahmed Ismail Muhammad Ismail Al Talhat
What this is Pivot levels give a reference frame for the day without any indicator clutter: where the previous period balance sits, and where the likely support and resistance are. This indicator draws daily, weekly and monthly pivots at once, in classic, Fibonacci, Camarilla or Woodie form, labelled with their prices. What it does Draws daily, weekly and monthly pivots at once in one of four methods: classic, Fibonacci, Camarilla or Woodie. Three timeframes of pivot structure in one tool with t
SignalX Prop Challenge Tracker
Ahmed Ismail Muhammad Ismail Al Talhat
What this is Evaluation accounts are scored on rules, not on feelings, and the rules are unforgiving in one direction: a profit target is a goal, but a daily loss limit or a maximum drawdown is a hard stop. This tracker keeps all three numbers on the chart at once, measured from the starting balance you enter, so the distance between where the account is and where it is allowed to go is always visible. What it does Tracks profit-target progress, worst daily loss and worst total loss against the
SignalX Spread History Export
Ahmed Ismail Muhammad Ismail Al Talhat
What this is The spread you are quoted is a cost you pay on every trade, and most traders never measure it. This recorder samples the spread on a schedule, for one symbol or for everything in Market Watch, and appends it to a CSV file inside the terminal data folder. The result is a record you can open in a spreadsheet and use to compare hours, days and brokers. What it does Samples live spread on a fixed interval, one symbol or the whole Market Watch, and appends time / symbol / spread / ask /
SignalX Weekend Gap Detector
Ahmed Ismail Muhammad Ismail Al Talhat
What this is Weekend gaps are one of the few market events that can be measured exactly on your own chart. This indicator marks every gap between the Friday close and the Monday open, draws it as a zone, and reports what share of the recent gaps were filled and how long the fill took on average for this symbol. What it does Finds every weekend gap, draws it as a zone and reports what share of the last N gaps were filled and how many bars the fill took on average. Converts a folk belief into a pe
SignalX Basket Close Guard
Ahmed Ismail Muhammad Ismail Al Talhat
What this is Judging a set of open trades one ticket at a time hides the only number that matters to the account: the total. Five positions each slightly in the red can be a book that should be exited, and one large winner can be paying for four losers while every individual position still looks acceptable. This expert adds up the floating result of every position on the account, optionally filtered to one symbol or one magic number, and closes the whole basket when the combined figure reaches a
SignalX Correlation Offsetter
Ahmed Ismail Muhammad Ismail Al Talhat
What this is Two long positions in EURUSD and GBPUSD do not feel like one bet, but over any reasonable lookback they very often are: they are close to one larger trade carrying one larger risk, and the account is less diversified than the trade list suggests. This utility measures how closely the chart symbol has moved with each symbol already held open, and reduces the suggested lot for a new position when that price action is largely explained by something already in the book. It suggests a si
SignalX Margin Sizer
Ahmed Ismail Muhammad Ismail Al Talhat
What this is Every risk-based lot calculator answers the same question: how much can I lose if the stop is hit? That is not the constraint that binds on a leveraged account holding several positions at once. The binding constraint is margin, and it is invisible if you only size from stop distance. This utility reads the broker own contract specification and margin requirement for the symbol and tells you the largest position a chosen percentage of your free margin will support, so the size you a
SignalX Partial Close Ladder
Ahmed Ismail Muhammad Ismail Al Talhat
What this is Most traders either take the whole position off at one level or none of it, and both choices give up something: the first caps a runner, the second risks a winner turning into a loser. This expert closes a position in up to three tranches at R multiples you choose, so a trade can bank part of the move on the way and still keep a remainder open for the larger target. Risk is measured from the position own entry and stop loss, not from a separate input, so the ladder cannot drift out
SignalX Portfolio Heat Meter
Ahmed Ismail Muhammad Ismail Al Talhat
What this is A trader can believe they risk one percent per trade and still be carrying six percent of their equity in open risk, because six positions are open at once, or far more when some of those positions have no stop at all. This panel adds up the risk carried by every open position across every symbol, measured to its own stop loss, and expresses the total as one percentage of equity, with a per-symbol breakdown and a separate list of positions carrying open-ended risk. It is information
筛选:
无评论
回复评论