Advanced Momentum Candles

Advanced Momentum Candles:

  • Signals structure breaks to the Expert Advisor through a readable signal buffer.
  • Tunes swings, filters and momentum from an on-chart panel, with no reload.
  • Shades every candle in seven steps, from strong bullish to strong bearish.
  • Holds a separate settings line for each timeframe and applies it on that chart.
  • Softens short pullbacks inside a trend, so a pause does not read as a turn.
  • Marks breaks of structure and changes of character, with a line at the level.


When one chart becomes ten

You follow several symbols on several timeframes. Settings that read five minutes well are wrong on four hours, so each chart ends up tuned by hand, and after a week you are no longer sure which chart carries which values.

On top of that, an Expert Advisor of your own needs the same reading of momentum and structure. You end up describing in code what your eyes see on the chart, and the two never quite agree. That gap is where decisions go wrong.


One reading, kept in one place

Let the candle show how strong the move is, step by step, and let the chart mark where structure broke. Tune that reading on the chart while you watch it change. Write it down as one line per timeframe, so each chart always means the same thing. Then hand the very same signal to your Expert Advisor, so what you see and what your code acts on are one reading.


Advanced Momentum Candles

Seven shades of momentum

Momentum is measured with the relative strength index and drawn into each candle in seven steps. Above Strong Bullish Above (65) a rising candle takes the full bullish colour; below Strong Bearish Below (35) a falling candle takes the full bearish colour. Between those and Bullish Above (52) or Bearish Below (48) sit the ordinary bullish and bearish shades, and the middle is neutral.

A candle that closes against its momentum gets its own softer shade. A red candle inside bullish momentum then looks like a pause, not like a turn. All four thresholds are yours to set. You pick the two base colours, and the five shades between them are blended from those.


A tuning panel on the chart

The panel lists the momentum period, the price type, swing strength, signal confirmation, the minimum swing, the exhaustion veto and its period, and the counter-move settings. Click a row to step its value, and the chart is recalculated in place, without reloading the indicator.

Every change prints the complete settings line to the journal, ready to copy. The panel remembers its values for each chart, and you can show it in full, minimise it to its title with one click, or hide it from the inputs.


One settings line per timeframe

Five inputs each hold a settings line: five minutes, fifteen minutes, thirty minutes, one hour and four hours. When the chart's timeframe matches a line, that line sets the structure, momentum and colour-threshold values it carries.

Anything a line leaves out returns to its shipped default, so a pasted line always means the same configuration on every chart. A value outside its range is brought back into it and named in the journal, and a line captured on another timeframe or zoom is reported in the journal, never forced on the chart.


A signal buffer for your Expert Advisor

Each structure break writes +1 for up or -1 for down into buffer 8, on closed candles only, so your Expert Advisor reads it from shift 1 with the standard custom indicator call. When the indicator starts, the journal states the buffer layout and the chart it runs on.


Confirm Signal With
decides what reaches the buffer: every break, or only a break the candle's momentum agrees with. The colour buffer is published too, so your code can also read the shade of any closed candle.


Counter-move absorption

A short run of opposite candles inside a trend can look like a reversal that never came. With Absorb Counter-Moves enabled, such a run is shown in the trend's softer shade, but only when the trend encloses it on both sides, it stays inside the last trend extreme, it breaks no structure and it holds no outsized candle.

You set the longest run to absorb (8 bars) and the largest candle allowed in it (1.5 times the average range). It is off by default, it can be forced on so the panel cannot switch it, and it never changes a mark, a line or the signal buffer.


Alerts that reach your phone

In custom alert mode you choose pop-up, journal and phone push notification one by one, so a turn on a chart you are not watching still reaches you. Push uses the notifications set up in your terminal.

Alerts fire on closed candles only: entering a strong shade, a change of momentum side, or every shade change. The default is a pop-up with the terminal's alert sound and a journal line.


Chart bars in your colours

The chart's own candles are recoloured to your base colours, so nothing flashes through in the terminal's defaults while the indicator calculates. The change is made after your first click or key press on that chart, and your original colours are put back when you remove the indicator.


Structure breaks, marked and lined

Swings are confirmed with Swing Strength bars on each side (3, from 2 to 10), and a close beyond the last swing is a break: a break of structure with the trend, a change of character against it. Marks come in seven styles and five sizes, with a line from the swing to the breaking candle.


Filters for fewer breaks

Min Swing Size ignores swings under three times the average candle range, or none at 0. The Exhaustion Veto refuses a buy break above 80 or a sell break below 20 on a 14-bar stochastic, for reversals only by default.


A period that follows your timeframe

On Auto the momentum period is 7, 10, 14, 21 or 28 as the timeframe grows from one minute to monthly. Any of them can be set by hand, with the price it is measured on.


How to start

  1. Attach Advanced Momentum Candles to a chart, on any symbol and timeframe.
  2. Choose a Mark Style under Signal Marks; marks stay hidden until you do.
  3. Tune the reading on the panel, then paste the journal's settings line into the input for that timeframe.

You get one reading of momentum and structure, tuned per timeframe, shared by your charts and your Expert Advisor.

推荐产品
Trillion Pips Pro MT5
Sivaramakrishnan Natarajan
TRILLION PIPS ELITE PRO INDICATOR Advanced Wave-Based Auto Trend System Built with 12+ Years of Real Market Experience, this is not just an indicator — it is a complete market intelligence system designed to help traders identify key levels, understand auto trend direction, and read market movement with confidence. UNIQUE POWER OF THIS INDICATOR Proprietary Strategy – Only from Trillion Pips Advanced Wave-Based Market Structure Engine Auto Trend Detection System Built-in Trend Decider Log
BlackBox XAU
Enrique Van Rooyen
BlackBox XAU — 黄金高级智能交易系统 概览 BlackBox XAU 是一款经过精心设计的交易系统,旨在在黄金市场中获取利润,同时严格控制回撤。它并不会盲目追逐市场的每一次波动,而是采用一种有纪律、基于规则的方法,能够灵活适应波动性,只筛选出那些 高概率的交易机会 。 EA 会实时评估市场环境,过滤掉质量较低或不可靠的信号,并耐心等待风险与回报之间的平衡明显倾向于交易的一刻。一旦条件满足,系统便会以精准的入场点位执行交易,并根据市场变化动态调整保护措施。 这种谨慎的设计意味着 BlackBox 不会用大量交易充斥图表,而是注重 质量而非数量 —— 专注于具备统计优势的机会。对交易者而言,这转化为一种切实可行的方式,实现 稳定盈利、可控回撤和持续的风险调整后收益 ,而不依赖参数曲线拟合或脆弱的策略。 工作原理 BlackBox 的核心是对市场波动和趋势动态的持续监控,目的是捕捉只有在 潜在收益显著大于风险 时才会出现的最佳交易机会。 系统不会每天都开仓,它需要 耐心 等待具有统计优势的时刻。 当条件符合时,EA 会精准执行入场,并内置保护机制以保持回撤在可控范围内。 它的
MultiWay EA
PAVEL UDOVICHENKO
4.89 (19)
MultiWay EA 是一个智能高效的自动交易系统,基于强大的均值回归策略。通过在九个相关(甚至一些通常“趋势性”)的货币对上进行广泛的分散化交易 — AUDNZD、NZDCAD、AUDCAD、USDCAD、EURUSD、GBPUSD、EURCAD、EURGBP 和 GBPCAD — 它能够在强烈的单边走势后捕捉价格回归均值的机会。 购买后,请发送私人消息以获取完整的安装说明。 实时信号:  点击这里 当前价格 —   仅 $1937(限接下来的 10 位买家)。 MultiWay EA 非常适合那些重视简洁、稳定和清晰逻辑的交易者 — 无需复杂的设置,但具备灵活的资金管理和风险控制选项。 该智能交易系统遵循真正的“安装即忘”理念。它可以多年稳定运行,几乎无需用户干预,非常适合长期策略。 您可以将 MultiWay EA 作为账户的独立解决方案,或作为多元化投资组合中的重要组成部分。 只需将其附加到图表上,其余交给它完成。 MultiWay EA 的主要特点: 在运行过程中,EA 不仅考虑交易货币对的报价,还参考: 全球股市的波动情况 交易货币对基础货币的期货波
Market Markers EA
Tshepo Michael Motaung
This EA is sessions trading robot that allows you to trade the trading session of yours choice as it waits for market markers to make decision for the direction of the day before taking any trades. It has 3 entry signals that uses candle stick patterns, Moving Averages and Range Break to maximize profits and to take advantage of the trending market. The EA practices risk management and has the ability to grow account by risking certain percentage of your account(risk percentage) each time there
Trend Strength Visualizer
Alexander Denisovich Jegorov
Trend Strength Visualizer A Simple Tool for Trend Analysis This indicator helps you quickly assess the strength of market trends using fast and slow moving averages. It’s designed to give you a clear visual representation of the trend, so you can make better trading decisions. ~Displays: Green Line : Strong uptrend (potential buying opportunities). Red Line : Strong downtrend (potential selling opportunities). ~Values That Can Be Changed: Fast MA period. Slow MA period. Line color for uptrend an
Candlestick Patterns Scanner MT5
KEENBASE SOFTWARE SOLUTIONS
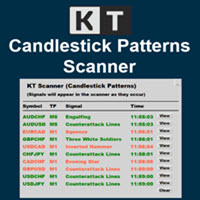
KT Candlestick Patterns Scanner is a Multi-Symbol and Multi-Timeframe scanner that fetches and shows various candlestick patterns on 28 currency pairs and 9 time-frames concurrently . The scanner finds the candlestick patterns by loading the KT Candlestick Patterns indicator as a resource in the background. Features The scanner can find the candlestick patterns on 252* combinations of symbols and time-frames from a single chart. Open the signal's chart loaded with a predefined template with a s
CISD Levels Pro automatically draws CISD Buy and Sell levels directly on your chart. It highlights pending levels while they are forming, then marks confirmed levels after the confirmation candle closes. Optional confirmation arrows help you spot the signal quickly. This tool is designed for traders who want clean, simple CISD level visualization without extra indicators or clutter. Key Features Draws Bullish (BUY) CISD levels and Bearish (SELL) CISD levels Shows Pending levels (dashed) and
CChart
Rong Bin Su
在外汇和金融市场中,快速反应和精准的决策至关重要。然而,常规的 MetaTrader 5 终端最低只支持 1 分钟图表,限制了交易者对市场波动的敏感度。为了解决这一问题,我们推出了全新的 秒级图表 K 线指标 ,让您在副图中轻松查看和分析 1 秒至 30 秒的市场动态。 主要功能 支持多种秒级周期 :该指标允许您选择以下周期,满足不同交易策略的需求: S1 : 1 秒 S2 : 2 秒 S3 : 3 秒 S4 : 4 秒 S5 : 5 秒 S10 : 10 秒 S15 : 15 秒 S20 : 20 秒 S30 : 30 秒 实时更新 :秒级图表将实时更新,确保您在每一刻都能获取到最新的市场信息,帮助您做出及时的交易决策。 用户友好的界面 :该指标在副图中显示,直观易用,您可以轻松切换不同的时间周期,快速分析市场走势。 适用人群 短线交易者 :适合高频交易和短线策略的交易者,通过秒级图表捕捉瞬息万变的市场机会。 技术分析师 :为技术分析提供更细致的数据支持,帮助您识别潜在的买入和卖出信号。 如何使用 将指标添加到您的图表上。 选择您希望观察的秒级时间周期。 实时监控市场动向,利用丰富
Aureum ORB Pro: Institutional-Grade Momentum Trading Aureum ORB Pro is a meticulously engineered algorithmic trading system designed to capitalize on the explosive momentum of the daily Opening Range Breakout (ORB). Specifically tailored for the high-liquidity volume shifts of the USDJPY currency pair, this Expert Advisor maps structural boundaries during the late Asian session and executes precise breakout entries as institutional order flow floods the market. Built for professional traders and
E2C Lines
Eduardo Cristian De Carvalho
Descubra o poder do nosso indicador de alta precisão, projetado para identificar as regiões de alvo e exaustão de qualquer ativo. Testado e validado por mais de 3 anos nos mercados de mini dólar e mini índice, ele oferece confiabilidade e eficácia incomparáveis. Transforme sua estratégia de trading e alcance novos patamares de sucesso com nossa ferramenta inovadora.
DoIt EA Monitor - Multi EA Performance Dashboard for MT5 Your account can be profitable while one EA quietly drags down the portfolio. MetaTrader history shows the combined result, but it does not clearly show which strategy deserves more capital and which one needs attention. DoIt EA Monitor runs on one chart and separates live and historical performance by magic number, EA and symbol. It is completely read-only. It never opens, closes or modifies a trade. KNOW WHICH EA IS EARNING ITS PLACE Aut
FREE
Fibonacci Sonar
Lorentzos Roussos
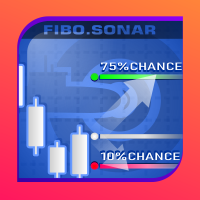
斐波那契声纳 斐波那契声纳有一个内部价格行为模式库,收集自 28 个符号和 7 个时间范围。 每个模式分为两面。前侧和后侧。斐波那契声纳使用前侧来识别相似的模式。最近的价格行为(任何时刻)直到最新条的开盘价是用作搜索库的前侧。 后侧保存每个模式所见的所有活动的汇总。这就是斐波那契术语的用武之地。从过去每个模式的所有实例的开盘价中,我们以斐波那契序列部署了开盘价上方和下方的价格水平。然后,我们测量了达到价格水平的次数。如果将达到价格水平的次数除以单个价格模式存在的实例数,则可以将其提取为百分比 (%) 当然,对于每个模式,您可以想象在顶部斐波那契价格和底部斐波那契价格上都有一个百分比。这允许使用给定百分比值来查找价格的方法。例如,使用此方法,我们可以要求达到 50% 的时间的水平,该方法将返回价格水平。 这些水平就是您在图表上看到的。虽然它们是由斐波那契价格范围与其发生可能性相结合而创建的,但它们并不位于与每个模式的开盘价之间的斐波那契距离。 这些水平的预定发生百分比为: 75% 50% 33% 10% 0% 其中有 5 个高于开盘价,5 个低于开盘价。这些水平并不围绕开盘价对
Multiple Positions MT5 Bot
Jomarch Marfil Asotigue
Kola Multi Trade — Position Manager MT5 Multi-Symbol Smart Scalping Engine — High-Speed, Multi-Market, Fully Automated TradingBuilt exclusively for MetaTrader 5, Kola Multi Trade is not just a position manager — it’s a complete automated trading system that scans multiple markets simultaneously, executes trades on precision signals, and manages your portfolio with speed and discipline. Engineered for scalpers and active traders who want continuous market coverage without being glued to the s
Zonar Smart Analysis
Elvin Entero Tomolin
**Zonar Smart Analysis** is a complete "Smart Money" trading system designed for MetaTrader 5. It automates the classic **Opening Range Breakout (ORB)** strategy while filtering false signals using advanced Price Action algorithms (Wick Rejection & Swing Analysis). Stop guessing where the session is going. Let Zonar draw the zones, identify the breakout, and highlight institutional Order Blocks for maximum confluence. ### Key Features * **Automated ORB Box:** Automatically detects the Market
ToolBox 360 is the swiss knife of all indicators. It is full packed with useful tools to help you with your trading. It can be used to find best entry and exit points and help you to decide if you should open a trade or not. It shows market trends, candlestick formations outside / inside bars and you can sett time based allerts. Main features: Time based Fibonacci lines Choose a start and end time and the indicator shows you Fibonacci lines within the selected time range including range high a
Overview TriParity AfterShock PRO Scanner 是一款用于 MetaTrader 5 的自主判断型仪表盘指标。在本说明中,triad 指三组货币对或三种交易品种之间的关系。Scanner 可在一个面板中查看多个 triad 和多个时间周期,并帮助交易者以更有条理的方式整理观察列表。其目的是减少图表过载、并排比较候选机会,并突出显示值得进一步关注的市场状态。 本产品并不执行三角套利。真正的三角套利需要几乎同时完成三条腿的执行、极低的延迟以及极低的交易成本。Scanner 旨在用于自主判断临时性偏离状态,这些偏离可能会在平价调整之后暂时保留下来。 Functions Scanner 会在多个时间周期上分析所选 triad,并通过 NOWCAST 显示当前状态。NOWCAST 会将形态评级为 A、B、C 或 NG。在这里,NG 表示当前状态并不适合。这些评级表示关注优先级,而不是最终的买入或卖出决定。最终确认应在 Catcher 或执行图表中进行。 7.0 版本为 MTF 单元格增加了更多信息。除评级外,面板还可以显示方向偏向、已接受信号标记、如 MR、T
MTF MultiMeter5
GRANTLEY LAURENCE CAUSE
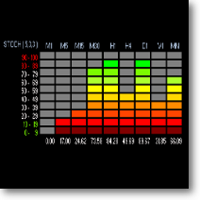
Benefits: A new and innovative way of looking across multiple timeframes and multiple indicators on any chart. Provides instant multi-timeframe analysis of any market. i.e. forex currency pairs, cryptocurrency pairs, commodities, etc. It offers precise indications across multiple timeframes of volatility as measured by RSI, ADX and STOCH within one chart. Helps you determine high probability trading setups. See example strategy in comments. Can see bullish/bearish volatility building across mult
CURRENCYPOWER NAVIGATOR MT5 Currency Strength Ranking Dashboard TAGLINE See the strongest and weakest currencies before choosing the pair. PRODUCT OVERVIEW CurrencyPower Navigator MT5 is a currency-strength indicator for MetaTrader 5. Instead of focusing on one chart only, it evaluates a basket of major Forex pairs and estimates the relative strength of individual currencies. The indicator then ranks the main currencies and helps identify stronger-versus-weaker combinations that may offer
FREE
Introduction to Fractal Pattern Scanner Fractal Indicator refers to the technical indicator that makes use of the fractal geometry found in the financial market. Fractal Pattern Scanner is the advanced Fractal Indicator that brings the latest trading technology after the extensive research and development work in the fractal geometry in the financial market. The most important feature in Fractal Pattern Scanner is the ability to measure the turning point probability as well as the trend probabil
Godfather mt5
Ivan Simonika
The intelligent algorithm of the Godfather indicator accurately determines the trend, filters out market noise and generates entry and exit levels. The indicator will help in finding entry points when analyzing the price chart. The program first receives a "snapshot" of the graph, then analyzes it. The results are reported to the trader in the form of signals. The main purpose of this indicator is to determine the moments of entries and exits from transactions, so the indicator displays only th
The indicator helps to enter a trade following the trend, at the same time, after some correction. It finds strong trending movements of a currency pair on a given number of bars, and also finds correction levels to this trend. If the trend is strong enough, and the correction becomes equal to the one specified in the parameters, then the indicator signals this. You can set different correction values, 38, 50 and 62 (Fibonacci levels) are better. In addition, you can set the minimum trend lengt
AlphaPulse Quant (脉冲动能反转系统) ​ 策略简介 ​AlphaPulse Quant 是一款专为捕捉市场机构洗盘及极端超买超卖拐点而设计的智能化量化交易系统。策略放弃了传统指标的滞后性跟随,转而采用多维动能脉冲算法,在趋势精疲力竭、散户疯狂追涨杀跌时逆向布局。配合独特的时间锁仓过滤器与绝对风控模型,旨在打造高逻辑容错率、低回撤的长期资产增值曲线。 ​ 核心技术优势 ​1. 脉冲动能拐点识别 ​系统内置双重动态频率感知器。当市场在短期内爆发不合理拉升或恐慌性抛盘,导致双重频率发生非线性偏离与交叉时,系统将其识别为“机构诱多/诱空”信号。EA 将在散户情绪最高昂的拐点果断进行反向伏击,实现真正的高胜率“摸顶吃底”。 ​2. 动态时间锁仓过滤器 ​频繁交易是爆仓的元凶。AlphaPulse 独创平仓冷却锁(Time-Lock)机制。当一笔交易获利结清或触及风控后,系统会自动对当前图表的时间周期进行“动态断层隔离”,强制进入冷静期。该技术能彻底阻断震荡行情中的连续扫损以及单边行情中的过早二次入场,让账户永远具备呼吸空间。 ​3. 绝对风险控制矩阵 ​本策略绝不在市
DYNAMIC TARGET AND SL MATRIX REAL-TIME FOREX DISTANCE ENGINE Stop guessing your SL and TP distance. Start measuring it. Dynamic Target and SL Matrix is a professional Forex analytical tool designed to calculate and display a dynamic distance framework for SL and TP planning directly from live market conditions. The engine continuously analyzes the current BID and converts the market state into a dynamic pip-distance reference, which is then expanded through a configurable multiplier matr
Online Accounts Manager MT5
Kyra Nickaline Watson-gordon
5 (1)
OneClick Online Account Manager is a powerful utility that helps you to manage all your accounts from a centralized panel. It is suitable for all single account traders and specially for multiple accounts traders. The utility help you to : Monitor status of all accounts on a private web page. Some information such as account connection status, account profit, DD, Balance, Equity, Margin Level, Number of positions and orders, Daily and Weekly profit/loss and also overall summation of all these p
Niubility Trend  Niubility Trend  displays the trend direction for all time frames in real time. You'll see at a glance at which direction the trends are running, how long they last and how powerful they are. All this makes it an easy-to-use trend trading system for beginners, advanced and professional traders. Features Easy to trade Customizable colors and sizes It is non-repainting and non-backpainting It is fantastic as a trailing stop method It implements alerts of all kinds
Xtrade Trend Detector
Dago Elkana Samuel Dadie
Xtrade Trend Detector is an indicator capable of finding the best opportunities to take a position in any stock market. Indeed, it is a great tool for scalpers but also for Daytraders. You could therefore use it to identify areas to trade, it fits easily on a chart. I use it to detect trends on Big timeframes and take positions on Small timeframes. Don't hesitate to give me a feedback if you test it.
Valid BOS Pullback
Brighton Mufaro Mudzingwa
Elevate Your Price Action Trading with the Valid BOS Pullback MT5 Indicator Master market structure and capture high-probability entries with the Valid BOS Pullback indicator. Designed specifically for professional traders, this algorithm filters out market noise by identifying genuine break-of-structure setups following a verified pull-back and retest of old levels. Whether you are trading major Forex currency pairs or specialized Synthetic Crash Indices that feature sudden spikes, this indicat
CV QuantMarketScreener Pro CV QuantMarketScreener Pro   is a professional multi-asset market screener for MetaTrader 5, developed for institutional-grade market analysis, rapid signal detection, and efficient multi-symbol trading. The screener combines modern market structure analysis, trend filters, volatility evaluation, and advanced visual signal technology in one powerful dashboard system. The integrated screener allows simultaneous monitoring of multiple markets such as: Forex Indices Metal
ZEUS-indi — Premium Multi-Timeframe Signal Indicator ( MQL5 LEGACY CHANNEL ) ZEUS-indi is a professional signal indicator for MetaTrader 5 that combines 9 internal indicators across 3 timeframes into a single, weighted decision system. Built for traders who value PRECISION over noise. KEY FEATURES Multi-Timeframe Scoring (Base + HiTF + HiTF2)    Real-time agreement percentage across three timefram
本指标是实践实战交易完善的波浪自动分析的指标 !  案例... 注: 波浪分级用西方叫法不习惯,因受到缠论(缠中说禅)命名方式习惯的影响,我是将基础波浪命名为 笔 ,将二级波段命名为 段 ,同时具有趋势方向的段命名为 主趋段 (以后笔记中都是这种命名方式,先告知大家),但是算法上和缠论关系不大切勿混淆.反映的是本人分析盘面总结的 千变万化纷繁复杂的运行规律 . 对波段进行了标准化定义,不再是不同人不同的浪  ,    对人为干扰的画法进行了排除,在严格分析进场起到了关键的作用 . 使用这个指标,等于将交易界面提升美感,抛弃最原始的K线交易带你进入新的交易层次.如果不是为了交易,在宣传上也将使客户观感提升层次. 指标内容: 1.   基础波浪 (笔) : 首先我们找出了价格波动过程中的基础波动拐点,当然他的有序性低,为下一步的计算提供基础. 2.   二级波段( 段 ) :在基础波浪的基础上,通过算法分析得到层级更明显的二级波段,二级波段为波浪提供了分析基础 3.   波浪( 浪 ): 有着更清晰的趋势,更清晰直观的方向.分析一个波浪是否延续,需要看二级波段的形态,分析二级的构成
该产品的买家也购买
Trend Sniper X
Sarvarbek Abduvoxobov
4.9 (41)
Trend Sniper X 是一款适用于 MetaTrader 5 的多周期趋势跟踪指标,可帮助交易者清晰精准地识别趋势方向和潜在的反转点。 适用于 MT4: https://www.mql5.com/en/market/product/193245 价格信息: 当前价格为促销价,随着后续更新和新功能的推出,价格可能会有所变动。 赠品优惠: 购买后联系作者,即可免费获取该指标的 Auto-Trade Assistant EA(自动交易助手 EA)。 Code2Profit 频道 通过多时间框架分析掌控市场! 如何使用 Trend Sniper X 最大化您的胜率:核心规则与交易时段技巧 技术规格 平台 MetaTrader 5 指标类型 多时间周期趋势指标 运行时间周期 任何图表时间周期,可独立选择更高的时间周期 (M1–MN1) 主要交易品种 外汇、黄金 (XAUUSD) 及其他差价合约 (CFD) 推荐账户 任何账户类型 可视化 彩色趋势蜡烛 (买入/卖出/微弱/变化) + 买入/卖出箭头 附加模块 交易时段方框 (悉尼、东京、伦敦、纽约) 主要功能 多时间周期趋势分析: 直接在
Entry Points Pro for MT5
Yury Orlov
4.52 (151)
传奇回归:Entry Points Pro 10。 这款传奇指标曾 3 年稳居 MQL5 Market 前三,如今全面重启。 数百条热情好评(两个版本合计 589 条),每天有数千名交易者用它交易,演示版下载 31,000+   MT4+MT5  次。 五年来我读过你们的每一条评价——在第 10 版里,我没有给出许诺,而是把答案直接做进了产品。指标作者自 1999 年入市, 珍视诚信、自己的声誉和自己的客户 。 Entry Points Pro 给出的入场信号严格不重绘。 而且这一次不再只是作者的一面之词,而是可验证的事实:确认信号只在 K 线收盘后标出,自动化测试记录到 零重绘 (在 EURUSD、XAUUSD 和 BTCUSD 上共 2,486,568 次不变量检查——0 次违规)。测试方法完全公开——您可以在策略测试器中自行复现。 购买后请务必第一时间给我发私信。 我会发给您 扩展版说明书《交易者圣经》 ——使用本指标交易的完整指南——并告诉您如何免费获得 赠品:市场扫描器 ,它能同时分析多个品种和多个时间周期,并在一个界面上显示 Entry Points Pro 此刻在哪里表现
Neuro Poseidon MT5
Daria Rezueva
4.75 (52)
Neuro Poseidon is a new indicator by Daria Rezueva. It combines precise trading signals with adaptive TP/SL levels - creating best possible trades as a result! Message me and get  Neuro Poseidon Assistant  as a gift to automize your trading process! What makes it stand out? 1. Proven profitability on all assets and timeframes 2. Only confirmed BUY and SELL signals present on the chart 3. Adaptive TP & SL levels generated by the software for each trade 4. Easy to understand - suitable for al
Adaptive Price Action Engine 买指标,免费送EA 自适应多时间框架趋势与K线形态智能分析系统 市场环境始终在变化,不同的市场阶段中,并非所有 Price Action 形态都具有相同的参考价值。 Adaptive Price Action Engine 旨在适应不断变化的市场条件,将 趋势结构、多时间框架分析、K线形态与统计优化 整合到一个统一的分析框架中。 两种自适应模式 Dual Alpha Trend Mode(双 Alpha Trend 模式) 自动搜索适合的 Alpha Trend 参数,并结合低周期与高周期市场结构,使指标能够根据近期市场行为动态调整趋势识别。 Candlestick + Alpha Mode(K线 + Alpha 模式) 将 Alpha Trend 市场状态与 22种多空K线形态 相结合。系统不会简单地对所有形态一视同仁,而是对不同的形态组合进行统计评估,并识别在特定市场环境下表现出更强历史统计特征的配置。 主要功能 趋势参数自动优化 多时间框架市场状态分析 22种多头与空头 Price Action K线形态 对数千种可能
Auto Optimized SpeedAngle 是一款机构级的动量向量化系统,通过持续的前瞻优化(Walk-Forward Optimization, WFO)彻底消除了曲线拟合(curve-fitting)。该指标没有采用在市场 状态转换时容易失效的静态输入参数,而是利用出样外验证(Out-of-Sample, OOS) dynamically 动态重新校准设置,从而确保显示的 信号代表真正的统计优势,而非历史巧合。 核心机构级架构 前瞻优化引擎(Walk-Forward Optimization Engine): 核心算法持续扫描数千种回溯周期(lookback)与阈值组合,严格将数据划分为样本内(in-sample)和样本外(out-of-sample)。只有当参数配置在未知数据环境中证明具备数学优越性时,系统才会对其进行 adoption。 量化目标函数(Quantitative Objective Functions): 优化引擎不一味追求绝对毛利,而是聚焦于机构级的稳定性指标。用户可针对系统质量数(SQN)、期望值(每笔交易的平均 R 倍数)或净 R 值进行优化,从而优
M1 Sniper MT5
Oleg Rodin
5 (7)
M1 SNIPER   是一款易于使用的交易指标系统。它是一个专为 M1 时间框架设计的箭头指标。该指标可以作为独立的系统在 M1 时间框架下进行剥头皮交易,也可以作为您现有交易系统的一部分使用。虽然该交易系统专为 M1 时间框架交易而设计,但它也可以用于其他时间框架。我最初设计此方法是为了交易 XAUUSD 和 BTCUSD。但我发现这种方法在其他市场交易中也同样有用。 指标信号既可以顺势交易,也可以逆势交易。我教授一种特殊的交易技巧,帮助您利用指标信号进行双向交易。该方法基于使用特殊的动态支撑位和阻力位区域。 购买后,您可以立即下载 M1 SNIPER 箭头指标。此外,我还为所有 M1 SNIPER 工具用户免费提供下方屏幕截图所示的 Apollo Dynamic SR 指标!这两个指标的组合可以帮助您更轻松、更准确地利用 M1 时间框架进行交易。 购买后请联系我,免费获取交易提示和奖励指标! 祝您交易成功!
Gann Made Easy MT5
Oleg Rodin
5 (11)
Gann Made Easy   是一个专业且易于使用的外汇交易系统,它基于使用先生理论的最佳交易原则。 W.D.江恩。该指标提供准确的买入和卖出信号,包括止损和获利水平。您甚至可以使用推送通知在旅途中进行交易。 购买后请联系我,即可免费获得交易指导和超棒的额外指标! 您可能已经多次听说过江恩交易方法。通常 Gann 的理论不仅对于新手交易者而且对于那些已经有一定交易经验的人来说都是非常复杂的东西。这是因为江恩的交易方法在理论上并不那么容易应用。我花了几年时间来完善这些知识,并将最好的原则应用到我的外汇指标中。 该指标非常易于应用。您所需要的只是将其附加到您的图表并遵循简单的交易建议。该指标不断进行市场分析工作并寻找交易机会。当它检测到一个好的入口点时,它会为您提供一个箭头信号。该指标还显示止损和获利水平。 换句话说,当您像先生一样进行交易时,该指标会为您提供最佳江恩建议。江恩亲自告诉你此时此刻该做什么。但最好的部分是您不需要了解任何有关江恩交易原则的知识,因为该指标会为您完成整个市场分析工作。
ARIPoint
Temirlan Kdyrkhan
1 (4)
ARIPoint is a powerful trading companion designed to generate high-probability entry signals with dynamic TP/SL/DP levels based on volatility. Built-in performance tracking shows win/loss stats, PP1/PP2 hits, and success rates all updated live. Key Features: Buy/Sell signals with adaptive volatility bands Real-time TP/SL/DP levels based on ATR Built-in MA Filter with optional ATR/StdDev volatility Performance stats panel (Success, Profit/Loss, PP1/PP2) Alerts via popup, sound, push, or email Cu
Scalper Vault MT5
Oleg Rodin
5 (1)
Scalper Vault   是一个专业的剥头皮系统,为您提供成功剥头皮所需的一切。该指标是一个完整的交易系统,可供外汇和二元期权交易者使用。推荐的时间范围是 M5。 该系统为您提供趋势方向的准确箭头信号。它还为您提供顶部和底部信号以及江恩市场水平。无论您拥有何种交易经验,该系统都易于使用。您只需要遵循简单的规则并每天重复该过程。 建议将此系统用于主要货币对。感谢您的关注! 请注意,该指标在策略测试器中可能无法正常工作。因此,我建议仅在模拟或真实账户的真实交易条件下使用该系统。 指示器提供所有类型的警报,包括推送通知。 购买指标后请与我联系。我将免费与您分享我的个人交易建议和出色的奖励指标! 祝您交易愉快,盈利!
您好,交易员! 大多数散户交易者依赖于滞后的网页脚本。真正具有交易优势需要机构化的架构。 Astro AI 指标并非标准的图表叠加层。它是一个编译后的神经网络,包含两个代理,直接运行在您的终端上。 以下是该系统背后的具体技术: 1. 代理 1:分析师(图神经网络 - GNN) 市场并非孤立的价格柱;它们是相互关联的数据网络。 功能:代理 1 使用图神经网络来映射这些复杂的非线性关系。 优势:标准指标仅考虑单一的历史移动平均线,而我们的 GNN 可以实时处理深层的市场结构关系,在散户交易量发挥作用之前揭示隐藏的相关性。 2. 代理 2:执行器(近端策略优化 - PPO) 模式识别只是成功的一半。基于当前市场波动做出正确的决策,才是预测模型与滞后模型之间的区别所在。 功能:代理 2 使用 PPO(一种先进的强化学习算法)来确定最佳入场点。 优势:它持续调整交易策略,而非使用静态的“超买”或“超卖”线。它会分析当前市场状况并计算最可能的成交点。 执行桥接:通过 ONNX 集成到交易终端 如果执行速度慢,模式识别就毫无用处。我们已通过 ONNX(开放神经网络交换平台)
Divergence Bomber
Ihor Otkydach
4.89 (94)
购买该指标的每位用户将额外免费获得以下内容: 原创工具“Bomber Utility”,该工具会自动跟踪每一笔交易,设置止损和止盈点,并根据策略规则自动平仓; 适用于不同交易品种的指标设置文件(Set 文件); 三种不同风险模式下的 Bomber Utility 设置文件:“最低风险”、“平衡风险” 和 “观望策略”; 一套详细的 视频操作手册,帮助您快速完成安装、配置并开始使用本交易系统。 注意: 要获取以上所有赠品,请通过 MQL5 的私人消息系统联系卖家。 我为您介绍原创的自定义指标 “Divergence Bomber”(背离轰炸机),它是一套基于 MACD 背离交易策略 的“全功能”交易系统。 该技术指标的主要任务是识别 价格与 MACD 指标之间的背离,并发出交易信号(包括推送通知),指示未来价格可能的运动方向。平均而言,这些信号的准确率超过 98%。有关该指标如何工作的详细说明,请观看本页面上的视频演示。 该系统使用 止损订单 和 动态回撤平仓机制 来管理交易。 Divergence Bomber 指标的主要特点: 支持交易的品种: AUDCAD、AUDCHF、AUDS
Volatility Master for MetaTrader is a real-time dashboard tool that scans up to  50 symbols  to identify high-volatility , trending markets instantly. With bullish/bearish signals, customizable alerts, and a user-friendly interface, it helps you avoid range-bound conditions and focus on high-probability trades. Clarity leads to confidence. Trade confidently and protect your capital effectively with this powerful dashboard. We don't offer free or bonus indicators in exchange of reviews from you.
Quantum TrendPulse
Bogdan Ion Puscasu
5 (26)
介绍 Quantum TrendPulse   ,这是一款终极交易工具,它将 SuperTrend   、   RSI 和 Stochastic 的强大功能整合到一个综合指标中,以最大限度地发挥您的交易潜力。该指标专为追求精准和效率的交易者而设计,可帮助您自信地识别市场趋势、动量变化以及最佳进入和退出点。 主要特点: 超级趋势整合: 轻松跟随当前的市场趋势并乘上盈利浪潮。 RSI 精度: 检测超买和超卖水平,非常适合把握市场逆转时机,可用作 SuperTrend 的过滤器 随机精度: 利用随机振荡在波动的市场中寻找隐藏的机会, 用作超级趋势的过滤器 多时间范围分析: 从 M5 到 H1 或 H4,在不同时间范围内关注市场动态。 可定制的警报: 当您的自定义交易条件得到满足时收到通知,这样您就不会错过任何交易。 无论您是新手还是经验丰富的交易员,   Quantum TrendPulse 都能为您提供所需的优势,帮助您增强策略并自信地进行交易。借助这一强大的指标,将洞察力转化为利润 — 掌控您的交易! ***购买 Quantum TrendPulse,即可免费获得 Quantum Tr
介绍     Quantum Breakout PRO   ,突破性的 MQL5 指标,正在改变您交易突破区域的方式!由拥有超过13年交易经验的资深交易员团队开发,     量子突破 PRO     旨在通过其创新和动态的突破区域策略将您的交易之旅推向新的高度。 量子突破指标将为您提供带有 5 个利润目标区域的突破区域的信号箭头,以及基于突破框的止损建议。 它既适合新手交易者,也适合专业交易者。 量子 EA 通道:       点击这里 重要的!购买后请私信我领取安装手册。 建议: 时间范围:M15 货币对:GBPJPY、EURJPY、USDJPY、NZDUSD、XAUUSD 账户类型:ECN、Raw 或 Razor,点差极低 经纪商时间:GMT +3 经纪商:IC Markets、Pepperstone with Raw 和 Razor 的点差最低 规格: 不重漆! 最多 5 个建议利润目标区域 建议止损水平 可定制的盒子。您可以设置自己的 Box Time Start 和 Box Time End。 接触 如果您有任何疑问或需要帮助,请通过私人消息与我联系。
PainX GainX Blue Spike Fusion AI Advanced Synthetic Index Spike Detection Indicator for MetaTrader 5 Discover potential spike setups with a clear, organized, and professional trading interface. PainX GainX Blue Spike Fusion AI is a specialized indicator designed for traders who monitor synthetic indices and want a structured way to observe potential price spike opportunities. The indicator combines signal monitoring, market-condition analysis, visual alerts, and event tracking in one convenient
PZ Divergence Trading MT5
PZ TRADING SLU
3.71 (7)
棘手的发现和频率稀缺是最可靠的交易方案之一。该指标使用您喜欢的振荡器自动查找并扫描常规和隐藏的发散。 [ 安装指南 | 更新指南 | 故障排除 | 常见问题 | 所有产品 ] 容易交易 发现常规和隐藏的分歧 支持许多知名的振荡器 根据突破实现交易信号 显示适当的止损和获利水平 可配置的振荡器参数 可自定义的颜色和尺寸 按条形过滤大小差异 实现绩效统计 它实现了电子邮件/声音/视觉警报 为了提供广阔的市场前景,可以使用不同的振荡器在同一张图表中多次加载该指标,而不会产生干扰。该指标支持以下振荡器: RSI CCI MACD OSMA 随机 动量 很棒的振荡器 加速器振荡器 威廉姆斯百分比范围 相对活力指数 由于差异可能会扩大很多,尤其是在外汇市场中,因此该指标产生了转折:它在等待交易突破之前等待donchian突破确认差异。最终结果是带有非常可靠的交易信号的重新粉刷指示器。 输入参数 幅度:用于寻找差异的之字形周期 振荡器-选择要加载到图表的振荡器。 突破期-交易信号的突破期,以柱为单位。 发散类型-启用或禁用发散类型:隐藏,常规或两者。 最小散度单位为条形-最小散度单位为条形
RelicusRoad Pro MT5
Relicus LLC
4.96 (25)
别再凭猜测做交易。 在同一张图表上看清何时入场、何时离场,以及市场的方向。 RelicusRoad Pro 将近二十种工具整合进一个指标,你可以只开启适合自己交易方式的那几项。 入场清晰。出场清晰。每张图表都有计划。 是不是很熟悉? 你刚买入,价格一分钟后就逆着你运行。 你出场太早,然后眼看着行情在你离场后继续走下去。 图表上有五个指标,给出五种不同的答案。 你的止损全凭猜测。 我们为何开发它 我们做外汇交易已有 18 年。RelicusRoad 背后的核心算法最初是在私下为我们自己的专业交易员圈子开发的。 初衷很个人。我们厌倦了一次次手工画同样的线,违反自己定下的规则,错过图表上真正重要的那一点。 对我们有效的是一致性:每天以同样的方式读图,直到它变成肌肉记忆。RelicusRoad Pro 把这种看盘方式带到你的图表上。 之后我们把它开放给更多交易员,因为一个小圈子能看到的东西有限。 每位交易员都会带来新的问题和想法,好的想法会进入下一次更新。今天其中很多工具之所以存在,是因为我们的交易员提出了需求。 这个社区保持私密且规模不大,同时活跃的交易员保持在 2,000 人以内。有些人使
Quantum Direction 是一款专业的趋势跟踪指标,旨在识别市场方向、发现趋势早期变化,并提供经过过滤的入场和出场信号。 该指标包含免费的 Quantum Trade Assistant ,这是一款专业的交易管理工具,可在 MQL5 Market 获取。它可以直接连接到 Quantum Direction ,并在出现有效信号时自动开仓,或在满足设定的出场条件时自动平仓。 在此下载免费的 Quantum Trade Assistant 该指标的主要功能: 多逻辑趋势检测 — 结合多种市场分析条件,用于识别潜在的趋势开始以及趋势方向变化。 交易时段过滤器 — 将信号集中在所选择的交易时段,帮助您在市场活跃度和波动性较高的时期分析交易机会。 高周期过滤器 — 使用更高时间周期确认市场方向,并帮助减少由短期突破或暂时性市场方向变化产生的信号。 入场与出场提醒 — 提供多种入场和出场信号提醒方式,帮助您无需持续盯盘即可监控市场。 点数盈亏仪表盘 — 在图表上显示信号累计点数盈亏,以便快速进行历史评估和回测。 我将这套策略应用于自己的交易,并在 YouTube 频道记录我的交易历程。购买
OrderFlux – MetaTrader 5 的订单流 (Order Flow) 与足迹图 (Footprint) 指标 OrderFlux 是一款专业的 MetaTrader 5 订单流和足迹图指标。它打开每一根 K 线,揭示其内部结构:每个价格水平的交易量,并将其划分为主动买盘和主动卖盘。根据这些 Tick 数据,系统会实时构建完整的足迹图,包括 Delta, Imbalance (失衡), Volume Profile (成交量分布) 和 Market Profile (市场轮廓) 。 常规图表只显示开盘、最高、最低和收盘价。这只是运动的结果,而非原因。OrderFlux 让每根 K 线的微观结构变得可见,并回答了最关键的问题: 究竟是谁在真正推动行情? 这使得交易者能够基于真实的交易量来读取支撑和阻力,而不是仅仅根据 K 线形状进行猜测。 足迹图显示内容 在每个价格水平上,都会显示两个数字。左侧是 Bid(买价)的交易量,右侧是 Ask(卖价)的交易量。这两侧之间的关系创造了 Delta — 来自买方或卖方的净压力。 Imbalances (失衡): 某一方具有压倒性优势的
M1 Quantum MT5
Hamed Dehgani
4.2 (10)
使用 M1 Quantum 的实盘交易信号 : 信号 (交易由 Quantum Trade Assistant 自动 执行,并作为本产品 免费 提供。) 最新消息: 版本 1.64 已发布。现在所有交易的止损都会设置在相应的支撑位/阻力位之后。Smart Close 功能也进行了改进,以提升此版本 EA 的性能。 自 8 月 9 日起,实盘信号一直运行在版本 1.64 上。 价格计划: 当前价格: $169 (早期用户优惠) 下一阶段计划价格: $189 计划零售价: $299 开发者提示: 购买后请联系我,以获取 最新推荐的参数设置文件(Set File) 、交易建议,以及加入 VIP 支持群组 ,与其他 M1 Quantum 用户交流经验。 常见问题 - 设置文件 - 安装指南 M1 Quantum 是一款专业的 M1 交易系统,提供快速且精准的交易信号,并内置止损(Stop Loss)、止盈(Take Profit)以及智能资金管理功能。 M1 Quantum 包含专业的资金管理系统,通过专注于 连续盈利交易 ,帮助交易者更快地增长账户资金。 M1 Quantum 指标 的主
CRT Pro is a complete Candle Range Theory toolkit for MetaTrader 5. It finds the CRT model on up to three timeframes and adds the tools needed to read it: higher-timeframe candles, structure shifts, fair value gaps, liquidity sweeps, a bias table and SSMT divergence. Every module can be switched on or off. 1. CRT Model A CRT model is built from two candles of the chosen CRT timeframe. C1 is the range candle. C2 is the sweep candle: it takes the high or the low of C1 and closes back inside the
货币强度向导是一个非常强大的指标,为您提供成功交易的一体化解决方案。该指标使用多个时间范围内所有货币的数据来计算这个或那个外汇对的力量。此数据以易于使用的货币指数和货币电力线的形式表示,您可以使用它们来查看这种或那种货币的力量。 您所需要的只是将指标附加到您要交易的图表上,该指标将向您显示您交易的货币的真实强度。该指标还向您显示买卖量压力的极值,您可以在顺势交易时利用这些压力。该指标还显示了基于斐波那契的可能目标。该指标可用于各种交易时间范围。该指标支持各种货币对的交易。   该指标为您提供所有类型的警报,包括推送通知。 购买后请联系我。我将与您分享我的交易技巧,并免费为您提供丰厚的红利指标! 祝您交易愉快,获利丰厚!
ICT PO3 (Power of 3) AMD Protocol Framework Indicator True Time & Structure Integration   |  Non-Repainting | Real-Time  | Multi-Asset  | MT4 Version Available Full Setup Guide & Strategy Playbook: https://www.mql5.com/en/blogs/post/768683 The ICT Power of Three (PO3): The Complete Guide to Accumulation, Manipulation, and Distribution https://www.mql5.com/en/blogs/post/771729 MT4 Version: https://www.mql5.com/en/market/product/171742 Indicator Overview The ICT PO3 AMD Protocol Framework i
Bill Williams Advanced
Siarhei Vashchylka
5 (11)
Bill Williams Advanced is designed for automatic chart analysis using Bill Williams' "Profitunity" system. The indicator analyzes four timeframes at once. Manual (Be sure to read before purchasing) Advantages 1. Analyzes the chart using Bill Williams' "Profitunity" system. Signals are displayed in a table in the corner of the screen and on the price chart. 2. Finds all known AO and AC signals, as well as zone signals. Equipped with a trend filter based on the Alligator. 3. Finds "Divergence Bar
Advanced Supply Demand MT5
Bernhard Schweigert
4.53 (15)
任何新手或专业交易者的最佳解决方案! 该指标是一款独特、高质量、且价格合理的交易工具,因为我们已经整合了许多专有功能和新公式。 依据此更新,您将能够显示双重时间帧区域。 您不仅可以显示一个较高的时间帧,还可以同时显示图表时间帧,加上更高的时间帧:显示嵌套时区。 供需双方所有交易者都会喜欢它。 :) 重要信息披露 高级供需的最大潜力,请访问 https://www.mql5.com/zh/blogs/post/720245   想象您的交易如何得以改善,是因为您能够精准定位入场或目标位吗? 构建于新的底层算法,它可以更轻松地识别出买卖双方之间的潜在失衡。 这是因为它以图形方式展示供需最强劲区域,及其过去的表现(显示旧区域)。 这些功能旨在帮助您更轻松地发现最佳入场区域和价位。 现在您可以针对您的交易品种和时间帧来优化和编辑区域强度! 高级供需指标适用于所有产品和时间帧。 它是一个新的公式,非常新的功能是两个区域强度函数可由用户输入进行调整! 这在交易中是一大优势。 当您学习如何使用专有功能,例如带有价格游离最小 X 因子的区域强度时,您能够判断该区域强劲与否。 供需区域用作警报触发器。
Superhero
Ihor Otkydach
5 (3)
SUPERHERO 指標是一款基於「全方位」原則設計的多貨幣交易系統。該指標能獨立分析市場,並提供開倉與平倉的交易訊號。它採用止損與獲利了結訂單,風險報酬比(R:R)為 1:1。 此系統可向您的智慧型手機發送推播通知,讓您無需綁定電腦,即可「隨時隨地」進行交易。這對於自營交易公司而言再適合不過了。 每位顧客皆可享額外好禮: 每位購買此指標的買家,都將收到我贈送的一項特別實用工具,該工具: 自動下達止損與獲利了結訂單 當價格達到目標水準時,系統會自動平倉 支援待執行訂單交易 支援均值交易模式 如果您希望將這款優秀且極為便利的工具作為禮物獲贈,請在購買 SUPERHERO 指標後,立即透過 MQL5 平台的私訊與我聯繫。此外,您還將獲得培訓課程「如何安裝與設定 SUPERHERO 並開始穩定獲利」的存取權限。 關於「超級英雄」策略 SUPERHERO 策略是利用價格回調時,順應趨勢方向進行盤中交易。 「超級英雄」程式碼內含數個強大的技術指標,用以分析價格通道的趨勢方向與波動範圍,並能識別在修正性回調後形成的盤中波段反轉形態。 SUPERHERO 指標採用獨特的自我優化演算法,一旦添加至價格
CGE Trading Suite
Carl Gustav Johan Ekstrom
5 (2)
Institutional-Grade Analytics for MT5 The full analytical edge of a professional trading desk, built into your MT5 chart. Standard retail platforms lack the depth required for professional market analysis. The CGE Trading Suite bridges this gap, transforming MetaTrader 5 into a comprehensive workspace. By integrating 22 proprietary modules into a single, unified chart interface, the suite eliminates fragmented analysis. It provides definitive clarity across market structure, timing, momentum,
SkyHammer Signal Pro
Shengzu Zhong
5 (4)
SkyHammer Signal Pro Professional No-Repaint Trend Signal Indicator with Locked Entry, SL and TP Levels SkyHammer Signal Pro is a structured trend and momentum signal indicator designed for traders who want clear, fixed, and verifiable trading signals. It works best on lower timeframes such as M1 and M5 . The indicator does not try to predict tops or bottoms. Instead, it waits for confirmed market structure, trend direction, momentum strength, volatility quality, and target space before generati
Manzano Footprint Order Flow
Patricia Manzano Gomez
5 (1)
MANZANO FOOTPRINT ORDER FLOW Footprint, Order Flow and Volume Analysis for MetaTrader 5 Manzano Footprint Order Flow is an analytical indicator for MetaTrader 5 that brings together Footprint charts, Bid x Ask, Delta, Cumulative Delta (CVD), Imbalances, Volume Profile, VWAP, Market Depth and Time & Sales in an interactive environment. It allows traders to examine activity within individual candles, identify volume concentrations, compare buying and selling pressure, and analyse how market partic
Azimuth Pro
Ottaviano De Cicco
5 (7)
Azimuth Pro V2:MT5合成分形结构分析与确认入场 概述 Azimuth Pro 是 Merkava Labs 推出的多层级波段结构指标。四层嵌套波段层级、锚定波段的VWAP、ABC形态识别、三时间框架结构过滤以及收盘确认入场——一个图表,一个从微观波段到宏观周期的完整工作流程。 这不是盲目的信号产品。它是一个以结构为先的工作流程,专为重视位置、背景和时机的交易者打造。 ️ 夏季促销 — 庆祝夏至与 The Oracle Pro 上市:Azimuth Pro 七折优惠,现价 279 美元(原价 399 美元)。限时夏季优惠。 1. V2的变化 合成多时间框架引擎 高时间框架分析从零开始重建,采用与Meridian Pro相同的专有合成架构。更清晰的HTF背景、稳定的实时行为、无经典MTF同步问题。合成引擎还解锁了 固定比率时间框架级联 (x2、x3、x4、x6)——不再在经纪商的固定时间框架之间任意跳转,您可以按图表时间框架的固定倍数分析结构,在每个尺度上保持相同的分形关系。 确认入场箭头 作为稳定且可恢复的执行层而设计的收盘确认箭头。当ABC设置形成且自适应确认逻辑
作者的更多信息
A. Momentum Candles: Colours every candle by momentum: bullish, neutral or bearish at a glance. Marks each break of structure and change of character right on the chart. Draws a line at the swing level that broke, so you can see where it happened. Skips small swings and breaks into an exhausted zone, if you want fewer marks. Fits the momentum period to your timeframe, or uses the period you choose. Alerts you with a pop-up and a journal line when a closed candle changes colour. You know this mo
FREE
A Event Radar
Ivan Privalov
Advanced Event Radar: Uses unique clean outline of events, even when there are multiple events. Displays an overlapping, semi-transparent, minimalist row of sessions. Shows minimalist yet configurable bands of scheduled market events. Covers fixes, settlements, sessions, data, central banks and inventories. Reads your terminal's economic calendar and your own list of events. Opens a card on click with what price usually does and what to watch for. Keeps every time in your own time zone, with day
A Chart Manager: Restyles your chart with one of five color themes when you click it. Removes background images and the objects other tools leave on the chart. Never removes the rectangle labels that Expert Advisor panels are built from. Shows or hides the grid, volumes, trade levels, price lines and more. Hides the price and date scales, which the chart properties window cannot do. Sets chart mode, zoom, timeframe and chart shift in the same click. Sound familiar? You add the Expert Advisor to
FREE
Advanced Expert Advisor Monitor: Shows whether your Expert Advisor is still running, right on the chart. Keeps reporting its trades even after the Expert Advisor has stopped or was removed. Closed profit, win rate and floating profit for Today, 3 Days, Week or Month. A 365-day view: profit factor, drawdown, expectancy, streaks and more. Draws only your Expert Advisor's trades on the chart, by magic number. Popup and phone alerts when the Expert Advisor unexpectedly crashes. Does this sound fa
FREE
Advanced Chart Manager: Puts your chart look back when another program changes it, on your next click. Names the setting that was changed, so you can tell which tool did it. Styles every open chart from one instance, then returns you to your chart. Builds your own theme from thirteen colors, or uses one of five ready ones. Watches second by second right after load, while slow indicators start up. Clears leftover drawings on a schedule, leaving panel backgrounds in place. When the chart keeps ch
筛选:
无评论
回复评论