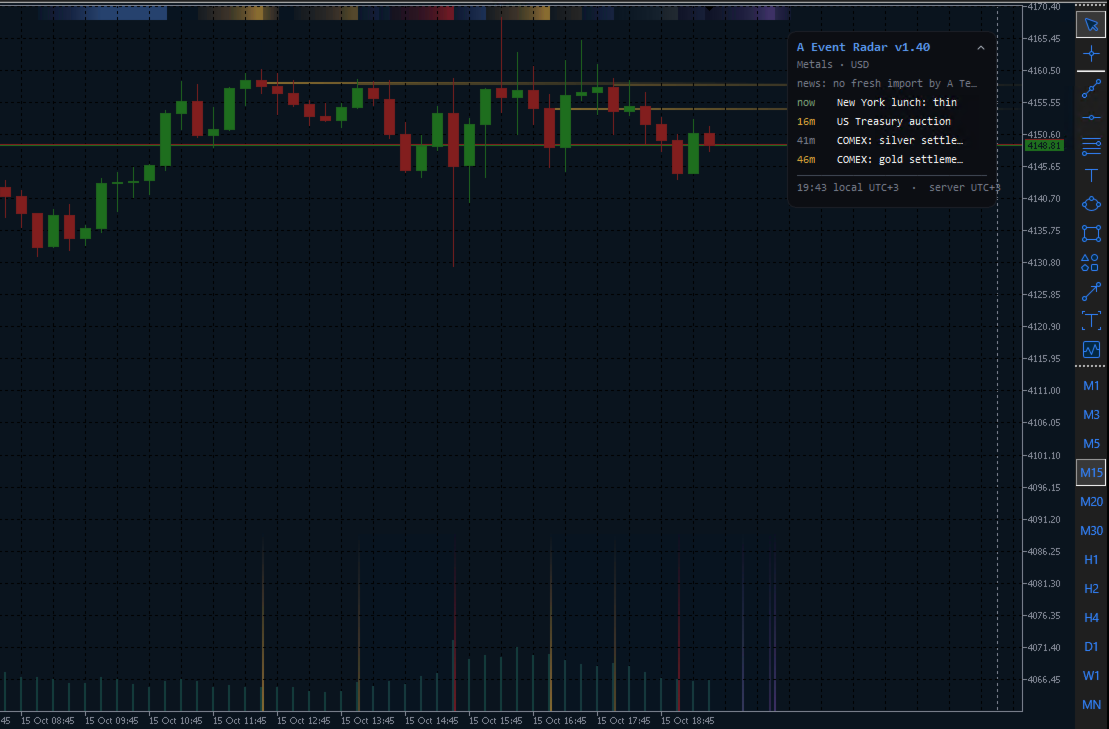
A Event Radar
- 指标
- 版本: 1.41

- Shows a warning band on your chart before each scheduled market event.
- Covers fixes, settlements, sessions, data, central banks and inventories.
- Reads your terminal's economic calendar and your own list of events.
- Opens a card on click with what price usually does and what to watch for.
- Keeps every time in your own time zone, with daylight saving handled per event.
- Alerts you at each warning stage and at the start, by popup, sound or email.
The situation
You are in a trade on gold at ten to five, London time. The afternoon fix is minutes away, and the quiet market you entered is about to change. You did not have the fixing time in mind, and the calendar you keep open shows news releases, not fixes.
The same happens with the settlement on crude oil, the stock market open, the funding time on a perpetual contract, and the week when Europe and the United States change their clocks on different Sundays. These moments are known in advance, but they are spread over many sources and many time zones.
The idea
Put the whole schedule on the chart itself, in your own time, and warn before each moment rather than at it. A band that deepens as the event comes closer tells you at a glance how much time you have. A click tells you what that event usually does to price.
What A Event Radar does
Warning bands and event lines
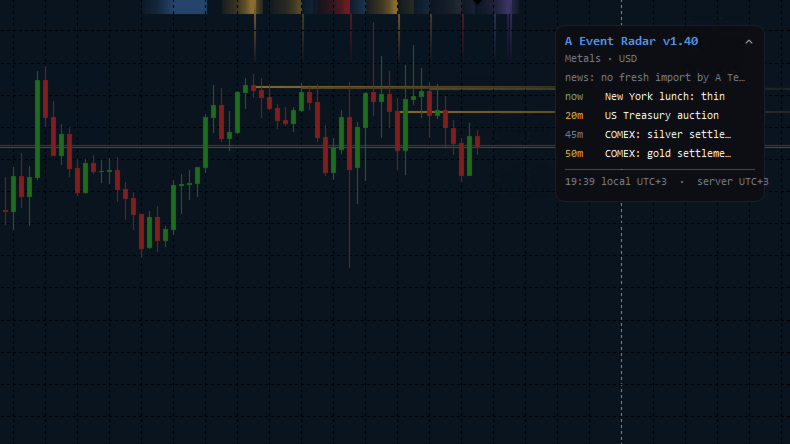
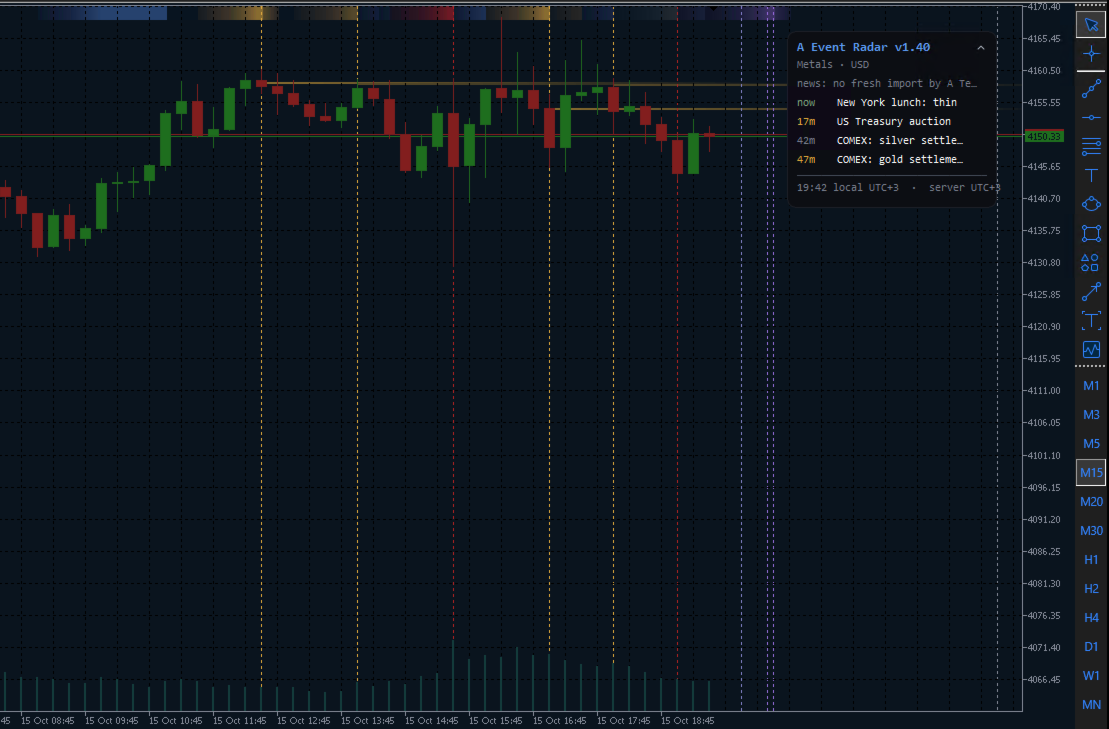
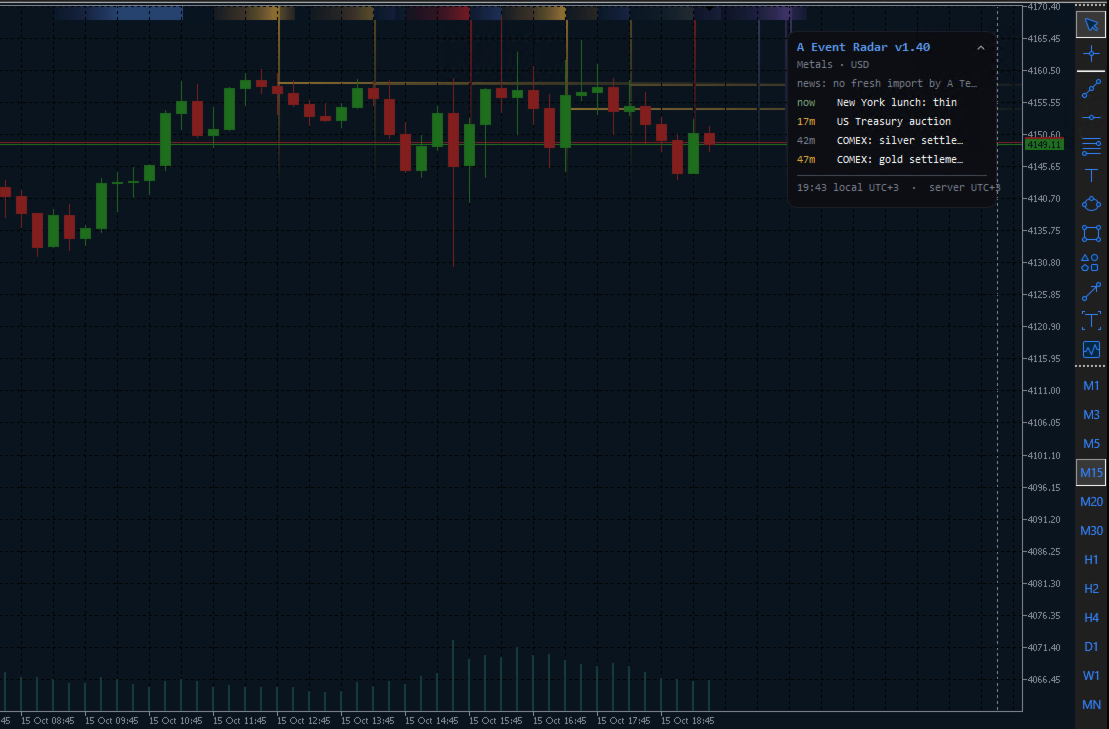
Before each event a band climbs through three stages, by default sixty, thirty and fifteen minutes ahead, into the event window. You choose where the band sits: a strip at the top or bottom of the chart, or full-height vertical bands behind the candles. Each point event also gets a line, either a short gradient bar from the chart edge or a full-height line.
A schedule that fits the chart
The indicator detects the symbol class from its name and shows only the events that matter for it. A gold chart gets the London gold and silver fixes and the COMEX session and settlement. An oil chart gets the weekly inventory reports and the NYMEX and Brent settlements. A currency pair gets the central banks of its two currencies and the London and New York fixes. An index gets the cash session open and close. A crypto chart gets the funding times and the weekend window. You can set the class by hand.
The economic calendar and your own events
The terminal's economic calendar is read for the chart's currencies, with forecast, previous and actual values on the card. You can add your own events in the settings or in a text file, with a time zone, weekdays, a window length and a note of your own.
The card
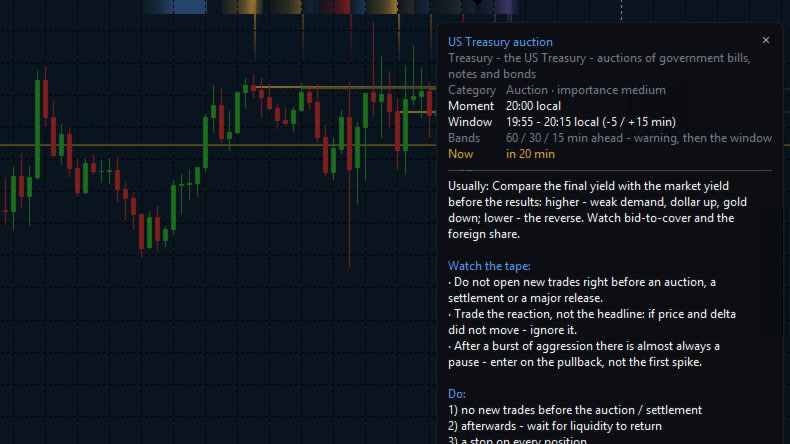
Click a band, a line or a panel row and a card opens: the category and importance, the moment and the window, how long until it starts, and for a past fix or settlement the price of that minute and the range of the window. Below that, three short sections: what usually happens around this event, what to watch for in the order flow, and what to do. Abbreviations in event names are spelled out on the card.
The panel
A small panel in a corner of your choice lists the next events with a countdown, your local time and the broker's server offset. Click its title to fold it.
Time handled per event
Every time on the chart is shown in your computer's time zone. The broker's server offset is measured, not typed in. Each event is defined in its own zone and converted for its own date, so the weeks when Europe and the United States are on different clocks come out right.
Alerts
One alert per warning stage and one at the start of the event, each fired once: popup, sound, push notification, email or journal line, as you choose. You can limit alerts to medium or high importance. The alert text names the event and its time in your zone.
Six languages
The texts on the chart, the card and the panel are available in English, Russian, Ukrainian, German, Spanish and French. English is the default.
A signal for your Expert Advisor
If you write your own Expert Advisors, the indicator can publish its state in terminal global variables: whether a warning stage or an event window is running, the importance of that event, and the minutes to the next one.
How to start
- Attach A Event Radar to any chart. The symbol class is detected and the schedule is drawn.
- In the inputs, choose where the bands sit, the panel corner and your language.
- Turn on the alerts you want and set the warning stages to your own minutes.
From then on, every scheduled moment that can move your symbol is on the chart before it happens.