Sync All Charts

Synchronizes all open charts to the symbol of the chart this indicator is applied to.


SyncAllCharts is a MetaTrader 5 indicator that lets one main chart control the trading symbol shown on all other open charts. Change the symbol on the main chart, and the other charts follow while keeping their own timeframes. It helps you review the same market across several timeframes without changing each chart manually.

How to use it

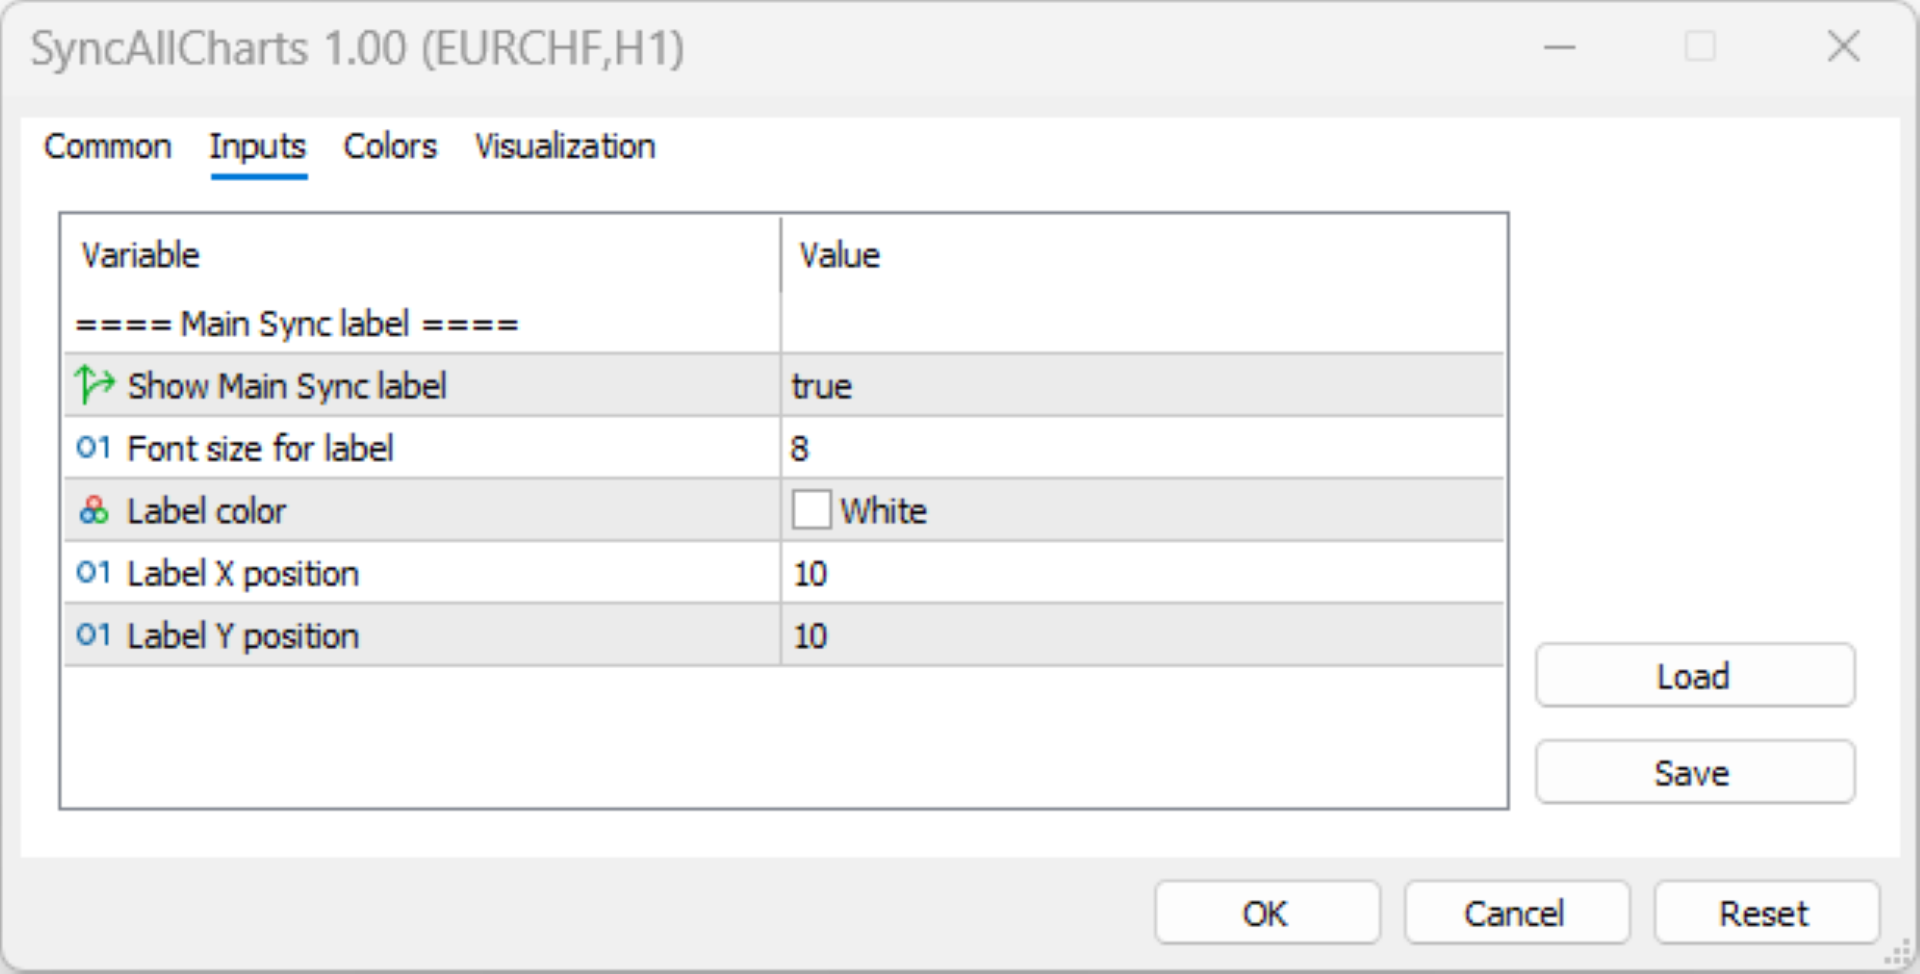
Attach the indicator to one chart that you want to use as the main controller. It immediately switches every other open chart to that chart’s symbol. An optional “Main Sync” label identifies the controlling chart; you can adjust the label’s size, color, and position or hide it. 

For example, if your charts use M5, M15, and H1, switching the main chart from EURUSD to GBPUSD changes the others to GBPUSD without changing their timeframes. 

Benefits

  • Saves repetitive work when switching markets across multiple charts.

  • Helps keep your multi-timeframe analysis focused on the same instrument.

Preserves each chart’s timeframe, so you do not need to rebuild your timeframe arrangement.  


 Limits

  • Applies to every other open chart in the same MT5 terminal; there is no option to exclude charts or create separate synchronization groups.

  • Synchronizes symbols only—not zoom, scrolling, chart layout, drawings, or indicator settings.

  • Does not provide trading signals, place trades, or manage positions.

  • Synchronization runs when the indicator loads and when the main chart’s symbol changes. There is no continuous check, so a newly opened chart or a manually changed secondary chart may stay different until the next synchronization.

  • Use one main controller: the code does not include coordination between multiple copies attached to different charts.

推荐产品
NINJA MT5 DOCTOR 概览 NINJA MT5 Doctor 是一款免费的只读型 MT5 实用工具,用于生成一次性的诊断快照,涵盖终端、账户、已打开的图表、所选历史数据以及当前挂载图表的交易品种。它采用 Expert Advisor 格式,但不是交易 EA,也不是指标。面板和输入参数名称均为英文。 检查内容 它会检查经纪商服务器连接、终端和账户的交易权限、Doctor 自身的权限、交易模式和经纪商公布的交易时段、报价新鲜度、点差、所选时间周期的同步状态和K线数量、交易量规则、参考保证金与可用保证金的对比,以及经纪商公布的交易品种属性。CHARTS 选项卡会列出每个已打开的图表,以及可读取到的已挂载 EA 名称。它无法检查其他 EA 的私有逻辑。 面板与状态 OVERVIEW 汇总检查结果,HISTORY 显示同步状态和已复制的K线数量,CHARTS 列出已打开的图表,SPECS 显示挂载图表中交易品种的设置。READY 表示在已实现的检查范围内,已完成的快照未发现警告或明确的阻断因素。WARNING 表示需要手动确认。BLOCKED 表示存在明确的环境阻断因素。这些状态不是
FREE
Trade Behavior Mirror 只读取您自己账户中已经平仓的交易历史,并且只统计一种具体行为:在一次已确认的亏损之后不久,以高于自己平常水平的手数开出新仓位。这个工具不做任何预测,也不给出任何建议。面板上出现的每一个数字,都是这个账户上已经发生过的事实。 数字是这样算出来的:它读取所有品种、所有魔术号在内的最多31天已平仓交易 —— 这是整个账户的画面,而不只是当前图表所在品种的画面。从今天之前的30天里,它计算每天新开仓笔数的中位数,以及这些开仓手数的中位数。之所以用中位数而不是平均值,是为了不让某一笔异常大的交易拉偏整体基准。如果这30天窗口内的开仓不足5笔,历史数据就不足以建立一个公平的基准,面板会显示"Collecting history",而不是用过少的数据硬凑出一个数字。 核心统计,即面板上的 Entries within 10min of a loss, at above-median lot: 一行:对每一次新开仓,它都会检查前10分钟内是否有一笔亏损被确认平仓,以及这次开仓的手数是否高于30天中位数。符合条件的次数会分别按 Today 和 Last 7
FREE
Trading Session MT5
Kevin Schneider
3 (1)
Trading Session Indicator The Trading Session Indicator visualizes the high and low points as well as the start and end times of the Asian, London, and New York trading sessions directly on your chart. Features: Visualization of major trading sessions Highlighting of high and low points Display of start and end times for each session Customizable session times User-friendly and efficient Customizability: Each trading session (Asian, London, New York) can be individually customized to match speci
FREE
Blahtech VWAP MT5
Blahtech Limited
5 (1)
Blahtech VWAP - Volume Weighted Average Price (VWAP) is the ratio of price to total volume. It provides an average price over a specified time interval.  Links [  Install  |  Update  |  Documentation   ] Feature Highlights Configurable VWAP Line Sessions, intervals, anchored or continuous Previous day settlement line Standard Deviation bands Alerts at bar close or real time Automatic Broker or Tick volumes Significantly reduced CPU usage Input Parameters Expert Advisor Mode  - Reserved for iCu
FREE
Top Down CandleCast
Opeyemi Fuad Anokwu
投射更大的市场格局,以更高时间框架的信心交易每一个周期,并精准执行每一笔交易!   专业交易者都明白,每一笔高质量的交易都始于 自上而下(Top-Down)分析 。然而,传统的分析流程需要不断在多个图表和时间周期之间切换,这不仅打断专注力,还容易错过关键的高时间框架市场信息。 这种重复性的操作会减慢分析速度、干扰交易执行,并使交易者更难持续掌握整体市场结构。   TOP-DOWN CANDLE CAST 是一款 MT5 指标,可将 高时间框架(HTF)K线 ——包括实体、影线、开盘价、收盘价以及完整价格区间——精确投射到任意低时间框架(LTF)图表上。无需频繁切换图表,也无需凭记忆判断 HTF 结构, TOP-DOWN CANDLE CAST 能提供实时、像素级精准的可视化参考,让您的自上而下分析更加高效,进场决策更加严谨,帮助交易者: · 无需离开执行图表,即可持续掌握高时间框架市场结构。 · 在高时间框架 K 线形成过程中,实时观察其动态变化。 · 在高时间框架价格区间内,分析低时间框架价格行为。 · 在持续掌握市场整体背景的基础上,做出更加精准的交易决策。   最终,您将获得更加
FREE
AZ ATR indicator (with volume correlation bonus) Standard ATR indicator, you can enable ignoring abnormally large candles. It is possible to change the location of the displayed text in 4 corners of the chart. You can change the calculation period (days ago). Bonus - the indicator has a correlation with volumes. Can be enabled to display a possible priority at the current moment in the market. What do the values ​​mean: Positive correlation (0.3 - 1.0): 0.3-0.7 - moderate connection
FREE
FullInfo MTX Levels is the free indicator version of FullInfo MTX Pro. The full version is available in the MQL5 Market. It puts the levels traders watch, a few pieces of market analysis and the numbers of your account on the M5 chart. It does not send, change or close orders, and it does not touch your positions. On the chart (M5) • Previous day, week and month high/low, daily and weekly open, New York midnight open, and the highs/lows of the Asia, London and New York sessions. Labels sit at
FREE
TrendVision AI
Murtadha Majid Jeyad Al-Khuzaie
TrendVision AI – Smart Trend Channels & Price Forecasting for MetaTrader 5 Discover market structure and explore potential future price direction with TrendVision AI, an advanced technical indicator for MetaTrader 5 that combines automatic trendline analysis with a machine-learning-based price forecasting model. How Does TrendVision AI Work? TrendVision AI analyzes historical candlestick data within a configurable lookback window. It automatically draws two trendlines directly on the chart:
FREE
Pin Bars MT5
Yury Emeliyanov
Main purpose:   "Pin Bars"   is designed to automatically detect pin bars on financial market charts. A pin bar is a candle with a characteristic body and a long tail, which can signal a trend reversal or correction. How it works:   The indicator analyzes each candle on the chart, determining the size of the body, tail and nose of the candle. When a pin bar corresponding to predefined parameters is detected, the indicator marks it on the chart with an up or down arrow, depending on the directi

FREE
FX Clock
Abderrahmane Benali
FXClock – Professional Clock Indicator for Traders Please leave a 5 star rating if you like this free tool! Thank you so much :) The FXClock indicator is a practical and simple tool that displays time directly on your trading platform, allowing you to track multiple key pieces of information at the same time. It is specially designed to help traders synchronize their trading with market hours and global sessions. Key Features: Displays the broker server time with precision. Displays your local c
FREE
Sierra Capital Session Sweep Scanner maps out the Asian, London, and New York trading sessions directly on your chart, then watches for a specific price-action pattern: a candle that spikes through the Asian session's high or low and closes back inside it — a classic liquidity sweep. What it shows: Colour-coded boxes marking the Asian, London, and NY session ranges, with the Asian high/low projected forward as reference lines Arrows marking each qualifying sweep-and-reject candle, with projected
FREE
Smart Grid MT5
Dmitry Kotov
5 (5)
Smart Grid MT5 automatically recognizes any symbol, period and scale of the chart and marks it up accordingly. It is possible to mark up the chart by trading sessions. The grid consists of the two main line types. Vertical lines There are two visualization methods: Standard - the lines are divided into three types, separating: Small time period. Medium time period. Large time period. Trading Session - the lines are divided into groups (a total of ten). Each group has two lines: the first is res
FREE
️ FWS Storm Watch — Economic News Radar & Storm Warning System Never get blindsided by news again. Storm Watch monitors the MT5 Economic Calendar in real time, filters upcoming events by currency and impact level, calculates a weather-style severity rating, and alerts you before high-impact releases. All from a compact on-chart panel with a stunning browser-based web dashboard. Part of the Forex Weather Station suite. Uses MT5's built-in calendar. What It Shows Severity Rating — Weather-styl
FREE
TradeVision Pro
Ian Nganga Comba
TradeVisonPro Forex Analyzer Pro MT5 交易账户分析与监控仪表板 TradeVisonPro Forex Analyzer Pro 是一款专为 MetaTrader 5 用户设计的交易分析和账户监控解决方案。 本产品将 MT5 交易数据整理到结构化的网页仪表板中,使交易者能够查看账户信息、监控未平仓头寸、分析交易历史、跟踪策略、记录交易日志以及查看绩效统计数据。 TradeVisonPro Forex Analyzer Pro 旨在帮助交易者整理交易信息,并通过受支持的桌面和移动网页浏览器访问这些数据。 主要功能 • MT5 账户仪表板 • 未平仓头寸监控 • 交易历史分析 • 交易日历 • 策略跟踪 • 交易日志 • 账户绩效统计 • 绩效报告 • 交易通知 • 多账户支持 • 可分享的只读报告 MT5 账户仪表板 在一个结构化的仪表板中查看 MetaTrader 5 交易账户的重要信息。 可显示的信息包括: • 账户余额 • 净值 • 可用保证金 • 保证金水平 • 未平仓头寸 • 浮动盈亏 • 交易量 • 经纪商信息 • 账户信息 仪表板集中显示
FREE
Value Chart Candlesticks
Flavio Javier Jarabeck
4.57 (14)
The idea of a Value Chart indicator was presented in the very good book I read back in 2020 , " Dynamic Trading Indicators: Winning with Value Charts and Price Action Profile ", from the authors Mark Helweg and David Stendahl. The idea is simple and the result is pure genius: Present candlestick Price analysis in a detrended way! HOW TO READ THIS INDICATOR Look for Overbought and Oversold levels. Of course, you will need to test the settings a lot to find the "correct" one for your approach. It
FREE
Double Correlation indicator (free) plots two windowed correlations in a separate window.  the size of window is taken as input before the two symbols to correlate to. Two symbols are taken as an input parameters as well as period length. and the two correlations are computed with the currently shown symbol ex: input GBPJPY and AUDNZD.  current symbol EURUSD then the following will be computed corr(EURUSD,GBPJPY) and corr(EURUSD,AUDNZD) The indicator can be useful to run a multi-symbol pair trad
FREE
WH Price Wave Pattern MT5
Wissam Hussein
4.15 (13)
Welcome to our Price Wave Pattern MT5 --(ABCD Pattern)-- The ABCD pattern is a powerful and widely used trading pattern in the world of technical analysis. It is a harmonic price pattern that traders use to identify potential buy and sell opportunities in the market. With the ABCD pattern, traders can anticipate potential price movements and make informed decisions on when to enter and exit trades. Send me a  Message and Get A Free Gift : ABCD  Symbol Scanner Dashboard! EA Version:    Price W
FREE
Market Phase Analyzer
Mattia Impicciatore
3.75 (4)
总体介绍 清晰的信号与简单的规则,帮助识别市场的三个关键阶段。本指标基于亚洲交易时段实时识别累积阶段,侦测操纵阶段中的流动性扫单,并在分配阶段确认趋势方向。上涨阶段显示绿色箭头,下跌阶段显示红色箭头,可自定义亚洲箱体的颜色与边框,并可选择显示当日开盘线以提供快速的日内参考。 工作原理 在累积阶段,指标会根据记录的最高点与最低点绘制价格箱体。在操纵阶段,检查价格是否突破箱体范围超过设定的点数。在分配阶段,通过 ATR 确认或固定点数突破来验证趋势方向。一旦条件满足,会在图表上绘制相应的箭头和阶段标签。 三阶段交易逻辑 累积(Accumulation)– 设置亚洲交易时段的时间范围,并绘制价格区间。 操纵(Manipulation)– 检测价格向上或向下突破箱体,识别扫单和假突破。 分配(Distribution)– 使用 ATR 动态阈值或固定点数确认突破方向。 图表显示内容 可自定义颜色和边框的亚洲箱体,可选择显示在K线的上方或下方。 经过优化的上涨与下跌阶段箭头,便于日内交易读取。 当日开盘线(Daily Open)帮助判断日内方向,并清晰区分不同交易日。 主要参数 Ses
FREE
Spread highlighter
Jonathan Daniel Marion
This spread indicator displays the actual spread of each candle. It highlights the maximum spread and the minimum spread of the chosen symbol. This indicator is very helpful to see in real time the spread evolution helping to avoid taking a trade when the spread is too high. Inputs: Print value in Points: if true displays the spread as a whole number D isplay minimum and maximum spread of the past N days: select the number of days to consider the maximum and minimum spread Automatically adj
FREE
ICT Killzones and Liquidity Levels is a clean chart tool that marks the main ICT killzones and key liquidity levels directly on your chart. It is designed for traders who follow Smart Money Concepts and ICT-style price action and want a simple, non-repainting reference on the chart. The indicator draws the Asian, London, New York and London Close killzones as boxes based on the session high and low. A vertical line marks the start of each killzone for the current day, so you can see when each se
FREE
Previous High Low Daily Weekly
Marc Guy Verzotti
4.57 (7)
Understanding the levels of the previous day or week is very important information for your trading. This indicateur allow to draw Previous day High/Low Previous week High/Low Congifuration High & Low for: Previous day, week Line Style, color Label position, size, color Any questions or comments, send me a direct message here  https://www.mql5.com/en/users/mvonline
FREE
DC Indicator
Lamont Simone Reynecke
The donchian channel indicator might just be the best fit for you Trading in derivative products such as futures, options, CFD's, forex and certificates contains significant risk. These products are not suitable for every investor. Investors could potentially lose all or more than the original investment. If anything, only money equal to personal risk capital should be used and can be lost without jeopardizing financial security or lifestyle. Partially or fully automated trading programs can
FREE
TradeDeck Lot Calculator
Joaquin Nicolas Metayer
LotCalc is a minimalist MT5 indicator designed for fast, precise position sizing. Set your risk amount in dollars, click the button, then click your entry and stop-loss levels directly on the chart — the lot size and point distance are calculated and displayed instantly. No clutter, no extra panels, just the one tool you actually need before placing a trade.
FREE
免费 —— Donchian 突破通道,以及突破之后负责管理持仓的 ATR 移动止损,全部画在同一张图上。 大多数突破指标只告诉你入场点,然后就没有下文了。趋势跟踪真正难的是之后发生的事:止损放在哪里、什么时候上移、行情什么时候结束。这个指标把系统的两半都画出来。 === 它画什么 === - 最近 N 根已收盘 K 线构成的 Donchian 通道(上轨和下轨)。 - 在某根 K 线「收盘」突破通道之处画出金色箭头 —— 这正是一个突破系统真正会入场的时刻。 - 随后持有仓位所使用的 ATR 移动止损:做多时为绿色,做空时为红色,以虚线显示。它只会朝价格方向移动(绝不放宽),当价格收盘穿过它时便消失 —— 那就是这笔交易结束的地方。 === 不重绘 === 通道由已经收盘的 K 线构成,突破以前一根 K 线的收盘价判定。不会使用正在形成的 K 线绘制任何内容,因此出现过的箭头不会在之后消失。你可以往回翻看历史,并信任所看到的内容。 === 设置 === - N_Channel(默认 40):通道长度,以 K 线数计。 - Trail_ATR(默认 8.0):移动止损距离,以 A
FREE
Ict market structure signals
Botsalo Martin Letlhoagoje
5 (4)
SMC Signals  (BOS/CHoCH + ADR TP/SL Zones)  SMC Signals  is a free Smart Money Concepts (SMC) market structure indicator for MetaTrader 5 that automatically detects: BOS (Break of Structure) CHoCH (Change of Character) Swing High / Swing Low pivots Trade entry levels and projected targets The indicator also calculates ADR(10) (Average Daily Range) and automatically plots: Entry level Stop Loss (SL) Take Profit 1 (TP1) Take Profit 2 (TP2) A built-in dashboard displays live performance statistic
FREE
Gold Max pro
Israr Hussain Shah
4 (1)
Here   our more valuable tools SMC Trend Trading   ,  Easy SMC Trading  ,  Institutional SMC Architect Volume Analysis Tools  ,  Volume flow Profile  ,  Market volume profile  , FVG with Volume  , Liquidity Heatmap Profile  ,  Volume Spread Analysis Automatic Professional Theme:   Instantly applies a high-contrast "Color on White" theme with DeepSkyBlue bull candles and Black bear candles for maximum clarity. Interactive Timeframe Panel:   21 vertical buttons on the left side allow for one-clic
FREE
Close all Charts Super
Abdelaziz Omar Abdelaziz Nader
Quickly clear all open charts in MetaTrader 5 with a single script execution. Ideal for traders who want to reset their workspace before starting a new trading session or analysis. Implementation Notes: This script is designed to operate under strict coding standards ( #property strict ) to ensure reliability and efficiency. No user inputs are required, as it automatically processes all open charts.

FREE
SC MTF Rsi MT5
Krisztian Kenedi
5 (7)
具有多时间框架支持、可自定义视觉信号和可配置警报系统的相对强弱指数(RSI)指标。 自由职业编程服务、更新和其他TrueTL产品可在我的 MQL5主页 获取。 非常欢迎您的反馈和评价! 什么是RSI? 相对强弱指数(RSI)是一种动量振荡器,用于测量价格变化的速度和幅度。该指标在0到100之间振荡,比较在指定期间内近期涨幅与近期跌幅的大小。 RSI主要用于识别超买和超卖状态。高读数表示超买状态,而低读数表示超卖状态。交易者还会关注RSI与价格走势之间的背离,这可能预示着潜在的趋势反转。 功能特点: 带箭头和垂直线的视觉信号标记 三个独立信号缓冲区,带可配置触发器(方向变化、水平交叉、峰值/谷值、极端区域) 具有时间范围过滤的可配置警报功能(电子邮件、推送、声音、弹窗) 带插值方法的多时间框架(MTF)功能 多种绘图和颜色模式(直方图/线条,简单/方向/水平基础着色) 带可选中间水平的可调超买/超卖水平 用于Expert Advisor(EA)集成的自定义指标调用(iCustom)缓冲区访问 输入参数: 基本设置: RSI参数: 周期(默认:14)、应用价格、K线位移偏移量。 多时
FREE
Larger Price Time Crosshair Data MT5
John Louis Fernando Diamante
4.33 (3)
This utility indicator provides accessibility and readability, by displaying a larger price scale, time scale, crosshair, and symbol name/tf/ohlc information. All features are sizeable and can be styled separately, and are optional to show. All Features optional to use font, size and color options Price Scale option to hide the default MT5 price scale option to show horizontal lines at price levels prices drawn can be at round numbers (ie automatic rounding to multiples of 5/10/20/25 points),
FREE
Spread Viewer
Aurelio Miguel Machado Da Silva
FREE
该产品的买家也购买
Trade Assistant MT5
Evgeniy Kravchenko
4.43 (216)
它有助于计算每笔交易的风险,容易安装新的订单,具有部分关闭功能的订单管理, 7 种类型的追踪止损和其他有用的功能。   附加材料和说明 安装说明   -   应用程序说明   -   模拟账户应用程序的试用版 线条功能  - 在图表上显示开仓线、止损线、止盈线。 有了这个功能,就可以很容易地设置一个新的订单,并在开仓前看到它的附加特性。   风险管理  - 风险计算功能在考虑到设定的风险和止损单的大小的情况下,计算新订单的成交量。它允许你设置任何大小的止损,同时观察设定的风险。 批量计算按钮 - 启用 / 禁用风险计算。 在 " 风险 " 一栏中设置必要的风险值,从 0 到 100 的百分比或存款的货币。 在 " 设置 " 选项卡上选择风险计算的变量: $ 货币, % 余额, % 资产, % 自由保证金, % 自定义, %AB 前一天, %AB 前一周, %AB 前一个月。   R/TP 和 R/SL - 设置止盈和止损的关系。 这允许你设置相对于损失的利润大小。 例如, 1 : 1 - 这决定了 TP = SL 的大小。 2 : 1 - 这意味着 TP 是 SL 的两倍。 RR -
欢迎来到 Trade Manager EA——这是一个终极风险管理工具,旨在使交易变得更直观、精准和高效。它不仅仅是一个下单工具,而是一个用于无缝交易计划、仓位管理和风险控制的全面解决方案。不论您是新手交易员、资深交易员,还是需要快速执行的剥头皮交易员,Trade Manager EA 都可以满足您的需求,适用于外汇、指数、大宗商品、加密货币等各种市场。 借助 Trade Manager EA,复杂的计算已成过去。只需分析市场,在图表上用水平线标记入场、止损和止盈,设置您的风险水平,Trade Manager 就会立即计算出理想的头寸规模,并实时显示以点、账户货币计价的止损和止盈。每笔交易都得以轻松管理。 主要功能: 头寸规模计算器 :根据定义的风险瞬间确定交易规模。 简单的交易计划 :在图表上用可拖动的水平线直接计划交易,设置入场、止损和止盈。 实时显示 SL 和 TP :以账户货币、点或分显示止损和止盈,便于分析。 高级保护工具 盈亏平衡选项 : 基本盈亏平衡 :当您的交易达到设定水平时自动保护利润。 多级盈亏平衡 :设置多达 4 个级别以逐步保护利润。 尾随止损选项 : 基本尾随
Local Trade Copier EA MT5
Juvenille Emperor Limited
4.94 (149)
Local Trade Copier EA MT5 是一款快速、灵活的交易复制工具,用于在同一台 Windows 电脑或 Windows VPS 上的多个 MetaTrader 5 账户之间复制和管理交易。 它将本地交易同步与 Receiver 端的手数管理、风险管理、交易过滤、品种映射、交易管理和账户保护功能结合在一起。 只需约 1 分钟 即可完成 Transmitter 和 Receiver 终端的设置,并可在同一经纪商或不同经纪商的账户之间复制手动交易或 EA 交易。在合适的条件下,本地 MetaTrader 终端之间的交易信息可以在 0.5 秒以内 完成同步。实际交易执行速度取决于经纪商延迟、网络状况、电脑/VPS 性能以及终端负载。 购买前先试用免费演示版 您可以在 MT5 模拟账户上测试 功能完整的 Local Trade Copier EA MT5 免费演示版 ,每次可使用 4 小时 : 下载 Local Trade Copier EA MT5 免费演示版 将下载的文件放入: MT5 → 文件 → 打开数据文件夹 → MQL5 → Experts 然后重新启动 MT
Telegram to MT5 Multi-Channel Copier   可将您 Telegram 和 Discord 频道中的交易信号自动复制到 MetaTrader 5。无需机器人、无需浏览器扩展、无需手动复制。信号一到 Telegram 或 Discord,EA 几秒内就在您的终端开仓。 在复制某个频道之前,内置回测器还能告诉您该频道在您的账户上会有怎样的表现。 产品包含两个组件:一个监听您 Telegram 频道的 Windows 应用程序,以及在 MT5 终端执行信号的本 EA。同时提供 MT4 版本   点此 . 设置指南与应用下载:   https://www.mql5.com/en/blogs/post/768988 了解如何 回测任何 Telegram 信号频道 。 当前价格将来会上调。 工作原理 应用通过您自己的 Telegram 账号连接,因此能看到您关注的所有频道、群组、话题和机器人,包括私密和 VIP 频道。信号到达时,应用读取它,EA 按您的手数和设置在终端中开仓。 整个过程全自动,无需守在电脑前。专为 24/7 无人值守运行设计:Telegram 连接
================================================================================ POC BREAKOUT - V20.72. Full Professional Grade Toolkit ================================================================================ POC Breakout is a full MetaTrader 5 trading dashboard for discretionary traders who want breakout signals, Point of Control (POC) context, volume profiles, order flow, market structure, news, alerts, and advanced trade planning in one professional workspace. Attached directly to you
TradePanel MT5
Alfiya Fazylova
4.88 (170)
交易面板是一款多功能交易助手。该应用包含超过50种手动交易功能,并允许您自动执行大多数交易任务。 应用程序说明 : https://www.mql5.com/zh/blogs/post/761102 用于模拟账户的应用程序试用版: https://www.mql5.com/zh/blogs/post/762579 如何安装应用程序: https://www.mql5.com/zh/blogs/post/762580 如何在可视化模式下测试应用程序: https://www.mql5.com/zh/blogs/post/770278 如何在VPS MetaTrader上安装应用程序: https://www.mql5.com/zh/blogs/post/770196 贸易. 只需单击一下即可执行交易操作: 打開掛單和頭寸,並自動計算風險。 一鍵打開多個訂單和頭寸。 打開訂單網格。 按組別關閉掛單和頭寸。 反轉頭寸方向(關閉買入>打開賣出,關閉賣出>打開買入)。 鎖定頭寸(通過開啟缺少的頭寸,使買入和賣出頭寸的數量相等)。 一鍵部分關閉所有頭寸。 將所有頭寸的止盈和止損設置在同一價格水平。
Strategy Ledger Pro
Abdullah Uygar Tuna
5 (11)
现已支持中文。 Strategy Ledger Pro 是一款适用于 MetaTrader 5 的只读账户分析面板。它按智能交易系统(EA)、策略、品种和魔术号拆分账户结果,让您看清每一个的真实贡献。 面板支持 11 种语言:English、Français、Deutsch、Español、Italiano、Português、Русский、Türkçe、中文、日本語 和 한국어。 下载演示版之前请注意。 Market 仅在策略测试器中运行任何付费产品的演示版。本面板分析的是您自己账户上的交易,而策略测试器中没有可读取的账户历史,因此演示版会打开一个空面板并加以说明。这是演示机制的工作方式,并非产品的限制。 本描述中的视频展示了面板在真实账户上的运行效果。 详细的 使用手册 (英文)介绍了每项功能, AureusAI Trading Suite 群组欢迎交流讨论并发布公告。 MetaTrader 对整个账户只显示一个余额。当多个 EA 同时交易时,这个余额无法说明每个 EA 的贡献。Strategy Ledger Pro 读取账户历史,重建已平仓头寸,将其归入各个策略,并在一个
The Patch
Mian Rameez Ali
The Patch It never opens a trade. It walks behind the ones that did. Every open position, every pending order — checked twice a second for the one thing that's easy to forget: a stop, a target. Found bare, it doesn't ask. It writes the missing number in, measured in points from wherever the position began, and moves on to the next. No strategy, no opinion on direction. Just the quiet assumption that nothing should ever sit on the market unprotected — not because someone decided it shouldn't,
按照自己的交易规则复制 Telegram 信号 Telegram to MT5 Signal Trader 可将 Telegram 公开及私密频道和群组中的文字交易信号自动复制到 MetaTrader 5。通过一个桌面应用管理多个信号提供者和 MT5 账户,并为 每个提供者单独设置风险和交易参数 。 复制信号无需 Telegram 机器人,也无需配置 API。 只需通过手机号或二维码登录您自己的 Telegram 账户,然后选择您已加入的频道或群组。您无需创建机器人,也无需提供 Telegram API 令牌、API ID 或 API hash。 自行选择仓位大小,将平仓分配到多个止盈价位,并自动执行保本止损和移动止损。在跟随信号提供者的同时,掌握信号的实际交易方式。 本产品由这款 MT5 EA 和必须配合使用的 Windows 桌面应用组成。请参阅 安装指南及应用下载 。 管理多个信号提供者和账户 为每个提供者单独设置: 为每个频道设置专属的仓位计算方式、入场规则、止损、止盈和交易管理参数。 灵活分配至不同账户: 将同一提供者的信号复制到多个已连接的 MT5 账户,并为每个账户使用不
Floor Watch
Syed Tauqeer Hussain Shah
Floor Watch One number, watched every thirty seconds: how far equity has fallen since the day began — or since its highest point, if it's told to trail the peak instead of the open. Cross the line and it doesn't argue. Every open position closes, every pending order vanishes, and anything that slips through afterward gets shut the moment it appears. Not asked. Removed. The floor holds until the clock turns 5 AM Pakistan time — then, and only then, does the day start over. One rule. No except
一次购买,即可免费获得我所有 MT4 和 MT5 指标,包括现有指标及未来发布的指标。 购买后请联系我,了解领取方式。 计划每售出 10 份后提价 50$,最高至 999$。 实际价格以结算时的 Market 标价为准。 保留您信赖的指标,让相关操作自动完成。 您的信号。您的规则。您的交易执行。 您已有信赖的 MT5 指标,却仍需盯盘、等待信号、计算手数、下单并手动管理每个持仓? Stratiora Signal Engine MT5 将这些环节连接起来。它可将兼容的买入和卖出缓冲区信号转化为完整的自动化流程:入场、交易量计算、止损、止盈、过滤、持仓管理及账户保护。 更换指标或交易思路时,无需每次另行定制 EA。您可以使用同一个灵活的执行引擎,自行决定每个信号的交易方式。 您的信号。您的规则。您的交易执行。 为什么开发 Stratiora 许多交易者已有熟悉且信赖的指标,但仍需手动盯盘、等待信号、计算手数、下单和管理持仓。 Stratiora 的目的就是连接这些步骤。 指标仍负责生成交易信号,Stratiora 负责按您的规则执行和管理。您决定何时读取信号、如何计算交易量、设置哪些保
Grid Manual MT5
Alfiya Fazylova
4.73 (22)
Grid Manual是一个交易面板,用于处理订单网格。 该实用程序是通用的,具有灵活的设置和直观的界面。 它不仅可以在亏损方向上设置订单网格,还可以在盈利方向上设置订单网格。 交易者不需要创建和维护订单网格,实用程序会这样做。 打开一个订单就足够了,Grid manual会自动为它创建一个订单网格,并伴随它直到非常关闭。 完整说明和演示版 此處 。 该实用程序的主要特性和功能: 伴隨以任何方式打開的訂單,包括從移動終端打開的訂單。 適用於兩種類型的網格:“限制”和“停止”。 使用兩種方法計算網格間距:固定和動態(基於 ATR 指標)。 允許您更改未結訂單網格的設置。 顯示圖表上每個網格的盈虧平衡水平。 顯示每個網格的利潤率。 允許您一鍵關閉網格中的盈利訂單。 讓您一鍵關閉每個訂單網格。 允許您對訂單網格應用追踪止損功能。 允許您在訂單網格上應用將訂單網格的止損轉移到盈虧平衡水平的功能。 相對於訂單網格的盈虧平衡水平自動重新排列止盈(僅在限價網格模式下,距離取決於所選的計算類型:“保守”或“激進”)。 最多可管理 20 個訂單網格,每個網格最多可包含 100 個訂單。 計算初始手數時,
Power Candles 策略扫描器——自优化多符号设置查找器 Power Candles策略扫描器 采用与Power Candles指标相同的自优化引擎,可同时扫描您“市场观察”中的所有交易品种。一个面板即可显示当前哪些品种在统计上具备交易价值、每种策略的最佳应用方向、最优止损/止盈组合,并在新信号触发时立即向您发送提醒。 本工具是 Stein Investments 生态系统的一部分 - 18+ 款工具,加上 Max,您的一对一 AI 交易导师。  随时在线,深入了解每一款指标,在您需要梳理思路的那一刻就在那里。  立即认识他: https://stein.investments 您的全面市场监控。每个交易品种超过3,000次自动优化。2种警报类型。一键切换图表并采取行动。 为何您需要此工具 大多数多标的扫描器仅展示价格 波动 。每只股票的波动率、百分比变化、RSI。您仍需自行摸索正确的策略、合适的止损位以及理想的入场阈值。Power Candles策略扫描器针对每只股票自动解答这些问题,仅在数学验证过的交易设置中触发实际入场信号时才会向您发出提示。这就是全部卖点。 自动
MT5 to Telegram Signal Provider 是一个易于使用且完全可自定义的工具,它允许向 Telegram 的聊天室、频道或群组发送 指定 的信号,将您的账户变为一个 信号提供商 。 与大多数竞争产品不同,它不使用 DLL 导入。 [ 演示 ] [ 手册 ] [ MT4 版本 ] [ Discord 版本 ] [ Telegram 频道 ]  New: [ Telegram To MT5 ] 设置 提供了逐步的 用户指南 。 不需要了解 Telegram API;开发者提供了您所需的一切。 关键特性 能够自定义发送给订阅者的订单详情 您可以创建分层的订阅模型,例如铜、银、金。其中金订阅获得所有信号等。 通过 id、符号或评论过滤订单 包括执行订单的图表截图 在发送的截图上绘制已关闭的订单,以便额外核实 延迟发送新订单消息的可能性,以便在发送前对位置进行调整 订单详情完全透明: 新的市场订单*带截图 订单修改(止损、获利) 已关闭的订单*带截图 部分关闭的订单** 新的挂单 修改的挂单(进场价格) 挂单激活(作为新的市场订单附加) 已删除的挂单 历史订单报告
Daily Trading Limiter
AL MOOSAWI ABDULLAH JAFFER BAQER
5 (8)
• Please test the product in the Strategy Tester before purchasing to understand how it works. • If you face any issues, contact me via private message—I’m always available to help. • After purchase, send me a screenshot of your order to receive a FREE EA as a gift. Daily Trading Limiter — the rule you cannot break Every trader knows the number. Three trades. Two percent. One bad day and stop. And every trader has watched themselves take the fourth trade anyway. The problem was never knowing th
Welcome to ENTRY IN THE ZONE with SMC MULTI TIMEFRAME SPECIAL BENEFIT / FOR OUR MQL5 CUSTOMERS FREE ACCESS TO THE NEW TOOL  — COMING SOON — Learn more on our official website  : https://www.fableedge.net Entry In The Zone with SMC Multi Timeframe is a real-time market analysis tool based on Smart Money Concepts (SMC), designed to analyze market structure, price direction, and key trading zones. It supports both Single-Timeframe and Multi-Timeframe Analysis, providing a clearer view of overall ma
VirtualTradePad PRO SE MT5 — MetaTrader 5 专业交易控制中心 VirtualTradePad PRO SE 是一款基于图表的高级交易面板,也是适用于 MetaTrader 5 的交易管理工作区。它专为希望获得更快执行、更清晰持仓控制、结构化交易管理、可视化价位规划,以及直接在图表上完成专业交易流程的交易者而设计。 这不仅仅是一个 BUY / SELL 面板。PRO SE 将手动交易、挂单、持仓管理、部分平仓、篮子利润/亏损控制、加仓均价层级、ATM 规则、信号监控、实时市场信息、策略测试器 (Strategy Tester) 流程以及面向 VPS 的运行方式整合到一个互相关联的界面中。 MT4 版本 | 完整说明和截图 | 如何购买 | 如何安装 | 如何获取日志文件 | 如何测试与优化 | Expforex 的所有产品 为什么交易者会选择这套面板 图表一键交易 ,并支持键盘快速操作 快速完成开仓、平仓、修改、反转、锁仓与部分平仓 深度控制仓位、挂单、总利润与风控逻辑 自动参数计算,减少手动输入与重复劳动 为什么 PRO SE 比标准手动交易更高
Trading Chaos Expert
Hennadii Stanilevych
5 (11)
世界上没有本软件的同等产品,它代表一个覆盖交易信号的通用交易 "控制台",自动入场,设置止损和止盈,还有在单一窗口里同时进行多交易尾随终止。EA 的 "三次点击" 直观控制,确保在不同计算机上全方位使用所有功能,包括平板电脑。 与附加的信号指标交互来标记图标,给出实际市场的全貌,EA 令您做出正确的选择,以及在大多数情况下成为胜者一方。内置资金管理算法, 还有自动计算手数, 虚拟订单交易, 以及一些其它从崩溃账户里挽救交易者的 "诀窍"。它不是一个 "黑盒子"。而是一个深思熟虑的交易员的不可或缺的助理, 至少要尝试一次它的动作。 注,在面板上形成的 EA 不能在策略测试员中测试。可以在您的模拟账户里以实时模式检查它, 您可以下载本 EA 的免费版 - 混沌交易 EA 演示 。 EA 表现为一个面板,带有内置功能的交易机器人的,自动基于交易者可直观检查的交易信号入场,完全按照比尔·威廉姆斯的策略“混沌交易:第二版”和“新贸易维度”。在单独的窗口里,EA 识别价格走势的导向,用于指定品种和时间帧的全自动交易模式,也可以多品种并发。 它同时分析 MetaTrader 5“市场观察”窗口中显示
Trade copier MT5
Alfiya Fazylova
4.61 (56)
Trade Copier 是一种专业实用程序,旨在复制和同步交易账户之间的交易。 复制发生从供应商的帐户/终端到收件人的帐户/终端,安装在同一台计算机或 vps 上。 在购买之前,您可以在演示帐户上测试演示版本。 演示 这里 。 完整说明 这里 。 主要功能和优点: 支持复制MT5>MT5、MT4>MT5、MT5>MT4,包括МТ5 netting账户。 供应商和收件人模式在同一产品中实现。 简单直观的界面,允许您直接从图表中实时控制复制。 连接中断或终端重新启动时不会丢失设置和位置。 允许您选择要复制的符号,也可以替换接收者的符号,例如 EURUSD> USDJPY。 允许为每个符号设置个性化的复制设置。 支持回拷贝。 能够仅复制某些订单。 允许您设置开仓交易价格的最大差异和最大时间延迟。 正确复制部分订单关闭的执行。 计算复制手数的几种方法。 同步止盈和止损。有几种方法可以计算它们的位置。 支持通过执行在“Market account”上工作,其中 SL / TP 仅在开仓后设置。 如何使用简单的设置复制交易 将供应商终端和接收终端安装在同一台计算机或 VPS 上。 在供应商终端上
Exp COPYLOT CLIENT for MT5
Vladislav Andruschenko
3.97 (35)
适用于 MetaTrader 5 的专业交易复制器 快速、专业、稳定可靠的 交易复制器 ,适用于 MetaTrader 。 COPYLOT 可在 MT4 和 MT5 终端之间复制 Forex 交易,并支持 Hedge 和 Netting 账户。 COPYLOT 的 MT5 版本支持: - MT5 Hedge → MT5 Hedge - MT5 Hedge → MT5 Netting - MT5 Netting → MT5 Hedge - MT5 Netting → MT5 Netting - MT4 → MT5 Hedge - MT4 → MT5 Netting MT4 版本 完整说明 + DEMO + PDF 如何购买 如何安装 如何获取日志文件 如何测试和优化 Expforex 的所有产品 您也可以将交易复制到 MT4 终端(MT4 → MT4,MT5 → MT4): COPYLOT CLIENT for MT4 COPYLOT 是一款专业的交易和持仓复制器,可同时与 2、3 甚至 10 个终端协同工作。 支持从 模拟账户和投资者账户 复制,也支持同时在多个终端上运行。 您可以使
Telegram To MT5 Ultra
Mirel Daniel Gheonu
5 (5)
Telegram To MT5 — 信号复制器 将您的 Telegram 频道中的交易信号变成真实的 MT5 订单 — 自动执行,可用于任意数量的账户,风险与规则完全由您掌控。 Telegram To MT5 将您已在 Telegram 关注的 VIP / 信号频道连接到您的 MetaTrader 5 终端。一个免费的配套桌面应用读取消息(即使是禁止机器人的频道),而本 EA 在您的账户上执行这些信号 — 应用您自己的风险设置、品种映射、止盈处理、交易时段与新闻过滤。 它是一个信号复制器,而非黑箱策略:由您决定信任哪些频道,以及每笔交易如何计算手数和管理。 分步设置与配套应用安装指南 工作原理 [您的 Telegram 频道] -> [配套桌面应用] -> [MT5 + 本 EA] -> 订单 配套桌面应用(免费,已包含)使用您的 Telegram 账户登录并监视您所选择的频道。即使是禁止机器人的 VIP 频道也能正常工作,它通过一个私有、加密的本地桥接转发每条消息。 本 EA 挂在一个图表上,在 MT5 接收这些信号,并按照您的规则开仓 / 管理交易。 应用与 EA 之间的连接是位于
Trade Copier Ultimate
Janitha Sandaruwan Amaradasa Wickramasingha Arachchilage
5 (5)
Trade Copier Ultimate - Telegram 到 MT5 信号复制器 Trade Copier Ultimate 可将 Telegram 交易信号自动复制到 MetaTrader 5。EA 能读取信号消息,识别交易品种、订单类型、入场价格、止损、止盈目标以及部分更新指令,然后根据您设置的手数和风险参数,在 MT5 中执行或管理交易。 它不只是一款基础的 Telegram 到 MT5 跟单工具。TCU 还支持 Telegram Bot API 和用户账户 Bridge 工作流程、Discord 信号路由、本地 MT5 到 MT5 跟单、将 MT5 交易广播到 Telegram 或 Discord、图片信号识别、最多 TP5 的多止盈执行、TP OPEN 跑单仓位、虚拟多止盈模式、入场区间处理、挂单、经纪商交易品种匹配以及 Prop Firm 风险控制。 其他资料与使用说明 下载免费演示版  -  快速设置与使用手册  -  下载 NTS Bridge    点击这里测试您的信号格式 --->>> 免费演示版:   购买前可在模拟账户上测试完整的 EA 和 Brid
YuClusters
Yury Kulikov
4.93 (43)
Attention: You can view the program operation in the free version  YuClusters DEMO .  YuClusters is a professional market analysis system. The trader has unique opportunities to analyze the flow of orders, trade volumes, price movements using various charts, profiles, indicators, and graphical objects. YuClusters operates on data based on Time&Sales or ticks information, depending on what is available in the quotes of a financial instrument. YuClusters allows you to build graphs by combining da
Trade Manager DaneTrades
Levi Dane Benjamin
4.23 (30)
交易管理器可帮助您快速进入和退出交易,同时自动计算风险。 包括帮助您防止过度交易、报复性交易和情绪化交易的功能。 交易可以自动管理,账户绩效指标可以在图表中可视化。 这些功能使该面板成为所有手动交易者的理想选择,并有助于增强 MetaTrader 5 平台。多语言支持。 MT4版本  |  用户指南+演示 交易经理在策略测试器中不起作用。 如需演示,请参阅用户指南 风险管理 根据%或$自动调整风险 可选择使用固定手数或根据交易量和点自动计算手数 使用 RR、点数或价格设置盈亏平衡止损 追踪止损设置 最大每日损失百分比,在达到目标时自动平仓所有交易。 保护账户免遭过多提款并阻止您过度交易 最大每日损失(以美元为单位)在达到目标时自动关闭所有交易。 保护账户免遭过多提款并阻止您过度交易 一键实现所有交易的盈亏平衡 自动计算从手机/电话发送的交易的风险 OCO 在设置中可用 交易和头寸管理 通过设置每月、每周、每天、每小时或每分钟的最大交易次数,停止过度交易和报复性交易。 高级挂单管理。 调整何时关闭挂单的规则 追踪挂单 支持市价订单和挂单 每日最大利润目标(以美元为单位)以确保头寸并停止
Signal TradingView to MT5 Pro Automator TradingView 与 MetaTrader 5 之间的即时专业执行 使用最强大的桥梁,将 TradingView 警报与 MT5 中的实际执行连接起来,实现交易策略的自动化。这款 Expert Advisor 专为要求速度、灵活性和完美风险管理的交易者设计,可将任何警报消息转化为精确的市价或限价订单。 优势与特点 通用解析引擎(专有): 先进技术,能够自动识别并提取任何警报格式中的数据。您不再受限于单一的死板格式;系统会自动理解交易品种(Symbol)、操作(Action)、价格(Price)、止损(SL)和止盈(TP)。 实时执行: 极速轮询技术(低于 1 秒),经过优化可将延迟降至最低。接收到信号后,订单将在毫秒内执行。 机构级风险管理: 基于以下方式自动精确计算手数: 净值/余额百分比(% of Equity/Balance): 每笔交易承担固定账户百分比的风险。 风险金额(Risk Amount): 设定在触发止损时损失的固定货币金额(例如:100 美元)。 固定手数(Static Lots)
Footprint Chart Pro — Professional OrderFlow EA for MetaTrader 5 Version 6.34 | Professional tool for real traders | Institutional-Grade Visualization DEMO USERS - PLEASE SELECT EVERY TICK / REAL TICK WHEN TESTING AND YOU HAVE DOWNLOADED HISTORICAL DATA. IF YOU SEE A WAITING SCREEN AND IT IS NOT DOWNLOADING, IT MEANS YOU HAVE LOW HISTORICAL DATA. TRY 1 MIN AND 5 MIN FIRST ON 1 DAY DATA. ONE DAY DATA SHOULD BE THE NEWEST AND MOST CURRENT DATE. PLEASE WAIT UNTIL THE MARKET HAS ROLLED OVER PERIOD.
Trade Indicator Assistant   is a powerful MT5 utility designed to turn indicators into automated trading systems. Its main feature is the ability to automatically detect an indicator’s   BUY and SELL signal buffers , without requiring you to know the buffer numbers, search through indicator settings, or modify the indicator source code. Bonus Indicator:   After purchasing Trade Indicator Assistant, contact me to receive   Trade Signal Pro   completely free as a bonus indicator. [Download Demo V
Anchor Trade Manager
Kalinskie Gilliam
5 (9)
Your EAs cannot see each other, but Anchor can. Anchor gives you one place to coordinate your EAs, manage risk, and decide when trading is allowed. It works alongside the trading bots you already use without any changes to them. The Problem One EA opens a trade. Then another starts trading. The next thing you know, you wake up to multiple grids built across your account. Each EA may be doing exactly what it was designed to do, but together they can place far more risk on your account than you in
HINN MagicEntry Extra
ALGOFLOW OÜ
4.74 (19)
HINN MAGIC ENTRY – the ultimate tool for entry and position management! SIMPLE. FASTEST. INTUITIVE. MAX AUTOMATED. Place orders by selecting a level directly on the chart! full description   ::  demo-version  :: 60-sec-video-description Key features: - Market, limit, and pending orders - Automatic lot size calculation - Automatic spread and commission accounting - Unlimited partitial take-profits  - Breakeven and trailing stop-loss and take-profit  functions - Invalidation leves - Intuitive, a
EA Overfitter
Stephen J Martret
5 (1)
回测看起来很漂亮。但它明天、下周、下个月还能继续赚钱吗? EA Overfitter 让您的 EA 在 100 段它从未见过的价格历史上重新运行。一个分数告诉您这个优势是否真实。 回测告诉您的,是 EA 在某一段价格历史上的表现——那段恰好发生过的历史。您无法从中判断,这个结果有多少来自策略本身,又有多少只是那一条特定路径带来的。 EA Overfitter 回答的正是这个问题。它构建最多 100 段您的 EA 从未交易过的合成价格历史,让策略在全部这些历史上重新运行,并展示它所产生的完整结果区间。您得到的不再是一条幸运或不幸路径上的单个数字,而是一幅真实的图景:策略在陌生数据上多久能赚钱、典型结果是什么样(而不是最好的那一次),以及您的回测离它有多远。 这些世界是由您自己的近期历史重建而成,因此这不是预测——任何从历史数据出发的检验都不可能是预测。它告诉您的是:这个优势是否依赖于价格的某一种特定排列,以及回测数字距离典型结果有多远。在投入资金之前,这才是值得回答的问题。 三个步骤 1. 构建。在图表上选择时间区间和世界数量,然后按 Build。EA Overfitter 会
作者的更多信息
Volatility Atlas
Abraham Correa
motive is to turn market volatility and selected time/session reference points into a visual price grid . Instead of claiming to predict price direction, it gives the trader a structured way to judge where current price sits relative to ATR-derived or fixed-distance ranges. Potential Volatility awareness: ATR-based spacing expands and contracts with measured price volatility. Price-range context: Multiple grid levels show how far price has traveled from a reference point. Session analysis: The f
FREE
Displays broker-provided LONG and SHORT swap values for selected instruments in a full-chart, dynamically sized table. The Swaps Monitor Table provides a simple way to view the swap rates supplied by your broker for multiple trading instruments at once. The table can display instruments from Market Watch, all available instruments, or a manually selected list , allowing traders to monitor swap costs without opening each symbol individually. The indicator automatically adjusts the table cells an
FREE
Omnirange
Abraham Correa
is an exit manager for trades you open yourself. It does not open positions and it does not send signals. After a manual buy or sell, it gives that trade a stop and up to six exit stages based on volatility. Three stages come from Average True Range, each with its own timeframe. Three come from completed range: daily (ADR), weekly (AWR), and monthly (AMR). Each stage can be switched on or off. Enabled stages are sorted by distance. Nearer stages trail the stop. The furthest is posted as the take
FREE
Automated Timeframe cycling with Symbols centered.  Force every timeframe onto one clock window, so the story you see on Daily is the same story you are slicing on H4, H1, and M1.  Traders usually flip timeframes and lose the span. A Daily chart shows a few weeks, then M15 shows a few hours, and the eye treats them as different markets. TASSERACT locks the window to N bars of the highest enabled timeframe — default 10 Daily — and maps every lower timeframe to that same stretch. You stay inside o
FREE
Market Watch's Symbols,  Lot Sizing choice,  Spread, & Price are shown. The app is visually customizable. Click on any Symbol for interaction with its chart!   Trader Market Watch is a display-only MetaTrader 5 board. It fills the chart tab with the symbols already in Market Watch and does not place or modify orders. Each row shows the symbol, the spread in pips, and the price. Two lot columns sit beside them: the lot size that uses your chosen percent of balance as margin, and the largest
FREE
Quote Cost Parity is  a MetaTrader 5 chart panel for forex majors and minors that share a quote currency. Pairs with the same quote have the same pip cost for a given lot. The indicator uses that correspondence directly: it calculates the cost once for the group, then shows that cost for three lot sizes. It acknowledges only these quote groups. JPY: USDJPY, EURJPY, GBPJPY, AUDJPY, NZDJPY, CADJPY, CHFJPY. Source: USDJPY. CHF: USDCHF, EURCHF, GBPCHF, AUDCHF, NZDCHF, CADCHF. Source: USDCHF. CAD: US
FREE
Automated Timeframe cycling with Symbols centered.  Force every timeframe onto one clock window, so the story you see on Daily is the same story you are slicing on H4, H1, and M1.  Traders usually flip timeframes and lose the span. A Daily chart shows a few weeks, then M15 shows a few hours, and the eye treats them as different markets. TASSERACT locks the window to N bars of the highest enabled timeframe — default 10 Daily — and maps every lower timeframe to that same stretch. You stay inside o
FREE
is an on-chart pre-trade planner for the symbol on that chart. It clears the price and time scales and fills the tab with a live reading of this account against this symbol: spread, pip value, point value, an ATR stop, three ATR targets, and ten lot sizes sized from a percent of balance. Targets are reduced by the live spread. The stop is increased by it. Commission and planned swap are then applied, so the money and percent figures are net of those costs before a buy or sell. It does not place
FREE
visual trade planner for MetaTrader 5. It draws multi-timeframe ATR reward and stop zones on the chart so you can judge distance and payoff before you place the trade yourself. It does not send, modify, or close orders. Motive A single ATR on the chart timeframe often hides the larger and smaller ranges a trade is actually working against. This EA stacks three take-profit slices, each from its own timeframe, period, and multiplier, then places an ATR stop and an optional fixed stop beside them.
FREE
is a panel that groups FX Major & Minor quote currencies and shows the shared pip or point cost of a trade. View that cost for three fixed lot sizes or three account-balance risk percentages. Currency Cost Constellation is a MetaTrader 4 chart panel for forex majors and minors that share a quote currency. Pairs with the same quote have the same pip cost for a given lot. The indicator uses that correspondence directly: it calculates the cost once for the group, then shows that cost for three lo
FREE
Market Watch's Symbols,  Lot Sizing choice,  Spread, & Price are shown. The app is visually customizable. Click on any Symbol for interaction with its chart!   Trader Market Watch is a display-only MetaTrader 4 board. It fills the chart tab with the symbols already in Market Watch and does not place or modify orders. Each row shows the symbol, the spread in pips, and the price. Two lot columns sit beside them: the lot size that uses your chosen percent of balance as margin, and the largest
FREE
BirdsIview
Abraham Correa
is a user-friendly MetaTrader 4 indicator that creates a centralized dashboard for traders to oversee market symbols simultaneously across different timeframes, presenting price movements through simple dots or miniature candlestick charts, complemented by volume indicators to facilitate quick assessments of market trends and fluctuations. It automatically resizes grid cells according to the number of bars shown per timeframe for better use of screen space, features adjustable color schemes fo
FREE
Predetermination
Abraham Correa
5 (1)
Predetermination is an exit manager for trades you open yourself. It does not open positions and it does not send signals. After a manual buy or sell, it gives that trade a stop and up to six exit stages based on volatility. Three stages come from Average True Range, each with its own timeframe. Three come from completed range: daily (ADR), weekly (AWR), and monthly (AMR). Each stage can be switched on or off. Enabled stages are sorted by distance. Nearer stages trail the stop. The
FREE
is designed to simplify switching between trading instruments directly from the active chart. It allows traders to cycle through symbols listed in the broker's Market Watch using on-chart navigation buttons or keyboard arrow keys . The indicator's primary motive is to make multi-symbol market analysis faster, more convenient, and more organized by reducing the need to manually locate and open individual charts. Key Features Previous / Next Navigation: Switch between Market Watch symbols using t
FREE
is designed to enhance the visual representation of financial charts in MetaTrader 4 by dynamically altering the colors of various chart elements, including candlesticks, bars, line charts, and volume bars. Its primary purpose is to improve trader intuition and engagement during market analysis by introducing smooth, cyclical color transitions that can highlight momentum shifts, trends, or volatility without overwhelming the display. This functionality is particularly beneficial for traders who
FREE
根据波动性,奖励交易头寸的潜在风险基于平均真实范围显示。 点击"买入或卖出"按钮时,会显示风险回报框! ATR计算的一个效用,为一个不属于何时关闭交易的艰难决定的问题感到高兴。 这件事将有助于你的风险管理决定.  规格说明 平均真实范围是一个常用的指标,以点或价格衡量市场的波动性。 真实范围是在任何给定时间段内烛台的最低交易价格和最高交易价格之间的差额。 平均真实范围,在所有,平均这些高点和低点的"前"天。 例如,ATR指标的默认设置为我们提供了14天的周期。 ATR收集点值的高点和低点,除以14天。 但当然,这超出了通用指标ATR。 事实上,三个完全不同的TPs完全依赖于他们自己的时间框架来实现不同的pip消耗。 烛台的规则在技术上是不同的每个时间框架。 因此,当我们使用相同的时间段时,我们会发现每个时间段的结果不同。  例子:: 时间段/天数占:14/时间段:M30   时间段/天数占:14/时间段:H1 时间段/天数占:14/时间段:H4  ^这些将提供不同的平均真实范围^  这里是我喜欢3TP的权力所在和原因:理论上,尾随可以发生在第一个TP朝向第二个TP。 第三个T
FREE
Table MATR
Abraham Correa
A Market Watch multi-timeframe ATR dashboard that turns a chart into a full-screen table showing each selected symbol’s recent volatility across multiple timeframes. It calculates ATR for the symbols visible in Market Watch, then displays the result in pips, points, or raw price units. Its practical use is volatility scanning, quickly finding instruments and timeframes that are moving enough—or quietly enough—for your trading style.                                Period that is worth using Sty
FREE
It computes BUY and SELL lot sizing in either % of balance or in fixed intervals. In market orders, this EA contains the adaptive slippage, logs tickets for instant confirmation of opening trades, and contains every market symbol at a glance. Real-time balance/equity display keeps margin health in view without tab-switching, toggling spread if needed for liquidity checks. Compact left-panel layout minimizes screen real estate, empowering blind trades where speed trumps overanalyze—perfect for
FREE
Candlestick MATR
Abraham Correa
Analyze volatility by clicking on a specific candlestick, which triggers the display of horizontal grid lines centered around the candlestick’s closing price, spaced by multiples of the calculated ATR. A vertical line highlights the selected candlestick, and an optional text label can display the ATR value in pips above the candlestick. The indicator is lightweight, using no buffers, and relies on chart objects for visualization. It includes error handling for invalid candlestick selections and
FREE
Bigger chart labels would allow the user to be entirely aware of which chart he/she is on. Each chart window is unique, containing different patterns and economic motives so acknowledging the chart window would be absolutely essential! There are well known Economic Time Zones included in clear view, by choice!    Simple does it! Use your computing mouse scroller, clicking with the right finger on the label, in order to customize the label properties. From there, choose your preferred color, fon
FREE
This script paces itself to zoom into the deepest setting of ZOOM +     You may be in tune to know a few keyboard easter eggs. Pressing the  minus <->  button has the capability to Zoom the Chart Outward! Interesting to see the price reevaluate itself in perspective. This we could see is quite contagiously useful if we wanted to be quick with analyzing, examining through your tools, in your plans and such. So, if you ever wanted to zoom IN and OUT, here is Your play around with the chart poin
FREE
Grid MATR
Abraham Correa
Grid MATR is designed to map price against dynamically measured or fixed ranges so traders can better visualize volatility, market extension, and session-based price behavior—while requiring independent analysis for direction and trade decisions.  The motive is to turn market volatility and selected time/session reference points into a visual price grid.  Instead of claiming to predict price direction, it gives the trader a structured way to judge where current price sits relative to ATR-deriv
FREE
Symbol Cycler
Abraham Correa
Symbol Cycler is a lightweight on-chart utility that lets you quickly switch between symbols in your Market Watch list using two simple arrow buttons (). With a single click, you can scroll forward or backward through your predefined symbols without leaving the chart. Key Features: One-click symbol switching from the chart Works with your Market Watch list order Buttons can be placed in any chart corner or even the center Timeframe remains locked while switching symbols Clean, responsive UI
FREE
The SyncAllCharts indicator streamlines trading by automatically aligning all open MetaTrader 4 charts to the symbol of the chart where it’s applied, saving traders time and effort when analyzing a single asset across multiple timeframes or setups. With a customizable "Main Sync" label to identify the lead chart, it ensures a clear, clutter-free workspace, enhancing workflow efficiency and consistency for traders monitoring one currency pair or symbol.
FREE
The SymbolicTimeFramingUniverse indicator for MetaTrader 4 (MT4) is designed to enhance chart navigation by displaying the current symbol and timeframe as stacked labels directly on the chart window. It provides precise alignment and customization options, including positioning in the center or corners, adjustable offsets, font styling, and layer controls for visibility (such as background placement or color flashing). This tool supports professional trading workflows by ensuring quick identific
FREE
An on‑chart, data‑driven pre‑trade planner that turns your broker’s live market properties into clear, actionable numbers. It consolidates spread, commission, swaps, ATR‑based stop/targets, pip/point value and 10 risk‑profile lot sizes into one compact panel that auto‑scales to any chart size. The display is direction‑agnostic (no LONG/SHORT duplication) and emphasizes total trade cost and true risk/reward before you click “Buy/Sell.” What it shows (at a glance) Time & price context  (Local/Serv
FREE
Designed to mark a specific price and time point on an MT4 chart based on a single mouse click, synchronizing this data across all timeframes for the same symbol. Its primary purpose is to help traders pinpoint and track critical levels or events (e.g., support/resistance or entry points) with persistent visual markers. The indicator uses dashed lines for price and time crosshairs, accompanied by labels that dynamically adjust to stay within chart boundaries, ensuring clarity regardless of win
FREE
StainGlass MATR
Abraham Correa
Its primary motive is to overlay horizontal lines spaced according to multiples of the Average True Range (ATR), centered on a reference price from defined periods such as trading sessions, candlestick counts, or 12-hour intervals. This facilitates the identification of potential support and resistance levels or expected price ranges. Additionally, it marks major forex trading sessions (Sydney, Tokyo, London, and New York) with arrows to provide contextual awareness of market hours, enhancing d
FREE
Labels
Abraham Correa
Prints  ALL current chart's symbol and timeframe as customizable labels, ensuring precise anchoring and automatic repositioning during window resizes, timeframe switches, or other chart events. It supports layered display options (background, forefront, or combined color modes) for enhanced visibility without obstructing price data. The accompanying script facilitates global application by attaching or updating the indicator across all open charts in a single execution, promoting efficiency in m
FREE
Activation initiates the sequence from the initial symbol in the Market Watch roster, forming a perpetual loop that continues until deactivation. The system employs global terminal variables to sustain operational continuity amid symbol-induced reinitializations, thereby ensuring uninterrupted performance. This EA should not be checked off as 'Allowed live Trading' and is functional with that checkmark box, when uploading the EA. Principal advantages encompass augmented productivity in overseein
FREE
筛选:
无评论
回复评论