Nova Multi Timeframe Pivots

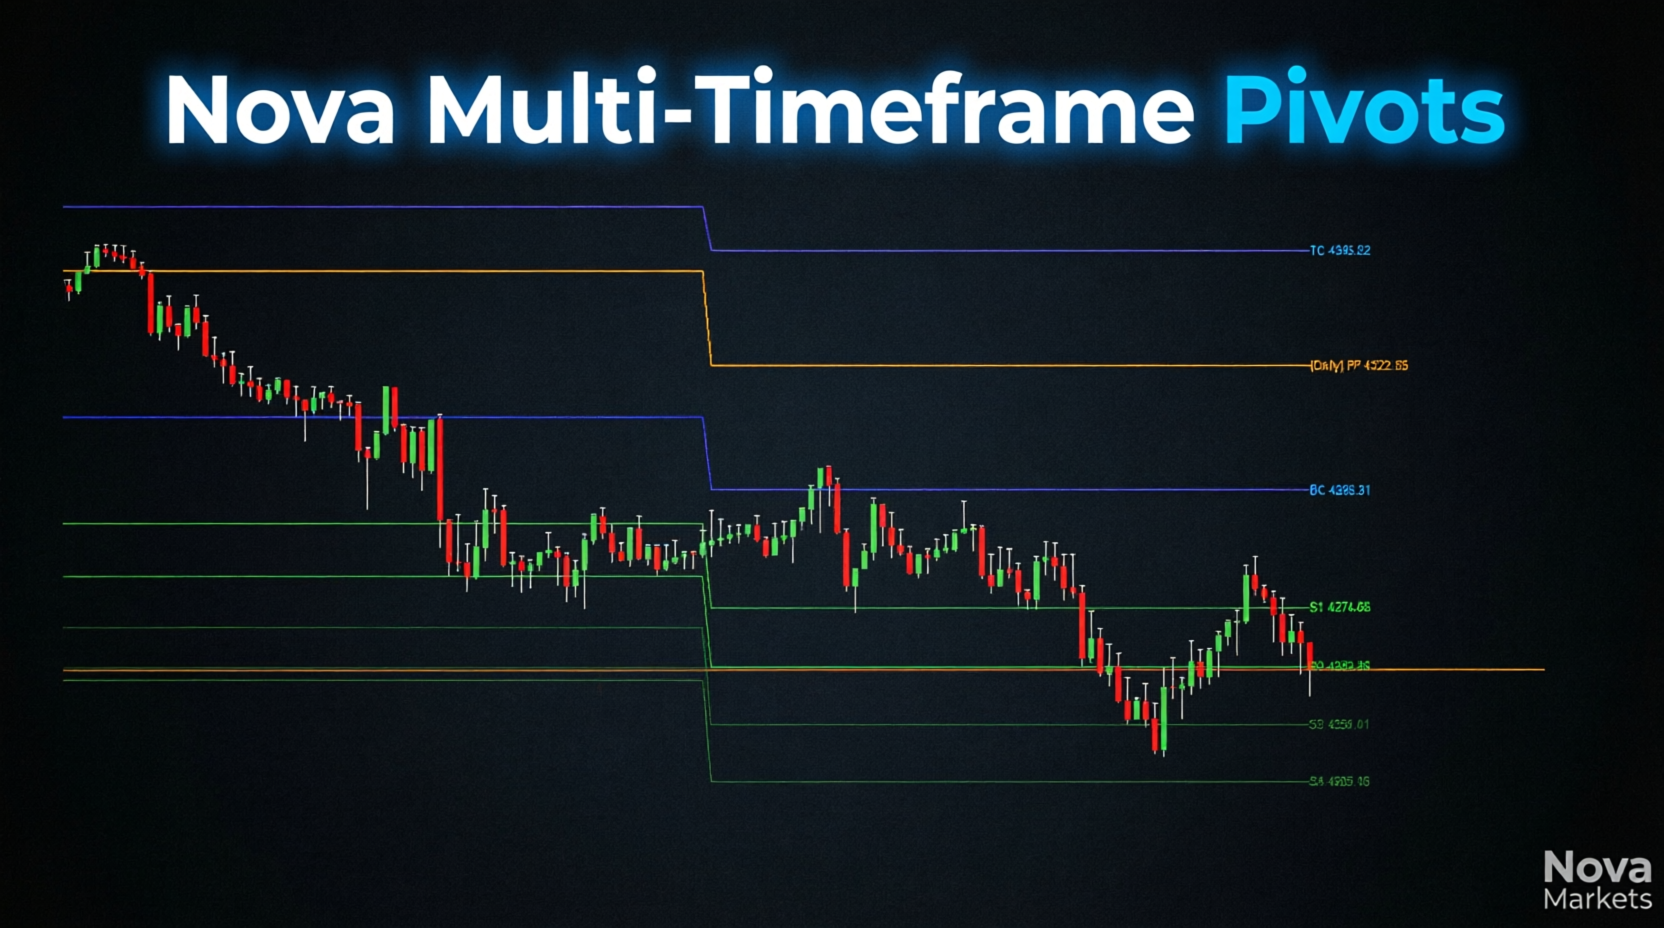
Nova Multi-Timeframe Pivots Institutional Structure. Multi-Timeframe Precision. Zero Clutter.
Stop drawing messy, subjective support and resistance lines by hand. The market’s true turning points are calculated by math and liquidity, not guesswork. Nova Multi-Timeframe Pivots automatically plots institutional-grade pivot levels across multiple timeframes, giving you an objective, clean, and highly accurate map of market structure.
Whether you are scalping the London open or swing trading the weekly trend, this indicator ensures you always know where the major reaction zones are before price gets there.
Core Features
1. Comprehensive Multi-Timeframe Mapping
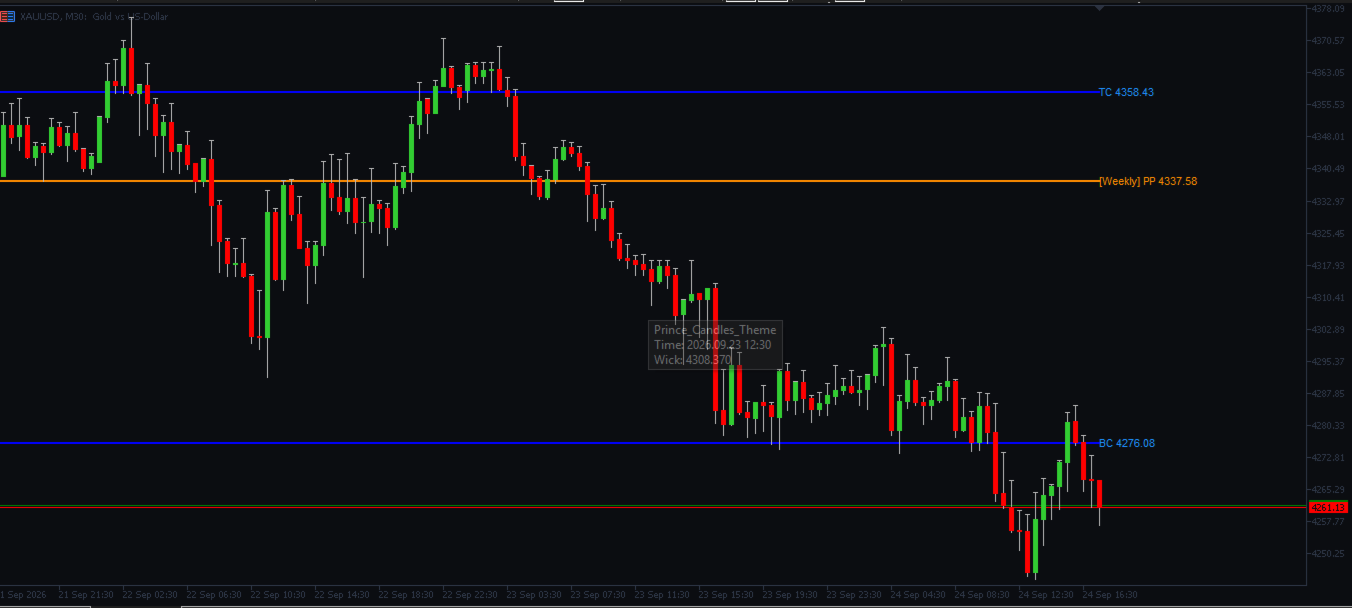
  • Daily, Weekly, and Monthly Pivots: Instantly visualize the key structural levels for the current day, week, and month. The indicator automatically updates and shifts levels as new sessions begin, ensuring your chart is always current.
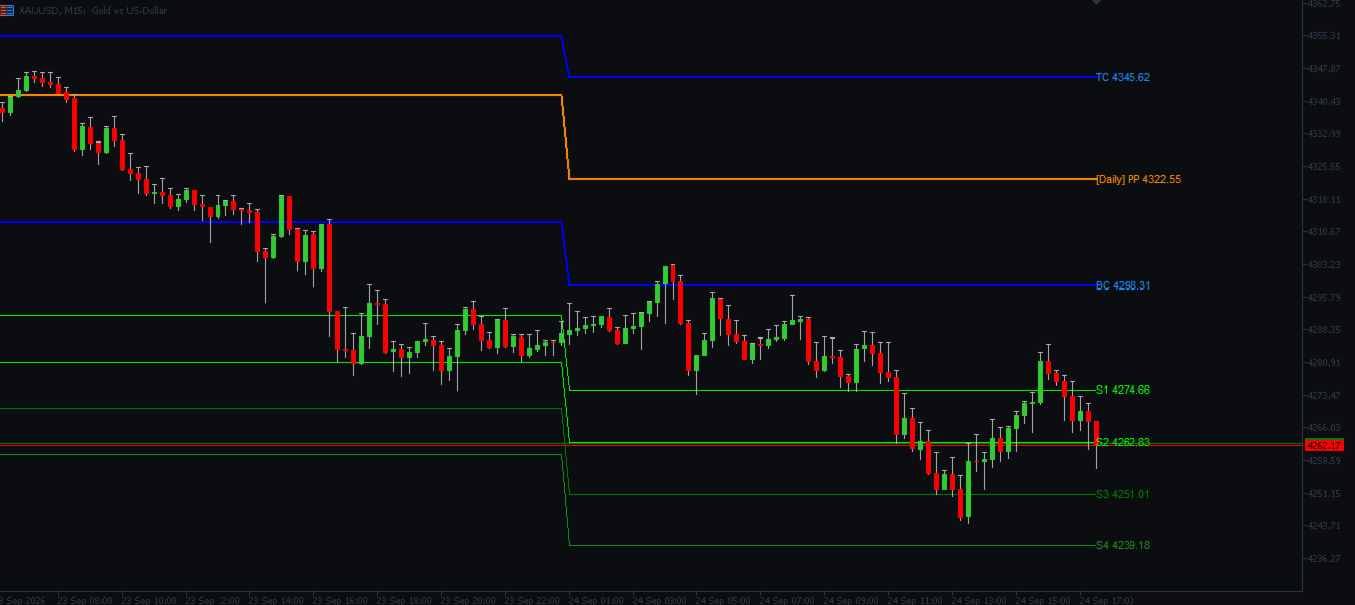
  • Complete Level Suite: Goes beyond standard pivot points. Includes Pivot Point (PP), Top Change (TC), Bottom Change (BC), and multiple tiers of Support and Resistance (S1–S4, R1–R4).
2. Clean, Non-Intrusive Visual Design
  • Color-Coded Clarity: Levels are intelligently color-coded (e.g., Daily PP in orange, structural changes in blue, standard S/R in green) so you can instantly distinguish between timeframes and level importance.
  • Smart Labeling: Every line features a clean, readable label with its exact price value, keeping your chart organized without the visual noise of standard MT5 objects.
3. Zero-Lag, Optimized Performance
  • Built with the same lightweight, state-tracking engine as our Volume Profile. It calculates and renders instantly without freezing your charts or consuming unnecessary CPU resources, even on lower timeframes like the M1 or M5.
4. Full Customization
  • Visual Control: Fully customize the colors, line styles (Solid, Dash, Dot), and thickness for every single level type.
  • Toggle Control: Turn specific timeframes (Daily, Weekly, Monthly) or specific levels (TC, BC, S/R) on or off based on your trading style.
The Value for Traders
  • Trade with Confluence: When a Daily Pivot Point aligns with a Weekly Support level, you have a high-probability institutional zone. Nova makes these confluence areas instantly visible.
  • Day Trading Precision: The Daily Pivot (PP), TC, and BC act as magnetic zones for intraday price action. Use them to set precise take-profit targets or identify high-probability reversal entries.
  • Objective Risk Management: Remove the emotion from your stop-loss and take-profit placement. Let the math-based pivot levels dictate your trade management.
⚙️ Technical Specifications
  • Platform: MetaTrader 5 (MT5)
  • Window Type: Main Chart Window (Overlay)
  • Timeframes: Calculates Daily, Weekly, and Monthly pivots (displays on any chart timeframe).
  • Updates: Real-time, non-repainting, zero-lag optimization.
Stop guessing where price will turn. Map the structure. Trade with precision. Elevate your charting with Nova Multi-Timeframe Pivots.
推荐产品
LT Support Resistance - 100% 自动识别支撑位与阻力位 您是否厌倦了在手动绘制支撑线和阻力线上浪费时间?或者因为总是错过某个关键位置而感到沮丧?LT Support Resistance 的开发正是为了消除这一繁琐的工作,它能同时在多个时间周期(Timeframe)内,自动识别并标注出对您交易资产最具价值的区域。 == 关键位置的智能自动化 == 相比手动绘制线条(既主观又耗时),该指标能够通过分析历史价格,识别出显著的反转点,并绘制出价格“真实”尊重的支撑线与阻力线。为您带来更客观、更高效且基于数据支撑的盘面分析。 == 核心特性 == 100% 自动检测: 无需手动分析,自动识别支撑/阻力 多时间周期 (MTF): 直接在 M5 图表上直观查看 H1、H4、D1、W1 的关键位置 智能警报: 当价格触及、突破或在某一水平位盘整时发送通知 动态区域: 创建的是“区域”而非简单的“线条”,更加贴合价格行为(Price Action)的真实市场 兼容任何资产: 外汇、指数、股票、加密货币、大宗商品 视觉完全自定义: 颜色、样式、粗细、透明度均可自由配置 == 运
Smart Pivot Points
Alexandr Saprykin
MetaTrader 5 智能枢轴点指标 — 清晰的交易水平线 智能枢轴点指标是一款适用于 MetaTrader 5 的专业指标,可自动计算并在图表上显示一整套关键交易水平线。它将纷繁的价格走势转化为清晰的结构化图表,突出显示支撑位、阻力位、价格平衡点和潜在目标区域。该工具专为重视清晰度的交易者而设计,适用于任何市场:外汇、加密货币(比特币、以太坊)、股指、股票和大宗商品(XAUUSD)。 该指标是您可靠的分析助手,可节省计算时间并为您的分析增添客观性。它不会提供市场信号或替您做决定,而是为您做出明智的交易决策提供高质量的信息基础。 主要功能和优势 即用型价格坐标系统:无需再手动绘制水平线。五条清晰的线条会立即显示在图表上:中心水平线(平衡点)、支撑位、阻力位、买入目标位和卖出目标位。 完全自定义显示内容:您可以决定显示哪些信息。轻松启用或禁用级别组和价格标签,根据您的策略定制图表,并保持工作区整洁。 完全灵活的计算方式:选择任意时间周期进行计算——从用于超短线交易的分钟级(M5、M15)到用于波段交易的日线(D1)和周线(W1)。通过指定要使用的历史数据周期数来调整分析
Fibozonesv1pro
Ignacio Souza Hermida
FiboMaster Pro — Automatic Fibonacci with Entry, SL & TP Automatic swing detection and Fibonacci levels with entry, stop loss, and take profit zones, drawn on any instrument and timeframe. FiboMaster Pro automatically detects the most recent swing high and swing low on your chart and draws the full Fibonacci retracement along with reference entry, stop loss, and two take profit levels — no manual drawing required. HOW IT WORKS The indicator scans the last N candles (configurable), identifies the
Lot Lines Calculator 2
Vyacheslav Ustinov
Большинство профессиональных трейдеров декларируют строгое соблюдение управления рисками. Этот простой инструмент разработан для быстрого расчета размера лота, чтобы торговать в соответствии со следующими базовыми правилами риск-менеджмента: Максимально допустимый риск устанавливается как фиксированный процент от общего количества средств на счете (например, 1-2%). Риск измеряется расстоянием в пунктах между открытием ордера и установленным стоп-лоссом. Так как для новичков всегда затруднительно
Opulence SnR
Tokunbo Greatpath Adebowale
Opulence SnR — Support & Resistance Indicator Automatically detect and display the most relevant support and resistance levels on your chart — no manual drawing, no repainting, no guesswork. Opulence SnR uses confirmed swing point logic to identify where price has genuinely reacted in the past, then draws those levels cleanly on your chart. Every level is locked in only after the required candles have fully closed, so what you see on historical bars today is exactly what you would have seen at t
Flat finder
Yuriy Lyachshenko
该指标检测平仓,并在发现的区域画上一个彩色的矩形。 该指标的主要思想是,当价格填满图表上的某个区域时,检测出一个平盘。 输入参数: Color rectangle - 要着色的矩形的颜色。 Bars in rectangle - 矩形中允许的最小条数。 Density in % - 扁平的密度,设置为矩形区域的百分比。 __________________________________________________________________ __________________________________________________________________ ________________________
Buy and Sell ATR
Marco Engstermann
4 (2)
Buy and Sell ATR Indicator updated version 1.2 (2026) ATR-based trend indicator with visual signals, dynamic support/resistance, and TP/SL levels. This indicator identifies market trends using an ATR channel and displays clear Buy and Sell signals.  It draws a dynamic trend line that changes color (green for uptrend, red for downtrend), shows arrows for entries, and plots the latest Take Profit and Stop Loss levels directly on the chart. Detailed Description in the comments post 2. Set files in
FREE
隆重推出 Auto Trendline,这是一款创新的 MT5 指标,可自动执行以下过程: 在图表上绘制趋势线。告别手动绘制趋势线这项繁琐耗时的任务吧! 让 Auto Trendline 为您效劳! *购买后请联系我,我会给您发送 使用说明和分步指南。 凭借其先进的算法,自动趋势线功能可以自动检测并绘制趋势线。 节省您的时间和精力。只需将指标附加到您的图表上,即可观看它根据价格走势的高点和低点识别并绘制趋势线。 自动趋势线具有高度可定制性,您可以调整指标的灵敏度以适应您的交易风格和偏好。 您还可以选择不同的线条样式和颜色,甚至可以设置警报,以便在趋势线被打破时通知您。 无论您是新手还是经验丰富的交易员,自动趋势线都是识别和分析任何市场趋势的重要工具。 凭借其用户友好的界面和先进的功能,该指标一定会提升您的交易体验,并帮助您做出更明智的交易决策。 主要特点: 自动绘制趋势线。 多品种和多时间周期。 高度可定制的灵敏度设置。 多种线条样式和颜色。 趋势线断裂警报通知。 用于监控符号和时间范围信息的仪表盘(GUI)。 立即体验自动趋势线分析,探索自动化趋势线分析的优势!
Gold Sniper Levels PRO
Hericlezia Andrade Assuncao
Gold Sniper Levels PRO is a professional MetaTrader 5 indicator designed specifically for Gold (XAUUSD). It automatically identifies and displays important psychological levels, round numbers, intermediate levels, and attention zones directly on your chart, giving you a cleaner and more organized view of the Gold market. Designed for Gold Trading Gold Sniper Levels PRO uses a structured multi-level system specifically optimized for XAUUSD: Main Levels: 10.00 price intervals Intermediate Levels:
EasyPivot — 智能识别关键高低点 + 形态预测 EasyPivot 是一款专业的 MetaTrader 5 指标,可自动识别价格图表中的局部高点(High)和低点(Low),分析这些信号的历史序列,并提供基于统计学的下一个走势预测。该工具非常适合从事波段交易、支撑/阻力位及形态分析的交易者。 工作原理 指标扫描图表并标记关键的转折点: 高点支点   — 最高价高于左侧和右侧指定数量K线(默认:左侧5根,右侧5根)。 低点支点   — 最低价低于相邻K线(默认:左侧0根,右侧5根 — 快速识别局部低点)。 找到的信号用彩色箭头显示(红色 — 潜在高点,绿色 — 潜在低点)。您可以灵活调整确认支点所需的K线数量,以及箭头之间的最小距离 — 这能有效过滤“噪音”信号。 指标的核心功能是预测。   EasyPivot 会记住历史信号序列(例如「上‑下‑上‑上‑下」),将其组合成设定长度(默认6)的形态,并统计每种形态之后发生的情况:上涨还是下跌。当当前形态与某个历史形态匹配时,指标会显示预测方向及置信度百分比(阈值70%)。若统计数据不够可靠,您将看到中性信号「50/50」。 主要优
FREE
Draw levels of support and resistance based on highs/lows or closes from daily, weekly or monthly. This indicator uses the highs, lows or closes to draw horizontal lines on the graph. By observing those lines you can identify trend (gaining or losing levels of resistence/support) and find good levels where price can bounce. For those who trade price action, this is a very useful indicator.
Bring the automatic session-based workflow of FRVP analysis directly to MetaTrader 5. Feel free to star rate after you've got everything set correctly!  Stop manually drawing full-day or session ranges and FRVPs. Stop guessing whether your Volume Profile is using the correct candles. This indicator identifies your Tokyo, London, New York, Sydney sessions displaying their ranges, labels, and Fixed Range Volume Profiles on the day, session, or week in full automation after setting your GMT + or -
Trading Discipline Trend Dashboard 只读取您自己账户已平仓的交易历史,并把四种特定模式转化为7天走势,让您看清某种行为只是偶然一次,还是每周都在重复。它不做预测,也不给建议。面板上的每一个数字,都是这个账户上已经发生过的事实。 数字是怎么算出来的:它读取最多37天内所有品种、所有魔术号的已平仓交易——这是整个账户的画面,而不只是当前图表品种的画面。四行数据,各有各的定义。Post-loss oversize 统计在一次亏损平仓后10分钟内开出的新仓位中,手数超过30天基准值(同类新仓的手数中位数)的笔数——这与免费指标 Trade Behavior Mirror 的定义完全相同。Win-streak oversize 统计在连胜仍在持续期间开出的新仓位中,手数超过同类30天基准值的笔数——这与免费指标 Win Streak Size Creep Mirror 的定义完全相同。Symbols per day (avg) 统计某一天有新仓位的不同品种数量,并显示统计窗口内的日均值——这与免费指标 Multi-Symbol Chase Mirror 的定义
Session Box And Timer
Nguyen Thanh Trieu
Session Box And Timer 日内交易需要监控各大交易时段之间的过渡,然而手动重叠时间表容易出现计算错误。若没有清晰的标记,前一时段的关键价格水平和流动性区域很容易被忽略。 Session Box And Timer 直接在您的图表上直观显示交易时段、波动趋势和倒计时器。 它显示什么: - 时段框(Session Boxes): 代表亚洲、伦敦和纽约时段的彩色矩形,标签中会显示自动计算的点数范围(pip range)。 - 亚洲时段区间水平: 亚洲时段最高价和最低价的投影向右延伸为水平线,作为日内突破的参考。 - 前一日最高价/最低价 (PDH/PDL): 标记前一天最高和最低边界 landlords 的虚线水平线。 - 时段周期线和倒计时标签: 在即将开盘的时段画出垂直线,显示距离下一时段开盘的精确剩余倒计时时间(时:分:秒)。 - 波动率热力图 (Volatility Heatmap): 图表底部的连续多色块状指标,显示过去20天的历史每小时波动率。 - 仪表板面板 (Dashboard Panel): 简洁的叠加层,显示活跃或即将到来的时段、实时倒计时、本地GMT
FREE
Auto Fib Retracements
Ross Adam Langlands Nelson
4.2 (5)
Automatic Fibonacci Retracement Line Indicator. This indicator takes the current trend and if possible draws Fibonacci retracement lines from the swing until the current price. The Fibonacci levels used are: 0%, 23.6%, 38.2%, 50%, 61.8%, 76.4%, 100%. This indicator works for all charts over all timeframes. The Fibonacci levels are also recorded in buffers for use by other trading bots. Any comments, concerns or additional feature requirements are welcome and will be addressed promptly. 
FREE
Candle Timer is a lightweight indicator that shows the remaining time until the current candle closes. It is designed to be minimal and configurable, allowing traders to keep focus on price action while still monitoring candle closing time. The indicator can be displayed as a fixed label on the chart or follow the current market price. Features • Displays remaining candle time • Option to show only the time or include label text • Optional price-following mode • Automatic neutral color base
**Initial Balance Breakout** Professional indicator for displaying Initial Balance (IB) zones of the three major trading sessions: Asian, London, and US. The indicator automatically draws: - Initial Balance High and Low for each session - Optional filled IB zone - Session extension lines (up to the start of the next session) - Fibonacci extension levels (100%, 161.8%, 200%, 261.8%, 361.8%, 423.6%) - 50% level of the IB range (often used as Stop Loss) **Key Features:** - Clear visualization of A
Stryker Levels
Alex Amuyunzu Raymond
Stryker Levels — Precision Daily Breakout Detection with Live TP/SL Projection Every institutional trading desk watches the same two numbers each session: yesterday's high and yesterday's low. These levels are where liquidity pools, where stop hunts happen, and where the highest-probability breakout and reversal setups form. Stryker Levels turns this concept into a fully automated, non-repainting detection engine that works silently in the background so you never miss the moment price commits to
[A Fully Automated Fibonacci System for Clear, Confident Trading] “I'm not sure if I'm drawing Fibonacci retracements correctly…” “Drawing lines on the chart every time is a hassle, and I end up missing opportunities…” Flat Fibonacci Wave was created for traders who struggle with exactly these problems. It automatically detects market swings (ZigZag) and instantly draws the most effective Fibonacci levels based on the most relevant swing. Key Features and Benefits 1) Automatic Golden Ratios — V
Awesome Oscillator by Bill Williams with the ability to fine-tune and replace the averaging algorithms of the indicator, which significantly expands the possibilities of using this oscillator in algorithmic trading and brings it closer in its properties to such an indicator as the MACD. To reduce price noise, the final indicator is processed with an additional Smooth averaging. The indicator has the ability to give alerts, send mail messages and push signals when the direction of movement of th
ReversalEdge Pro
Brian Kipkoech Cherus
Reversal Edge Pro Reversal Edge Pro is a reversal indicator designed to identify potential market turning points using a combination of RSI behavior, price action, candle structure, volatility, and trend context. The indicator applies a scoring and validation process to filter signals. Instead of displaying every possible reversal, it focuses on setups that meet the selected confirmation conditions. Main Features Reversal detection for potential buy and sell setups RSI, candle structure, volatil
Pivot Points MT5 is a universal color multicurrency/multisymbol indicator of the Pivot Points levels systems. You can select one of its three versions: Standard Old, Standard New and Fibo . It plots pivot levels for financial instruments in a separate window . The system will automatically calculate the Pivot Point on the basis of market data for the previous day ( PERIOD_D1 ) and the system of support and resistance levels, three in each. A user can choose colors for the indicator lines. The on
My Pivot Pro
Ashok Kumar Singha
My Pivot Pro is the Pro Version of the Indicator " My PIVOT " ( Link:  https://www.mql5.com/en/market/product/90336 ) This indicator will help you a lot to decide the Market Range and Movement.  This Indicator is based on Pivot Lines and Support-Resistance zones. Now we can Plot Standard/Classic; Fibonacci; Demark; Camarilla nd Woodies Pivot Levels as per our requirements. Steps to Setup the Indicator: Install the Custom Indicator; Set the Pivot Type; Period and Time ( We recommend to use t
The PUA MultiType Pivot indicator is built on the daily chart of the previous day. The PUA MultiType Pivot indicator is one of the most popular tools in technical analysis, used by traders to identify potential reversal points in financial markets. This indicator constructs three types of Pivot points: Classic, Fibonacci, and Camarilla, each offering its unique approach to market analysis. The advantages of this indicator include: Simplicity and Clarity PUA MultiType Pivot provides clearly defi
Projection of Phi
Nestor Jose Mendez Boza
Projection of Phi   Is a technical indicator that calculates dynamic support and resistance levels. It uses angular geometric projections and mathematical ratios to identify market expansion ranges. Features: Dynamic Fibonacci Expansion: Extension level projection Geometric Calculation: Angular analysis and mathematical ratios Visualization: Graphical objects with informative labels Compatibility: M1 to H4 timeframes Applications: Identification of zones for trade management Analysis of volatil
FREE
Fibonacci Auto
Makarii Gubaydullin
根据指定时间范围内的最高价和最低价自动绘制斐波那契水平 多个K线   可以合并:例如,您可以基于10天的最高价和最低价绘制斐波那契水平 我的   #1   工具 : 66+ 功能,包括此指标  |   联系我  如有任何问题  |    MT4版本 帮助识别潜在的反转水平; 在斐波那契水平形成的形态往往更强; 显著   减少   手动绘制   所花费的   时间 ; 设置: 计算基准最高价和最低价的时间范围 计算基准价格的周期数量  当前(浮动)K线可以包含/排除 每个级别可以自定义或禁用(设置为0以关闭) 您还可以禁用整个级别组:分别为主要级别、向上和向下扩展 线条颜色、样式和粗细  可以启用/禁用水位价格 //--------- 我的   #1   工具 : 65+ 功能,包括此指标  |   联系我  如有任何问题  |    MT4版本
Stochastic Horizontal Line Alert for MT5 Turn your Stochastic horizontal levels into automatic alerts. Simply draw a line on the Stochastic window and let the indicator monitor it for you.  Your Stochastic levels are monitored automatically — so you don't have to watch the chart all the time. Stochastic Horizontal Line Alert is a simple and convenient MetaTrader 5 indicator that monitors horizontal levels drawn in the Stochastic Oscillator window and automatically alerts you when the Stochasti
Neuro Future
Sergey Rozhnov
神经网络指标   具有内置学习功能。 这是一个真正的自主人工智能系统, 由多级可定制感知器和高级训练设置驱动,用于预测未来价格变化。您可以自行在任何金融品种上训练该指标,无需任何机器学习方面的专业知识。您所需的一切都包含在该工具中,并通过自动模式和预设功能轻松实现。 主要更新v2.0-2.5已经发布。 高级输入功能:增加了对指标的支持。 现在,您可以将原始价格数据与三个技术指标结合起来进行更深入的市场分析,或者只使用没有价格的指标。 非阻塞实时训练:智能训练算法在后台异步运行。 您的MetaTrader5终端保持完全响应,允许您在神经网络学习的同时继续交易和分析。 特征: 轻松启动 。简单设置,即可快速启动自动模式。(例如:     设置最大训练周期数 =5000、 最大训练样本数 =1500 以及如下所示的验证设置,然后单击学习按钮)。 直接在 MT5 中训练。 您拥有独一无二的机会,可以在终端内针对任何交易品种和时间范围训练网络,无需使用其他编程语言。最新的 MT5 编译器可高效处理学习过程。 高级预测。 通过可定制的通知系统,获取选定数量的未来价格预测。 智能文件管理。 便捷
Support Resistance for MetaTrader 5 identifies and displays horizontal support and resistance levels from ZigZag pivots. The indicator is designed to help traders read price structure with a clean chart. It does not open, modify or close trades. It is a visual technical analysis tool. Main features Builds levels from confirmed ZigZag pivots. Combines the current timeframe with its immediate higher timeframe to add context without overloading the chart. Merges nearby pivots using an adaptive ATR-
该产品的买家也购买
SMART TREND TRADING SYSTEM — 特别优惠 您的交易系统、自动化 EA,以及配套培训与支持。 以 99 美元购买适用于 MT5 的 Smart Trend Trading System,即可 免费获赠 Smart Universal Expert Advisor ,用于自动执行系统的交易信号。 STTS 将趋势方向、入场和出场信号、反转区域及重要价格水平集中呈现在图表上。您可以根据系统手动交易,也可以连接随附的 EA,按照您选择的设置自动执行交易。 当前 99 美元的价格适用于接下来的 30 次购买。此后,价格将上调至 149 美元。 您的完整产品套装 购买后,您将获得: • 适用于 MT5 的 Smart Trend Trading System。 • Smart Universal Expert Advisor — 免费赠送。 • 完整的 STTS PDF 用户手册。 • STTS 官方在线课程。 • 逐步安装与设置指导。 • 私人客户社区访问权限及支持服务。 您不仅能获得工具,还能按照清晰的步骤学习如何使用它们。 一套系统,四种交易思路 STTS
Trend Sniper X
Sarvarbek Abduvoxobov
4.9 (39)
Trend Sniper X 是一款适用于 MetaTrader 5 的多周期趋势跟踪指标,可帮助交易者清晰精准地识别趋势方向和潜在的反转点。 适用于 MT4: https://www.mql5.com/en/market/product/193245 价格信息: 当前价格为促销价,随着后续更新和新功能的推出,价格可能会有所变动。 赠品优惠: 购买后联系作者,即可免费获取该指标的 Auto-Trade Assistant EA(自动交易助手 EA)。 Code2Profit 频道 通过多时间框架分析掌控市场! 如何使用 Trend Sniper X 最大化您的胜率:核心规则与交易时段技巧 技术规格 平台 MetaTrader 5 指标类型 多时间周期趋势指标 运行时间周期 任何图表时间周期,可独立选择更高的时间周期 (M1–MN1) 主要交易品种 外汇、黄金 (XAUUSD) 及其他差价合约 (CFD) 推荐账户 任何账户类型 可视化 彩色趋势蜡烛 (买入/卖出/微弱/变化) + 买入/卖出箭头 附加模块 交易时段方框 (悉尼、东京、伦敦、纽约) 主要功能 多时间周期趋势分析: 直接在
Neuro Poseidon MT5
Daria Rezueva
4.75 (53)
Neuro Poseidon is a new indicator by Daria Rezueva. It combines precise trading signals with adaptive TP/SL levels - creating best possible trades as a result! Message me and get  Neuro Poseidon Assistant  as a gift to automize your trading process! What makes it stand out? 1. Proven profitability on all assets and timeframes 2. Only confirmed BUY and SELL signals present on the chart 3. Adaptive TP & SL levels generated by the software for each trade 4. Easy to understand - suitable for al
SuperScalp Pro
Van Minh Nguyen
4.65 (34)
SuperScalp Pro - Professional Multi-Layer Confluence Scalping System SuperScalp Pro 是一款高级剥头皮交易指标,在经典 Supertrend 的基础上加入了多个智能确认过滤器。它可以帮助您识别概率更高的 Buy/Sell 交易机会,同时显著减少虚假信号。 清晰的 Buy 和 Sell 箭头会直接显示在图表上,基于 ATR 的 Stop Loss 和 Take Profit 水平会实时自动计算。 购买后,请联系我获取设置指导和推荐配置。 使用 SuperScalp Pro Auto Trader 轻松实现信号自动化: [Auto Trader] 下载推荐设置文件: [Set File] 完整文档请参阅产品博客: [User Guide] 加入官方频道获取最新更新: [Official Channel] SuperScalp Pro 如何工作? 只有当多个确认层同时一致时,指标才会生成交易信号(趋势 + 动能 + 成交量 + 波动率)。 您可以手动交易,也可以连接 SuperScalp Pro Auto Tr
M1 Sniper MT5
Oleg Rodin
5 (7)
M1 SNIPER   是一款易于使用的交易指标系统。它是一个专为 M1 时间框架设计的箭头指标。该指标可以作为独立的系统在 M1 时间框架下进行剥头皮交易,也可以作为您现有交易系统的一部分使用。虽然该交易系统专为 M1 时间框架交易而设计,但它也可以用于其他时间框架。我最初设计此方法是为了交易 XAUUSD 和 BTCUSD。但我发现这种方法在其他市场交易中也同样有用。 指标信号既可以顺势交易,也可以逆势交易。我教授一种特殊的交易技巧,帮助您利用指标信号进行双向交易。该方法基于使用特殊的动态支撑位和阻力位区域。 购买后,您可以立即下载 M1 SNIPER 箭头指标。此外,我还为所有 M1 SNIPER 工具用户免费提供下方屏幕截图所示的 Apollo Dynamic SR 指标!这两个指标的组合可以帮助您更轻松、更准确地利用 M1 时间框架进行交易。 购买后请联系我,免费获取交易提示和奖励指标! 祝您交易成功!
Gann Made Easy MT5
Oleg Rodin
5 (10)
Gann Made Easy   是一个专业且易于使用的外汇交易系统,它基于使用先生理论的最佳交易原则。 W.D.江恩。该指标提供准确的买入和卖出信号,包括止损和获利水平。您甚至可以使用推送通知在旅途中进行交易。 购买后请联系我,即可免费获得交易指导和超棒的额外指标! 您可能已经多次听说过江恩交易方法。通常 Gann 的理论不仅对于新手交易者而且对于那些已经有一定交易经验的人来说都是非常复杂的东西。这是因为江恩的交易方法在理论上并不那么容易应用。我花了几年时间来完善这些知识,并将最好的原则应用到我的外汇指标中。 该指标非常易于应用。您所需要的只是将其附加到您的图表并遵循简单的交易建议。该指标不断进行市场分析工作并寻找交易机会。当它检测到一个好的入口点时,它会为您提供一个箭头信号。该指标还显示止损和获利水平。 换句话说,当您像先生一样进行交易时,该指标会为您提供最佳江恩建议。江恩亲自告诉你此时此刻该做什么。但最好的部分是您不需要了解任何有关江恩交易原则的知识,因为该指标会为您完成整个市场分析工作。
Unix Scalper
Issam Kassas
4 (4)
UNIX SCALPER — 特别优惠 发现交易形态,看清交易计划,选择执行方式。 以 99 美元购买适用于 MT5 的 UNIX Scalper,即可免费获赠 Smart Universal Expert Advisor,用于自动执行指标的交易信号。 UNIX Scalper 将市场分析、BUY/SELL/WAIT 决策以及 Entry、Stop Loss、TP1 和 TP2 水平集中在一个清晰的面板中。您可以按照交易计划手动交易,也可以连接随附的 EA,按照您选择的设置自动执行交易。 当前 99 美元的价格适用于接下来的 30 次购买。此后,价格将上调至 149 美元。 您的完整产品套装 购买后,您将获得: • 适用于 MT5 的 UNIX Scalper。 • Smart Universal Expert Advisor — 免费赠送。 • 完整的 UNIX Scalper PDF 用户手册。 • UNIX Scalper 官方在线课程。 • 逐步安装与设置指导。 • 私人客户社区访问权限及支持服务。 您不仅能获得工具,还能按照清晰的步骤学习如何使用它们。 看清信号与交
Entry Points Pro for MT5
Yury Orlov
4.52 (151)
传奇回归:Entry Points Pro 10。 这款传奇指标曾 3 年稳居 MQL5 Market 前三,如今全面重启。 数百条热情好评(两个版本合计 589 条),每天有数千名交易者用它交易,演示版下载 31,000+   MT4+MT5  次。 五年来我读过你们的每一条评价——在第 10 版里,我没有给出许诺,而是把答案直接做进了产品。指标作者自 1999 年入市, 珍视诚信、自己的声誉和自己的客户 。 Entry Points Pro 给出的入场信号严格不重绘。 而且这一次不再只是作者的一面之词,而是可验证的事实:确认信号只在 K 线收盘后标出,自动化测试记录到 零重绘 (在 EURUSD、XAUUSD 和 BTCUSD 上共 2,486,568 次不变量检查——0 次违规)。测试方法完全公开——您可以在策略测试器中自行复现。 购买后请务必第一时间给我发私信。 我会发给您 扩展版说明书《交易者圣经》 ——使用本指标交易的完整指南——并告诉您如何免费获得 赠品:市场扫描器 ,它能同时分析多个品种和多个时间周期,并在一个界面上显示 Entry Points Pro 此刻在哪里表现
Reversion King Indicator
Eugen-alexandru Zibileanu
5 (9)
全新王者降临 - 指标 + 订单管理提示(TP1 + TP2 + TP3)+ 可选 Telegram 信号发送器 INCLUDED(免费) (完整交易与信号系统) 我们最强的黄金 EA: Gold Slayer 该指标包含先进的交易策略、可自定义订单管理系统,以及结合 Envelope 扩展的均值回归系统,并通过 RSI 等多重智能确认过滤器进行验证,以捕捉高概率反转入场机会,提供 BUY 与 SELL 信号。 你不仅能够学习如何交易,还能学会如何高效管理多个仓位,并利用之前盈利的持仓来覆盖亏损交易。 专为 M5 周期打造并优化,在 BTCUSD 和 XAUUSD 上表现尤为出色,因为这些市场的流动性能够让信号更加干净、可靠。 该指标会自动生成清晰的多头(Long)与空头(Short)信号,同时基于 ATR 自动计算入场位、止损位和止盈位,让风险管理从一开始就融入系统之中。 多 TP 系统设有三个渐进式目标位,你可以在 TP1 锁定部分利润、在 TP2 继续持仓,并在更大的行情中将仓位持有至 TP3,而这正是平均风险回报比真正开始大放异彩的地方。 默认参数开箱即用,已经针对稳定表现进行
Welcome to ENTRY IN THE ZONE AND SMC MULTI TIMEFRAME Entry In The Zone and SMC Multi Timeframe is a real-time market analysis tool based on Smart Money Concepts (SMC), designed to analyze market structure, price direction, and key trading zones. It supports both Single-Timeframe Analysis and Multi-Timeframe Analysis, providing a clearer view of the overall market structure across multiple timeframes, with real-time BUY / SELL signals that do not repaint. It is designed to help filter trading opp
Atomic Analyst MT5
Issam Kassas
4.45 (58)
ATOMIC ANALYST — 特别优惠 您的市场分析工具、自动化 EA,以及配套培训与支持。 以 99 美元购买适用于 MT5 的 Atomic Analyst,即可 免费获赠 Smart Universal Expert Advisor ,用于自动执行指标的交易信号。 Atomic Analyst 将价格行为、趋势方向、入场和出场信号、止损位及多个止盈位集中呈现在图表上。您可以参考其分析手动交易,也可以连接随附的 EA,按照您选择的设置自动执行交易。 当前 99 美元的价格适用于接下来的 30 次购买。此后,价格将上调至 149 美元。 您的完整产品套装 购买后,您将获得: • 适用于 MT5 的 Atomic Analyst。 • Smart Universal Expert Advisor — 免费赠送。 • 完整的 Atomic Analyst PDF 用户手册。 • Atomic Analyst 官方在线课程。 • 逐步安装与设置指导。 • 私人客户社区访问权限及支持服务。 您不仅能获得工具,还能按照清晰的步骤学习如何使用它们。 看清信号,理解交易形态 Atom
Adaptive Price Action Engine 买指标,免费送EA 自适应多时间框架趋势与K线形态智能分析系统 市场环境始终在变化,不同的市场阶段中,并非所有 Price Action 形态都具有相同的参考价值。 Adaptive Price Action Engine 旨在适应不断变化的市场条件,将 趋势结构、多时间框架分析、K线形态与统计优化 整合到一个统一的分析框架中。 两种自适应模式 Dual Alpha Trend Mode(双 Alpha Trend 模式) 自动搜索适合的 Alpha Trend 参数,并结合低周期与高周期市场结构,使指标能够根据近期市场行为动态调整趋势识别。 Candlestick + Alpha Mode(K线 + Alpha 模式) 将 Alpha Trend 市场状态与 22种多空K线形态 相结合。系统不会简单地对所有形态一视同仁,而是对不同的形态组合进行统计评估,并识别在特定市场环境下表现出更强历史统计特征的配置。 主要功能 趋势参数自动优化 多时间框架市场状态分析 22种多头与空头 Price Action K线形态 对数千种可能
货币强度向导是一个非常强大的指标,为您提供成功交易的一体化解决方案。该指标使用多个时间范围内所有货币的数据来计算这个或那个外汇对的力量。此数据以易于使用的货币指数和货币电力线的形式表示,您可以使用它们来查看这种或那种货币的力量。 您所需要的只是将指标附加到您要交易的图表上,该指标将向您显示您交易的货币的真实强度。该指标还向您显示买卖量压力的极值,您可以在顺势交易时利用这些压力。该指标还显示了基于斐波那契的可能目标。该指标可用于各种交易时间范围。该指标支持各种货币对的交易。   该指标为您提供所有类型的警报,包括推送通知。 购买后请联系我。我将与您分享我的交易技巧,并免费为您提供丰厚的红利指标! 祝您交易愉快,获利丰厚!
FiboSniper Pro
Van Minh Nguyen
5 (3)
FiboSniper Pro – Multi-Filter Fibonacci System with Auto SL/TP and Control Panel FiboSniper Pro 是一款技术指标,将动态 Fibonacci Envelopes 与多个确认过滤器相结合,以生成经过筛选的 Buy 和 Sell 信号。Fibonacci 水平基于 Moving Average 和 ATR 计算,然后通过 ADX、EMA、RSI、ATR、Volume、Time 和 Candle 结构进行过滤。该指标直接在图表上显示基于 ATR 自动计算的 Stop Loss 和 Take Profit 水平,并提供交互式控制面板,以便快速调整参数。 购买后,请联系我以获取推荐的设置文件和详细使用说明。 使用 Auto Trader X 自动执行 FiboSniper Pro 信号: [Auto Trader X] 用户指南和设置文件: [Click here] 加入官方频道获取最新更新: [Click here] 专为偏好结构化入场和清晰风险管理的交易者设计,适用于 Gold (XAUUSD)、B
Divergence Bomber
Ihor Otkydach
4.89 (94)
购买该指标的每位用户将额外免费获得以下内容: 原创工具“Bomber Utility”,该工具会自动跟踪每一笔交易,设置止损和止盈点,并根据策略规则自动平仓; 适用于不同交易品种的指标设置文件(Set 文件); 三种不同风险模式下的 Bomber Utility 设置文件:“最低风险”、“平衡风险” 和 “观望策略”; 一套详细的 视频操作手册,帮助您快速完成安装、配置并开始使用本交易系统。 注意: 要获取以上所有赠品,请通过 MQL5 的私人消息系统联系卖家。 我为您介绍原创的自定义指标 “Divergence Bomber”(背离轰炸机),它是一套基于 MACD 背离交易策略 的“全功能”交易系统。 该技术指标的主要任务是识别 价格与 MACD 指标之间的背离,并发出交易信号(包括推送通知),指示未来价格可能的运动方向。平均而言,这些信号的准确率超过 98%。有关该指标如何工作的详细说明,请观看本页面上的视频演示。 该系统使用 止损订单 和 动态回撤平仓机制 来管理交易。 Divergence Bomber 指标的主要特点: 支持交易的品种: AUDCAD、AUDCHF、AUDS
Superhero
Ihor Otkydach
5 (3)
SUPERHERO 指標是一款基於「全方位」原則設計的多貨幣交易系統。該指標能獨立分析市場,並提供開倉與平倉的交易訊號。它採用止損與獲利了結訂單,風險報酬比(R:R)為 1:1。 此系統可向您的智慧型手機發送推播通知,讓您無需綁定電腦,即可「隨時隨地」進行交易。這對於自營交易公司而言再適合不過了。 每位顧客皆可享額外好禮: 每位購買此指標的買家,都將收到我贈送的一項特別實用工具,該工具: 自動下達止損與獲利了結訂單 當價格達到目標水準時,系統會自動平倉 支援待執行訂單交易 支援均值交易模式 如果您希望將這款優秀且極為便利的工具作為禮物獲贈,請在購買 SUPERHERO 指標後,立即透過 MQL5 平台的私訊與我聯繫。此外,您還將獲得培訓課程「如何安裝與設定 SUPERHERO 並開始穩定獲利」的存取權限。 關於「超級英雄」策略 SUPERHERO 策略是利用價格回調時,順應趨勢方向進行盤中交易。 「超級英雄」程式碼內含數個強大的技術指標,用以分析價格通道的趨勢方向與波動範圍,並能識別在修正性回調後形成的盤中波段反轉形態。 SUPERHERO 指標採用獨特的自我優化演算法,一旦添加至價格
Volatility Master for MetaTrader is a real-time dashboard tool that scans up to  50 symbols  to identify high-volatility , trending markets instantly. With bullish/bearish signals, customizable alerts, and a user-friendly interface, it helps you avoid range-bound conditions and focus on high-probability trades. Clarity leads to confidence. Trade confidently and protect your capital effectively with this powerful dashboard. We don't offer free or bonus indicators in exchange of reviews from you.
PZ Trend Trading MT5
PZ TRADING SLU
3.8 (5)
许多盈利交易者不仅知道如何识别市场趋势,而且也能把握趋势建立后的交易机会。 Pz 趋势交易 指标设计用来在趋势行情中尽可能的赚取利润。 已建立的趋势提供了一揽子交易机会,但大多数趋势交易指标完全忽视了它们,让交易者在趋势行情时完全不知道该如何做!一般趋势指标只通知有关的趋势变化,但根本不足以得到卓越的回报. Pz 趋势交易 指标比一般趋势指标显示多达 20 倍的交易 , 因为它注重所谓的市场时机。它不仅显示当前的市场趋势,也有回调,内柱线的突破和调整。它令您在趋势回调之后介入,安全的柱线内突破金字塔加仓,以及发现潜在的反转,和已知的调整。 趋势改变 一个趋势改变在市场方向变化时发生。趋势变化在图表上用带数字的彩色圆圈显示。蓝色 (1) 信号为上涨开始, 而红色 (1) 信号为下跌开始。趋势变化并非评估当前价格动作的结果, 它意味着交易设置是不定时地。如果您正确使用本指标, 在趋势变化时, 您将将已经入场 (参看下面的调整)。 回调 但凡趋势在运动中,行情上下抖动,盈利者收割利润,且其它参与者入场。趋势回调代表好的买入机会,通常是由主力获利离场导致。如果行情在回调后回归上行, 指标将
Power Candles MT5
Daniel Stein
4.58 (12)
Power Candles V3 - 自我优化的强度指标 Power Candles V3 把货币与品种的强度直接转化为图表上可执行的交易方案。指标不再仅根据强度给K线着色,而是在后台持续运行实时自动优化,为您正面对的品种给出最佳 Stop Loss、Take Profit 与信号阈值。一键采用,Entry、Stop Loss、Take Profit 线就以精确价格绘制在图表上,提醒消息中直接包含方向。 本工具是 Stein Investments 生态系统的一部分 - 18+ 款工具,加上 Max,您的一对一 AI 交易导师。  随时在线,深入了解每一款指标,在您需要梳理思路的那一刻就在那里。  立即认识他: https://stein.investments 每根收盘K线运行 3,000+ 次交易模拟。9 种强度状态。2 种策略并行测试。一键采用最优配置。 为什么需要这个 大多数强度指标只给您一个数值,然后留下三个问题:相信哪个阈值、用哪个 Stop Loss、走哪个交易方向。Power Candles V3 在每根收盘K线上自动回答这些问题。结果就是一个完整的交易方案 -
IQ FX Gann Levels a precision trading indicator based on W.D. Gann’s square root methods . It plots real-time, non-repainting support and resistance levels to help traders confidently spot intraday and scalping opportunities with high accuracy. William Delbert Gann (W.D. Gann) was an exceptional market analyst, whose trading technique was based on a complex blend of mathematics, geometry, astrology, and ancient mathematics which proved to be extremely accurate. We don't offer free or bonus indic
Trend Catcher ind mt5
Ramil Minniakhmetov
5 (18)
趨勢捕捉指標 趨勢捕捉指標結合了作者獨有的客製化自適應趨勢分析指標,用於分析市場價格趨勢。它透過過濾掉短期噪音,並專注於潛在的動能強度、波動性擴張和價格結構行為,來識別真實的市場方向。此外,它還結合了平滑和趨勢過濾等客製化指標,例如移動平均線、相對強弱指標 (RSI) 和波動率過濾器。 您可以在這裡查看實際運行情況以及我的其他產品: https://www.mql5.com/en/users/mechanic/seller 請注意,我不會在 Telegram 上出售 EA 或任何設置,那是騙局。所有設定都可以在我的部落格上免費取得。 重要提示!購買後請立即聯繫我,以獲取使用說明和額外獎勵! 請注意,我不會在 Telegram 上出售 EA 或任何設置,那是騙局。所有設定都可以在我的部落格上免費取得。
RelicusRoad Pro MT5
Relicus LLC
4.96 (24)
RelicusRoad Pro: 量化市场操作系统 终身访问限时 70% 折扣 - 加入 2,000+ 交易员社区 为什么大多数交易者即使拥有“完美”指标也会失败? 因为他们在真空中交易 单一概念 。没有背景的信号是赌博。要持续获胜,您需要 共振 (CONFLUENCE) 。 RelicusRoad Pro 不是一个简单的箭头指标。它是一个完整的 量化市场生态系统 。它描绘价格运行的“公允价值之路”,区分市场噪音和真实的结构性突破。 停止猜测。开始用机构级“路”逻辑进行交易。 核心引擎:“Road” (路) 算法 系统的核心是 Road Algo ,一个实时适应市场条件的动态波动率通道。它投射出 安全线 (平衡) 和价格可能反转的 扩展水平 。 Simple Road: 典型市场的标准结构映射。 Smooth Road: 针对震荡盘整的降噪计算。 Breakout Road: 专为识别波动率扩张和爆发性走势而调整。 1. 算法动量与确认 我们的“剥头皮箭头”不只是简单的交叉。它们利用 高阶多项式逻辑 过滤噪音,确保信号与主周期一致。我们检测动量、价格行为和 Road 结构汇聚的精确入场
ATstrong
Zaha Feiz
5 (1)
ATSTRONG PRO: 市场结构与突破指标 突破检测引擎 | 5个动态TP目标 | 实时仪表板面板 | 不重绘 首发价格 当前价格: $59 — 每售出10份价格增加$10。 ATSTRONG PRO 是一款专为 MetaTrader 5 设计的高级突破和机构市场结构指标。 它能够检测高概率波段枢轴,识别集群的支撑和阻力堆积区,并实时发送结构破坏(BOS)和特征改变(CHoCH)信号。 该指标会自动在您的图表上绘制动态止损和5个不同的止盈水平(TP1到TP5), 并配有风险回报预测框、星级信号质量评级以及图表上的实时绩效分析仪表板。 交易提示: 这是一款用于手动交易和市场分析的指标。它在K线收盘时显示清晰的视觉信号、水平和警报,并且 完全不重绘 。它不执行自动交易。 核心亮点与特性 智能突破引擎: 同时检测集群水平区域突破和单波段枢轴突破(BOS / CHoCH)。 突破强度评分: 评估动能、成交量/K线实体大小和枢轴质量,以过滤虚假突破和诱多/诱空。 5阶段止盈水平: 预测可自定义的R倍数目标(TP1: 0.5R, TP2: 1.0R, TP3: 1.5R, TP4:
First time on MetaTrader, introducing IQ Star Lines - an original Vedic Astrology based indicator. "Millionaires don't use astrology, billionaires do" . - J.P. Morgan, Legendary American financier and banker. We don't offer free or bonus indicators in exchange of reviews from you. You won't need any free products with this indicator to make it work. ;) Enjoy! Welcome to  the new and updated  IQ Star Lines , the ultimate fusion of ancient planetary harmonic cycles and modern quantitative trading.
Auto Optimized SpeedAngle 是一款机构级的动量向量化系统,通过持续的前瞻优化(Walk-Forward Optimization, WFO)彻底消除了曲线拟合(curve-fitting)。该指标没有采用在市场 状态转换时容易失效的静态输入参数,而是利用出样外验证(Out-of-Sample, OOS) dynamically 动态重新校准设置,从而确保显示的 信号代表真正的统计优势,而非历史巧合。 核心机构级架构 前瞻优化引擎(Walk-Forward Optimization Engine): 核心算法持续扫描数千种回溯周期(lookback)与阈值组合,严格将数据划分为样本内(in-sample)和样本外(out-of-sample)。只有当参数配置在未知数据环境中证明具备数学优越性时,系统才会对其进行 adoption。 量化目标函数(Quantitative Objective Functions): 优化引擎不一味追求绝对毛利,而是聚焦于机构级的稳定性指标。用户可针对系统质量数(SQN)、期望值(每笔交易的平均 R 倍数)或净 R 值进行优化,从而优
UZFX {SSS} 超短线智能信号 v5.0 MT5 是一款无重绘的高性能交易指标,专为在快速波动的市场中需要精准、实时信号的超短线交易者、日内交易者和波段交易者设计。该指标由 (UZFX-LABS) 开发,融合了价格行为分析、趋势确认和智能过滤技术,可在所有货币对和时间周期内生成高概率的买卖信号、预警信号以及趋势延续机会。 别再对交易犹豫不决了,开始遵循这一专为追求清晰、精准和纪律性市场执行的交易者设计的结构化信号系统吧。 相信我,这是 MQL5 上最优秀的指标之一,所以千万不要错过!!“为睿智交易者打造的智能信号” 最新 5.0 版本现已发布,价格可能会在未事先通知的情况下上涨至 499.99 美元,所以请尽快入手,以免错失良机!! 最终购买前!如果您想获取免费试用版,请通过 WhatsApp 号码 +923030751987 联系我!! 如果您遇到任何问题“或”有任何不明白的地方,请在私聊中向我咨询!!! 主要功能更新 • 自动买入和卖出信号检测 • 先进的反转识别逻辑 • 潜在市场反转前的预警信号 • 趋势延续确认信号 • 内置风险管理功能,包含入场点、止损点、TP1、
FX Trend MT5 NG
Daniel Stein
5 (6)
FX Trend NG:新一代多市场趋势智能分析工具 概述 FX Trend NG 是一款专业的多时间周期趋势分析与市场监控工具,帮助您在几秒钟内全面了解市场结构。 无需在多个图表之间来回切换,您可以立即看到哪些品种处于趋势中、哪里动能正在减弱,以及哪些时间周期之间存在强烈共振。 限时发布优惠 – 仅需 $30(6个月) 或 $80 终身授权 即可拥有 FX Trend NG 。 已经是 Stein Investments 客户? -> 发送消息 以获取专属客户群访问权限。 需要帮助或安装指导? -> 请访问 Stein Investments 官方页面 。 1. FX Trend NG 的核心优势 三状态趋势逻辑 —— 不只是 Buy 或 Sell • 大多数指标仅显示两种状态:Buy 或 Sell。 • FX Trend NG 增加第三种状态: Fade 。 • Fade 表示趋势强度正在减弱,在完全反转之前提前发出信号。 这种结构化逻辑让您看到趋势变化过程,而不仅仅是简单方向信号。 多时间周期分析(M1 至 MN1) • 从短线交易到中长线交易全面覆盖。 • 快速识别趋势
M1 Quantum MT5
Hamed Dehgani
4.2 (10)
使用 M1 Quantum 的实盘交易信号 : 信号 (交易由 Quantum Trade Assistant 自动 执行,并作为本产品 免费 提供。) 最新消息: 版本 1.64 已发布。现在所有交易的止损都会设置在相应的支撑位/阻力位之后。Smart Close 功能也进行了改进,以提升此版本 EA 的性能。 自 8 月 9 日起,实盘信号一直运行在版本 1.64 上。 价格计划: 当前价格: $169 (早期用户优惠) 下一阶段计划价格: $189 计划零售价: $299 开发者提示: 购买后请联系我,以获取 最新推荐的参数设置文件(Set File) 、交易建议,以及加入 VIP 支持群组 ,与其他 M1 Quantum 用户交流经验。 常见问题 - 设置文件 - 安装指南 M1 Quantum 是一款专业的 M1 交易系统,提供快速且精准的交易信号,并内置止损(Stop Loss)、止盈(Take Profit)以及智能资金管理功能。 M1 Quantum 包含专业的资金管理系统,通过专注于 连续盈利交易 ,帮助交易者更快地增长账户资金。 M1 Quantum 指标 的主
Crystal Quantum Pro
Muhammad Jawad Shabir
5 (3)
CRYSTAL QUANTUM PRO Institutional Signal & Trade Intelligence for MetaTrader 5 Final Price: 199 USD ----> Price goes up 10 USD after every 10 sales. Limited launch slots available, act fast. Most indicators give you an arrow and leave you alone. A naked arrow is a gamble. Winning consistently requires CONFLUENCE , a clear STOP and TARGET , and honest PROOF that the system works. Crystal Quantum Pro delivers all three in one clean, no-repaint package. Crystal Quantum Pro is a complete decision sy
Scalper Vault   是一个专业的剥头皮系统,为您提供成功剥头皮所需的一切。该指标是一个完整的交易系统,可供外汇和二元期权交易者使用。推荐的时间范围是 M5。 该系统为您提供趋势方向的准确箭头信号。它还为您提供顶部和底部信号以及江恩市场水平。无论您拥有何种交易经验,该系统都易于使用。您只需要遵循简单的规则并每天重复该过程。 建议将此系统用于主要货币对。感谢您的关注! 请注意,该指标在策略测试器中可能无法正常工作。因此,我建议仅在模拟或真实账户的真实交易条件下使用该系统。 指示器提供所有类型的警报,包括推送通知。 购买指标后请与我联系。我将免费与您分享我的个人交易建议和出色的奖励指标! 祝您交易愉快,盈利!
作者的更多信息
Nova Volume Profile
Joseph Chege Githuku
Nova Volume Profile: Master Auction Market Theory with Precision Stop guessing where the smart money is positioning. See it. Standard MT5 volume tools are often clunky, visually overwhelming, and prone to flickering. Nova Volume Profile was built from the ground up for modern price action and Auction Market Theory traders. It delivers institutional-grade volume analysis with a sleek, non-intrusive design that keeps your charts clean and your focus sharp. Whether you are trading breakouts from th
Nova HT Liquidity Zones
Joseph Chege Githuku
HTF Liquidity Mapper: Trade Lower Timeframes with Institutional Context Stop chart-hopping and guessing market direction. The HTF Liquidity Mapper projects key Higher Timeframe (HTF) liquidity zones directly onto your Lower Timeframe (LTF) charts, giving you macroscopic market context in real-time.  By visualizing where institutional orders rest, you can objectively identify whether the market is setting a trap or establishing a new trend. Core Trading Concepts Visualized: 1. Liquidity Swee
Nova CVD: Master Market Momentum with the Volumatic Trend Filter Price action tells you what the market is doing. Volume tells you why.  Trading in the direction of rising volume is the foundational edge for profitable trading. But standard Cumulative Volume Delta (CVD) is notoriously noisy. Jagged, erratic spikes make it difficult to distinguish between genuine institutional accumulation and random market noise.  Enter Nova CVD.  We rebuilt the standard CVD from the ground up and engineere
Nova SuperTrend Follower
Joseph Chege Githuku
Nova SuperTrend Follower See the market clearly. Trade with precision. Follow the trend with confidence. The Nova SuperTrend Follower is a powerful, multi-layered indicator combining institutional VWAP with a fully customizable dual EMA system. It cuts through the noise to give you crystal-clear market visibility, perfect entry timing, and early reversal detection. The Core Components VWAP — The Volume Anchor Tracks institutional money flow. Unlike standard averages, VWAP filters out low-volum
Nova Liquidity Zones for MT5  Bookmap-Style Liquidity Zones for MetaTrader 5 See Where the Smart Money Hunts Stops — Before They Do. Nova Liquidity Grab Levels is a professional-grade liquidity visualization indicator that maps out where institutional traders place their orders — directly on your MT5 chart, in the iconic Bookmap heat-map style. Stop guessing where price will reverse.  Start seeing where the liquidity pools actually sit. What It Does Major price moves don't happen randomly.
筛选:
无评论
回复评论