Nova Multi Timeframe Pivots

Nova Multi-Timeframe Pivots Institutional Structure. Multi-Timeframe Precision. Zero Clutter.
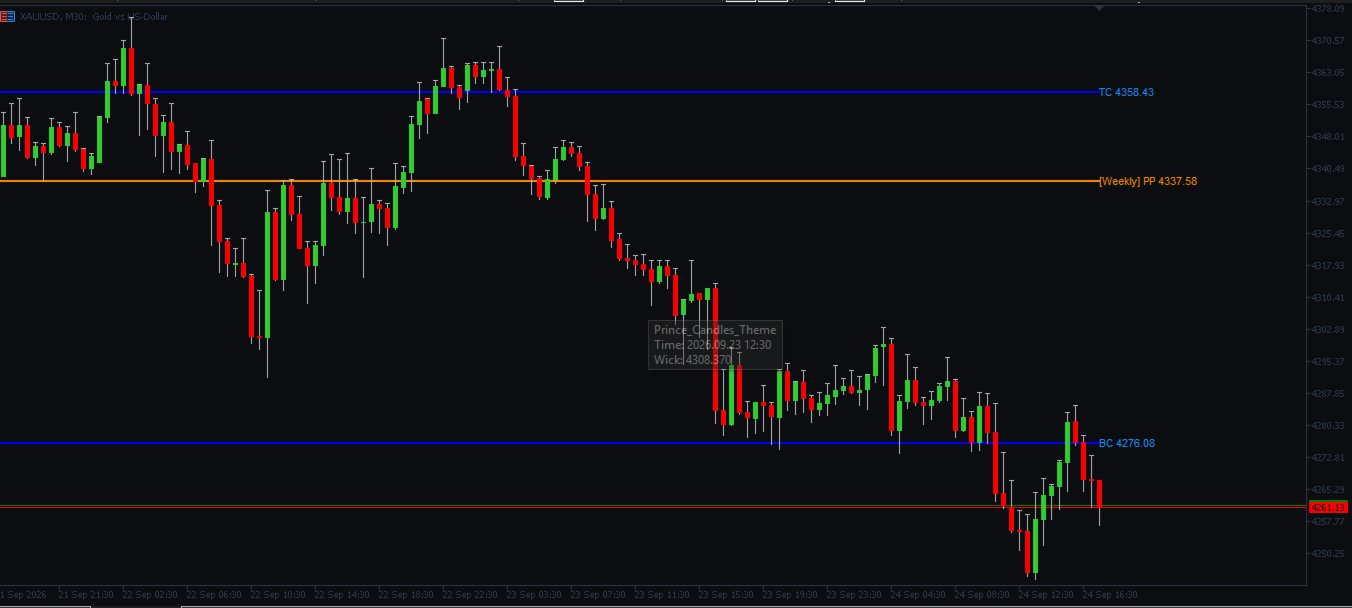
Stop drawing messy, subjective support and resistance lines by hand. The market’s true turning points are calculated by math and liquidity, not guesswork. Nova Multi-Timeframe Pivots automatically plots institutional-grade pivot levels across multiple timeframes, giving you an objective, clean, and highly accurate map of market structure.
Whether you are scalping the London open or swing trading the weekly trend, this indicator ensures you always know where the major reaction zones are before price gets there.
Core Features
1. Comprehensive Multi-Timeframe Mapping
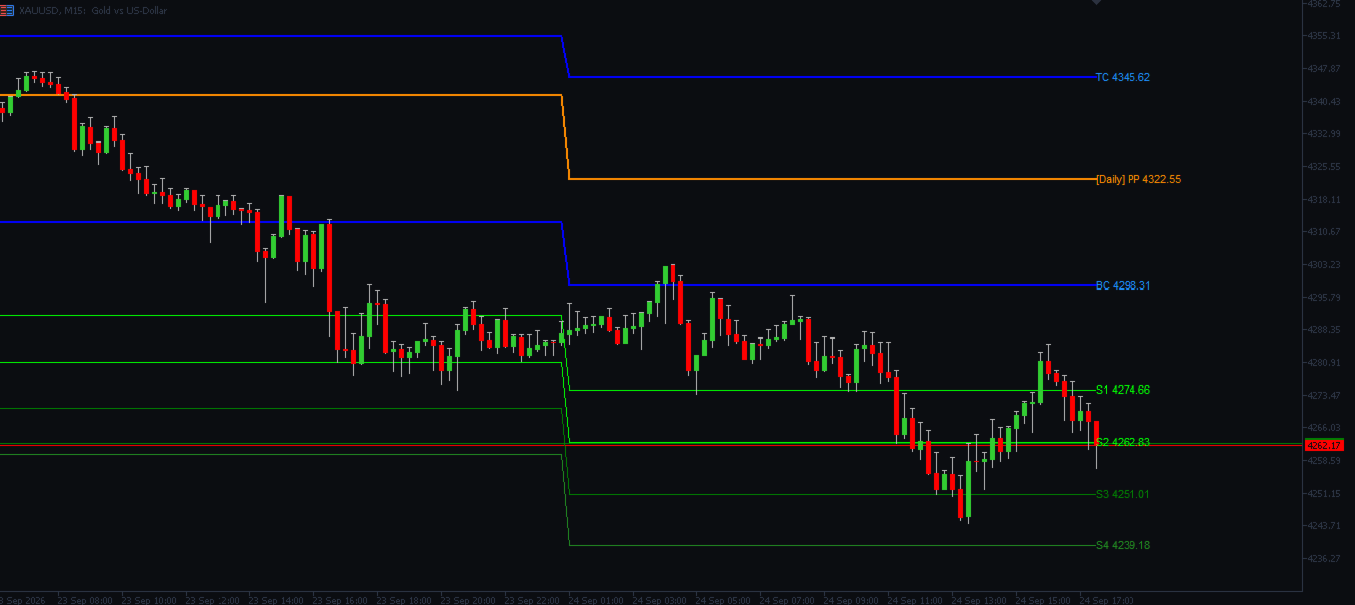
  • Daily, Weekly, and Monthly Pivots: Instantly visualize the key structural levels for the current day, week, and month. The indicator automatically updates and shifts levels as new sessions begin, ensuring your chart is always current.
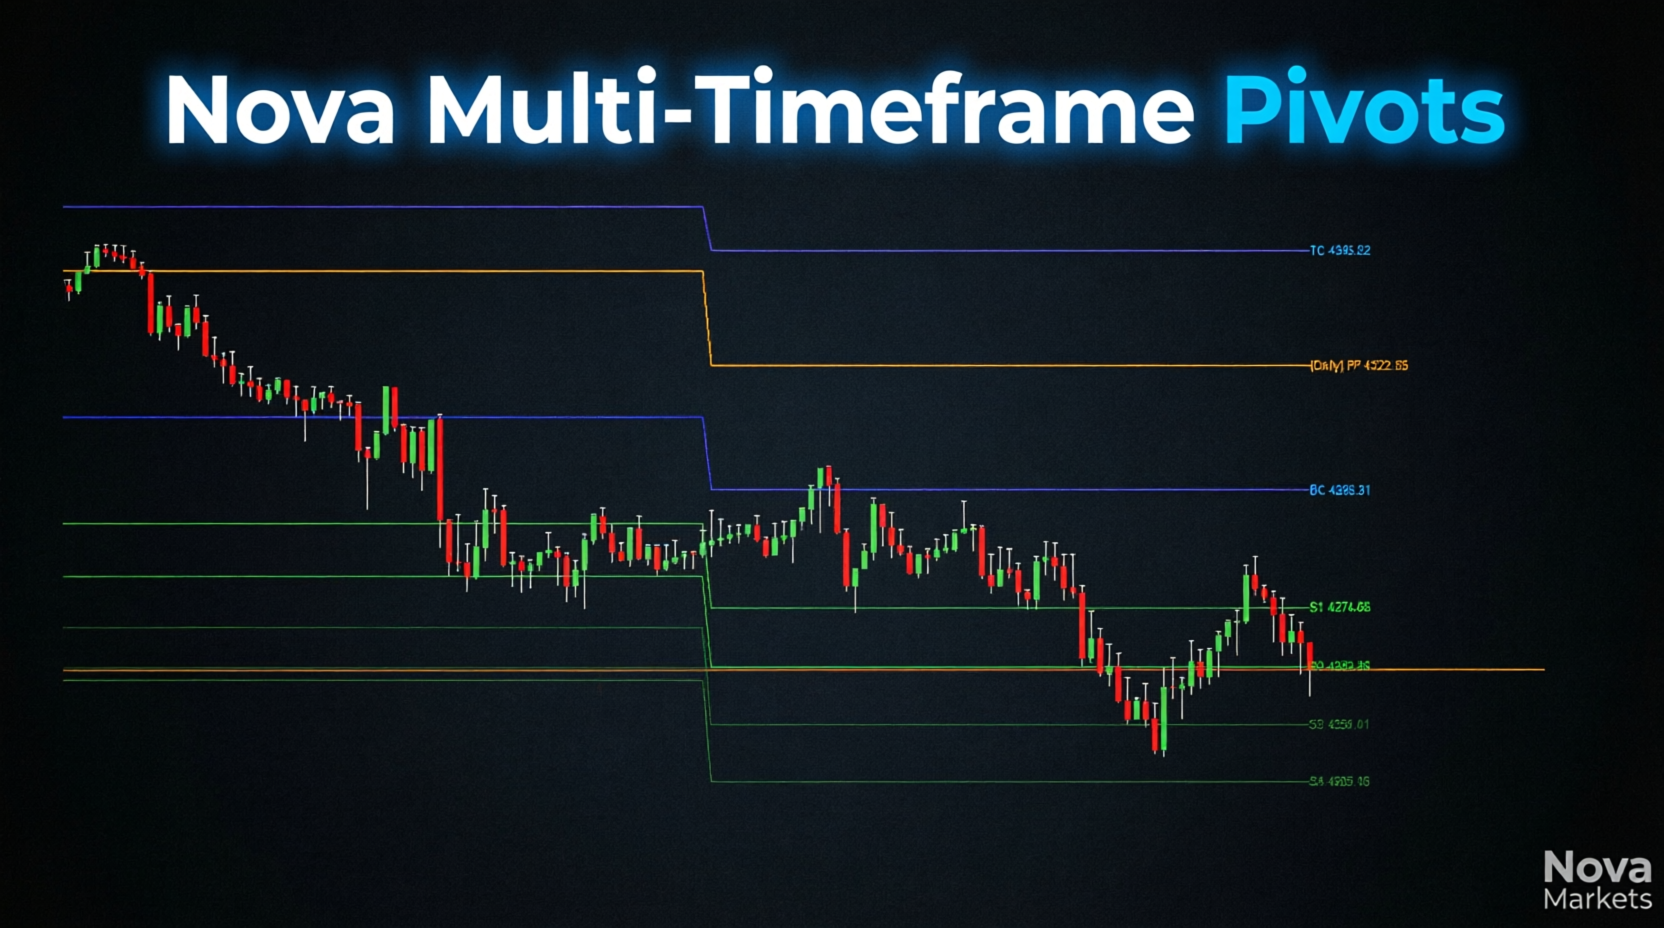
  • Complete Level Suite: Goes beyond standard pivot points. Includes Pivot Point (PP), Top Change (TC), Bottom Change (BC), and multiple tiers of Support and Resistance (S1–S4, R1–R4).
2. Clean, Non-Intrusive Visual Design
  • Color-Coded Clarity: Levels are intelligently color-coded (e.g., Daily PP in orange, structural changes in blue, standard S/R in green) so you can instantly distinguish between timeframes and level importance.
  • Smart Labeling: Every line features a clean, readable label with its exact price value, keeping your chart organized without the visual noise of standard MT5 objects.
3. Zero-Lag, Optimized Performance
  • Built with the same lightweight, state-tracking engine as our Volume Profile. It calculates and renders instantly without freezing your charts or consuming unnecessary CPU resources, even on lower timeframes like the M1 or M5.
4. Full Customization
  • Visual Control: Fully customize the colors, line styles (Solid, Dash, Dot), and thickness for every single level type.
  • Toggle Control: Turn specific timeframes (Daily, Weekly, Monthly) or specific levels (TC, BC, S/R) on or off based on your trading style.
The Value for Traders
  • Trade with Confluence: When a Daily Pivot Point aligns with a Weekly Support level, you have a high-probability institutional zone. Nova makes these confluence areas instantly visible.
  • Day Trading Precision: The Daily Pivot (PP), TC, and BC act as magnetic zones for intraday price action. Use them to set precise take-profit targets or identify high-probability reversal entries.
  • Objective Risk Management: Remove the emotion from your stop-loss and take-profit placement. Let the math-based pivot levels dictate your trade management.
⚙️ Technical Specifications
  • Platform: MetaTrader 5 (MT5)
  • Window Type: Main Chart Window (Overlay)
  • Timeframes: Calculates Daily, Weekly, and Monthly pivots (displays on any chart timeframe).
  • Updates: Real-time, non-repainting, zero-lag optimization.
Stop guessing where price will turn. Map the structure. Trade with precision. Elevate your charting with Nova Multi-Timeframe Pivots.
추천 제품
LT Support Resistance - 지지와 저항을 100% 자동으로 식별 수동으로 지지와 저항선을 그리느라 귀중한 시간을 낭비하는 데 지치셨나요? 아니면 매번 중요한 레벨을 놓쳐서 답답하셨나요? LT Support Resistance는 이러한 번거로운 작업을 없애기 위해 개발되었습니다. 여러 타임프레임(시간족)을 동시에 분석하여, 거래 중인 자산의 가장 중요한 구역을 자동으로 식별하고 차트에 표시해 줍니다. == 중요 레벨의 스마트 자동화 == 주관적이고 시간이 오래 걸리는 수동 라인 작도 대신, 본 지표는 과거 가격 데이터를 분석하여 유의미한 반전 포인트를 식별하고, 가격이 '실제'로 신뢰하고 반응하는 지지 및 저항선을 그려줍니다. 그 결과 데이터에 기반한 객관적이고 신속한 분석이 가능해집니다. == 주요 특징 == 100% 자동 감지: 수동 분석 없이도 지지/저항 레벨 식별 멀티 타임프레임(MTF): M5 차트에서 H1, H4, D1, W1 레벨을 동시에 시각화 스마트 알
Smart Pivot Points
Alexandr Saprykin
MetaTrader 5용 스마트 피벗 포인트 - 스마트 트레이딩을 위한 명확한 레벨 스마트 피벗 포인트는 MetaTrader 5용 전문 지표로, 차트에 주요 트레이딩 레벨을 자동으로 계산하여 표시해 줍니다. 복잡한 가격 움직임을 명확하고 구조화된 지도로 변환하여 지지선, 저항선, 가격 균형점, 그리고 잠재적 목표가를 강조합니다. 명확성을 중시하는 트레이더를 위해 설계된 이 도구는 외환, 암호화폐(비트코인, 이더리움), 주가지수, 주식, 원자재(XAUUSD) 등 모든 시장에서 활용 가능합니다. 이 지표는 계산 시간을 절약하고 분석에 객관성을 더하는 믿음직한 분석 도우미입니다. 시장 신호를 제공하거나 트레이딩 결정을 대신해 주는 것이 아니라, 트레이더 스스로 정보에 기반한 트레이딩 결정을 내릴 수 있도록 고품질의 정보를 제공합니다. 주요 기능 및 이점 바로 사용 가능한 가격 좌표 시스템: 더 이상 레벨을 수동으로 그릴 필요가 없습니다. 중심 레벨(균형점), 지지선, 저항선, 매수
Fibozonesv1pro
Ignacio Souza Hermida
FiboMaster Pro — Automatic Fibonacci with Entry, SL & TP Automatic swing detection and Fibonacci levels with entry, stop loss, and take profit zones, drawn on any instrument and timeframe. FiboMaster Pro automatically detects the most recent swing high and swing low on your chart and draws the full Fibonacci retracement along with reference entry, stop loss, and two take profit levels — no manual drawing required. HOW IT WORKS The indicator scans the last N candles (configurable), identifies the
Future Predictor MT5
Shukurjon Beknazarov
미래 예측기 - 과거 유사 예측 지표 개요 미래 예측기는 최근 가격 패턴을 과거 유사 패턴과 비교하고 그 이후의 추이를 요약하여 보여줍니다. 매수, 매도, 중립 확률, 경험적 범위가 포함된 예상 가격 경로, 그리고 해당 예측의 근거가 된 과거 패턴 목록을 제공합니다. 모든 결과는 과거 데이터를 기반으로 한 통계적 추정치이며, 미래의 결과를 보장하지 않습니다. 작동 방식 1. 패턴 포착: 최근 N개 캔들(시가, 고가, 저가, 이전 종가 대비 종가)을 ATR로 스케일링하여 다양한 변동성 조건을 비교할 수 있습니다. 2. 인과관계 탐색: 과거의 이력만 탐색하며, 결과가 이미 알려진 유사 사례만 고려합니다. 미래 데이터는 사용하지 않습니다. 유사 사례들은 시간적 간격을 두고 발생하므로, 동일한 시장 상황이 중복 계산되지 않습니다. 3. 가중치: 형태가 더 유사한 제품에 더 큰 가중치를 부여합니다. 선택적으로 최근 제품에 가중치를 부여하여 새로운 유사 제품에 더 큰 가중치를 줄 수
Lot Lines Calculator 2
Vyacheslav Ustinov
Большинство профессиональных трейдеров декларируют строгое соблюдение управления рисками. Этот простой инструмент разработан для быстрого расчета размера лота, чтобы торговать в соответствии со следующими базовыми правилами риск-менеджмента: Максимально допустимый риск устанавливается как фиксированный процент от общего количества средств на счете (например, 1-2%). Риск измеряется расстоянием в пунктах между открытием ордера и установленным стоп-лоссом. Так как для новичков всегда затруднительно
Opulence SnR
Tokunbo Greatpath Adebowale
Opulence SnR — Support & Resistance Indicator Automatically detect and display the most relevant support and resistance levels on your chart — no manual drawing, no repainting, no guesswork. Opulence SnR uses confirmed swing point logic to identify where price has genuinely reacted in the past, then draws those levels cleanly on your chart. Every level is locked in only after the required candles have fully closed, so what you see on historical bars today is exactly what you would have seen at t
Flat finder
Yuriy Lyachshenko
이 인디케이터는 플랫을 감지하고 발견된 영역을 컬러 직사각형으로 칠합니다. 이 인디케이터의 주요 아이디어는 가격이 차트의 특정 영역을 채울 때 플랫을 감지하는 것입니다. 입력 매개변수: Color rectangle - 음영 처리할 사각형의 색상입니다. Bars in rectangle - 직사각형에 허용되는 최소 막대 수입니다. Density in % - 플랫의 밀도로, 사각형 영역의 백분율로 설정합니다. __________________________________________________________________ __________________________________________________________________
Buy and Sell ATR
Marco Engstermann
4 (3)
Buy and Sell ATR Indicator updated version 1.2 (2026) ATR-based trend indicator with visual signals, dynamic support/resistance, and TP/SL levels. This indicator identifies market trends using an ATR channel and displays clear Buy and Sell signals.  It draws a dynamic trend line that changes color (green for uptrend, red for downtrend), shows arrows for entries, and plots the latest Take Profit and Stop Loss levels directly on the chart. Detailed Description in the comments post 2. Set files in
FREE
Inversion FVG
Mohamed Amr Mohamed Osama Abdelwahab
Inversion FVG는 공정가치 갭(3개 캔들로 만들어진 불균형)을 찾아내고, 그 갭이 무너지는 순간을 거래하는 인디케이터입니다. 캔들 몸통이 갭을 넘어 마감하면 갭이 "반전"되어 지지 또는 저항이 됩니다. 가격이 재테스트 후 거부되면 화살표와 함께 진입, 손절, TP1, TP2 레벨이 바로 표시됩니다. 작동 방식 1. 상승 또는 하락 FVG를 감지해 기본 구간으로 표시합니다. 2. 캔들 몸통이 구간을 넘어 마감하면 구간이 반전됩니다. 3. 첫 재테스트 + 거부 마감 = 신호 화살표 (파란 위쪽 = 매수, 빨간 아래쪽 = 매도). 4. 손절은 구간 바깥에 ATR 여유를 더해 설정합니다. TP1과 TP2는 R 배수(기본 1R, 2R)입니다. 기능 - 마감된 캔들만 사용: 화살표는 다시 그려지지 않으며 캔들 마감 후 움직이지 않습니다. - 진입, SL, TP1, TP2 선은 가격이 도달하면 거기서 멈춥니다. - 50%(CE) 선, 정보 패널, 활성 구간 카운터. - 팝업, 푸시
MT5용 혁신적인 지표인 Auto Trendline을 소개합니다. 이 지표는 추세선 생성 과정을 자동화합니다. 차트에 추세선을 그리는 번거롭고 시간 소모적인 작업을 이제 그만하세요. Auto Trendline이 모든 작업을 대신해 드립니다! *구매 후 연락 주시면 사용   설명서와 단계별 가이드를 보내드리겠습니다. Auto Trendline은 고급 알고리즘을 통해 추세선을 자동으로 감지하고 그려줍니다. 시간과 노력을 절약해 드립니다. 차트에 지표를 추가하기만 하면 가격 변동의 고점과 저점을 기반으로 추세선을 자동으로 식별하고 그려줍니다. Auto Trendline은 고도의 맞춤 설정이 가능하여 거래 스타일과 선호도에 맞게 지표의 민감도를 조정할 수 있습니다. 또한 다양한 선 스타일과 색상을 선택할 수 있으며, 추세선이 깨질 때 알림을 받도록 설정할 수도 있습니다. 초보 트레이더든 숙련된 트레이더든, Auto Trendline은 모든 시장의 추세를 파악하고 분석하는 데 필수적인 도구입
Gold Sniper Levels PRO
Hericlezia Andrade Assuncao
Gold Sniper Levels PRO is a professional MetaTrader 5 indicator designed specifically for Gold (XAUUSD). It automatically identifies and displays important psychological levels, round numbers, intermediate levels, and attention zones directly on your chart, giving you a cleaner and more organized view of the Gold market. Designed for Gold Trading Gold Sniper Levels PRO uses a structured multi-level system specifically optimized for XAUUSD: Main Levels: 10.00 price intervals Intermediate Levels:
EasyPivot — Smart Pivot Points with Pattern Prediction EasyPivot   is a professional MetaTrader 5 indicator that automatically detects significant High and Low pivot points, analyzes historical sequences of these signals, and provides a statistically based forecast of the next move. Perfect for swing traders, support/resistance traders, and pattern recognition enthusiasts. How It Works The indicator scans the chart and marks key reversal points: High pivot   — a bar whose high price is higher th
FREE
Draw levels of support and resistance based on highs/lows or closes from daily, weekly or monthly. This indicator uses the highs, lows or closes to draw horizontal lines on the graph. By observing those lines you can identify trend (gaining or losing levels of resistence/support) and find good levels where price can bounce. For those who trade price action, this is a very useful indicator.
Trading Discipline Trend Dashboard는 오직 자신의 계좌에서 이미 청산된 거래 내역만 읽어, 네 가지 특정 패턴을 7일간의 추세로 보여줍니다. 이를 통해 어떤 행동이 한 번뿐인지, 아니면 매주 반복되고 있는지를 확인할 수 있습니다. 예측하지 않고 조언도 하지 않습니다. 패널에 표시되는 모든 숫자는 이 계좌에서 이미 일어난 사실입니다. 숫자는 이렇게 만들어집니다: 모든 심볼과 모든 매직넘버를 대상으로 최대 37일치의 청산된 거래를 읽습니다 - 차트에 표시된 심볼에 국한되지 않는 계좌 전체의 그림입니다. 4개 행마다 각각 다른 정의를 사용합니다. Post-loss oversize는 손실로 마감된 거래 이후 10분 이내에, 30일 기준값(같은 조건 신규 진입의 중앙값 랏)을 초과하는 랏으로 열린 신규 진입 건수를 셉니다 - 이는 무료 지표 Trade Behavior Mirror와 동일한 정의입니다. Win-streak oversize는 연승이 계속되는 동안, 같
Session Box And Timer
Nguyen Thanh Trieu
Session Box And Timer 일중 거래(Intraday trading)는 주요 시장 세션 간의 전환을 모니터링해야 하지만, 일정을 수동으로 중첩하면 계산 오류가 발생하기 쉽습니다. 명확한 표시가 없으면 이전 세션의 주요 가격 수준과 유동성 영역을 쉽게 간과할 수 있습니다. Session Box And Timer는 거래 세션, 변동성 추세 및 카운트다운 타이머를 차트에 직접 시각화합니다. 표시 내용: - 세션 박스 (Session Boxes): 아시아, 런던, 뉴욕 세션을 나타내는 시각적인 색상 사각형으로, 라벨에 자동 계산된 핍 범위(pip range)가 표시됩니다. - 아시아 범위 수준: 아시아 세션의 고가 및 저가 투영을 오른쪽으로 수평선으로 연장하여 일중 돌파 기준으로 사용합니다. - 전일 고가/저가 (PDH/PDL): 전일의 고가 및 저가 경계를 표시하는 점선 수평선. - 사이클 라인 및 카운트다운 라벨: 예정된 세션 오픈 시점에 수직선을 그려 다음 세션이 시작될
FREE
Auto Fib Retracements
Ross Adam Langlands Nelson
4.2 (5)
Automatic Fibonacci Retracement Line Indicator. This indicator takes the current trend and if possible draws Fibonacci retracement lines from the swing until the current price. The Fibonacci levels used are: 0%, 23.6%, 38.2%, 50%, 61.8%, 76.4%, 100%. This indicator works for all charts over all timeframes. The Fibonacci levels are also recorded in buffers for use by other trading bots. Any comments, concerns or additional feature requirements are welcome and will be addressed promptly. 
FREE
Candle Timer is a lightweight indicator that shows the remaining time until the current candle closes. It is designed to be minimal and configurable, allowing traders to keep focus on price action while still monitoring candle closing time. The indicator can be displayed as a fixed label on the chart or follow the current market price. Features • Displays remaining candle time • Option to show only the time or include label text • Optional price-following mode • Automatic neutral color base
**Initial Balance Breakout** Professional indicator for displaying Initial Balance (IB) zones of the three major trading sessions: Asian, London, and US. The indicator automatically draws: - Initial Balance High and Low for each session - Optional filled IB zone - Session extension lines (up to the start of the next session) - Fibonacci extension levels (100%, 161.8%, 200%, 261.8%, 361.8%, 423.6%) - 50% level of the IB range (often used as Stop Loss) **Key Features:** - Clear visualization of A
Stryker Levels
Alex Amuyunzu Raymond
Stryker Levels — Precision Daily Breakout Detection with Live TP/SL Projection Every institutional trading desk watches the same two numbers each session: yesterday's high and yesterday's low. These levels are where liquidity pools, where stop hunts happen, and where the highest-probability breakout and reversal setups form. Stryker Levels turns this concept into a fully automated, non-repainting detection engine that works silently in the background so you never miss the moment price commits to
Awesome Oscillator by Bill Williams with the ability to fine-tune and replace the averaging algorithms of the indicator, which significantly expands the possibilities of using this oscillator in algorithmic trading and brings it closer in its properties to such an indicator as the MACD. To reduce price noise, the final indicator is processed with an additional Smooth averaging. The indicator has the ability to give alerts, send mail messages and push signals when the direction of movement of th
ReversalEdge Pro
Brian Kipkoech Cherus
Reversal Edge Pro Reversal Edge Pro is a reversal indicator designed to identify potential market turning points using a combination of RSI behavior, price action, candle structure, volatility, and trend context. The indicator applies a scoring and validation process to filter signals. Instead of displaying every possible reversal, it focuses on setups that meet the selected confirmation conditions. Main Features Reversal detection for potential buy and sell setups RSI, candle structure, volatil
Pivot Points MT5 is a universal color multicurrency/multisymbol indicator of the Pivot Points levels systems. You can select one of its three versions: Standard Old, Standard New and Fibo . It plots pivot levels for financial instruments in a separate window . The system will automatically calculate the Pivot Point on the basis of market data for the previous day ( PERIOD_D1 ) and the system of support and resistance levels, three in each. A user can choose colors for the indicator lines. The on
My Pivot Pro
Ashok Kumar Singha
My Pivot Pro is the Pro Version of the Indicator " My PIVOT " ( Link:  https://www.mql5.com/en/market/product/90336 ) This indicator will help you a lot to decide the Market Range and Movement.  This Indicator is based on Pivot Lines and Support-Resistance zones. Now we can Plot Standard/Classic; Fibonacci; Demark; Camarilla nd Woodies Pivot Levels as per our requirements. Steps to Setup the Indicator: Install the Custom Indicator; Set the Pivot Type; Period and Time ( We recommend to use t
The PUA MultiType Pivot indicator is built on the daily chart of the previous day. The PUA MultiType Pivot indicator is one of the most popular tools in technical analysis, used by traders to identify potential reversal points in financial markets. This indicator constructs three types of Pivot points: Classic, Fibonacci, and Camarilla, each offering its unique approach to market analysis. The advantages of this indicator include: Simplicity and Clarity PUA MultiType Pivot provides clearly defi
Projection of Phi
Nestor Jose Mendez Boza
Projection of Phi   Is a technical indicator that calculates dynamic support and resistance levels. It uses angular geometric projections and mathematical ratios to identify market expansion ranges. Features: Dynamic Fibonacci Expansion: Extension level projection Geometric Calculation: Angular analysis and mathematical ratios Visualization: Graphical objects with informative labels Compatibility: M1 to H4 timeframes Applications: Identification of zones for trade management Analysis of volatil
FREE
Candle Smart Range
Gianny Alexander Lugo Sanchez
5 (1)
MetaTrader 5용 Candle Smart Range (CSR) Candle Smart Range는 여러 타임프레임에서 가격 범위를 자동으로 식별하도록 설계된 기술 지표입니다. 이 도구는 캔들 형성 및 이전 고점/저점과의 상호작용을 바탕으로 시장 구조를 분석합니다. 주요 기능: 범위 감지: 급격한 변동 전의 횡보 구간을 자동으로 식별합니다. 거짓 돌파 식별: 가격이 이전 수준을 넘어섰으나 캔들 종가 기준으로 범위 내에서 마감된 경우를 표시합니다. 멀티 타임프레임 분석: 사용자 정의 주기를 포함하여 최대 19개의 타임프레임 데이터를 한 차트에 표시합니다. 내부 시각화 (줌): 차트 변경 없이 상위 타임프레임 캔들 내부의 가격 움직임을 확인할 수 있습니다. 시간 필터: 주요 시장 세션 등 특정 시간대에만 작동하도록 설정 가능합니다. 과거 데이터 복기 모드: 과거 데이터를 단계별로 탐색하며 지표의 작동을 분석할 수 있습니다. 알림 시스템: 캔들 마감 및 새로운 범위 감지에 대한 사용
Fibonacci Auto
Makarii Gubaydullin
지정된 시간 프레임의 고가 및 저가를 기반으로 피보나치 레벨을 자동으로 플로팅합니다 여러 바   를 결합할 수 있습니다: 예를 들어, 10일 간의 고가 및 저가를 기반으로 피보나치를 얻을 수 있습니다 나의   #1   도구 : 66+ 기능, 이 지표 포함  |   문의하기  |    MT4 버전 잠재적 반전 레벨을 확인하는 데 도움; 피보나치 레벨에서 형성된 패턴은 더 강한 경향이 있음; 수동   플로팅에   드는   시간   대폭  절약 ; 설정: 기준 고가 및 저가를 계산할 시간 프레임 기준 가격 계산을 위한 기간 수 현재(변동) 바 포함/제외 가능 각 레벨 사용자 정의 또는 비활성화 가능 (0으로 설정하여 끔) 전체 레벨 그룹 비활성화 가능: 메인, 상승 및 하락 확장 별도 선 색상, 스타일 및 두께  레벨 가격 표시 활성화/비활성화 가능 나의   #1   도구 : 66+ 기능, 이 지표 포함  |   문의하기  |    MT4 버전
WB Camarilla Pivot Point
Wilbert Sales Bagtas
WB Camarilla Pivot Point Indicator See the Levels. Read the Reaction. Prepare for the Move. Stop guessing where price might turn. Start watching where the market must prove itself. The WB Camarilla Pivot Point Indicator is a powerful chart-analysis tool designed to help traders identify important support and resistance levels, recognize potential breakout opportunities, and monitor possible price reversals using the proven Camarilla pivot-point concept. Built for traders who want a cleaner, more
Stochastic Horizontal Line Alert for MT5 Turn your Stochastic horizontal levels into automatic alerts. Simply draw a line on the Stochastic window and let the indicator monitor it for you.  Your Stochastic levels are monitored automatically — so you don't have to watch the chart all the time. Stochastic Horizontal Line Alert is a simple and convenient MetaTrader 5 indicator that monitors horizontal levels drawn in the Stochastic Oscillator window and automatically alerts you when the Stochasti
Neuro Future
Sergey Rozhnov
신경망 지표       학습 기능이 내장되어 있습니다. 이 시스템은 다단계 맞춤형 퍼셉트론과 고급 학습 설정을 통해 미래 가격 변동을 예측하는 진정한 자율형 인공지능 시스템입니다   . 모든 금융 종목에 대해 지표를 직접 학습시킬 수 있으며, 머신러닝에 대한 특별한 지식은 필요하지 않습니다. 필요한 모든 것이 이 도구에 수집되어 있으며, 자동 모드와 사전 설정을 통해 편리하게 구현됩니다. 주요 업데이트 버전 2.0-2.5 가 출시되었습니다. 고급 입력 기능:지표에 대한 지원이 추가되었습니다. 이제 더 깊은 시장 분석을 위해 원시 가격 데이터를 세 가지 기술 지표와 결합하거나 가격이없는 지표 만 사용할 수 있습니다. 차단하지 않고 라이브 교육:지능형 학습 알고리즘은 백그라운드에서 비동기 적으로 작동합니다. 메타 트레이더 5 터미널은 완전히 반응하여 신경망을 학습하면서 시장을 계속 거래하고 분석 할 수 있습니다. 특징: 간편 시작   . 자동 모드로 빠르게 시작할 수 있는 간단한 설
이 제품의 구매자들이 또한 구매함
Trend Sniper X
Sarvarbek Abduvoxobov
4.86 (44)
Trend Sniper X 는 트레이더가 추세 방향과 잠재적 반전 지점을 명확하고 정확하게 포착할 수 있도록 도와주는 MetaTrader 5용 멀티 타임프레임 추세 추종 지표입니다. MT4용: https://www.mql5.com/en/market/product/193245 가격 정보: 현재 가격은 프로모션 할인가이며, 향후 업데이트 및 새로운 기능이 출시됨에 따라 변동될 수 있습니다. 보너스 혜택: 본 지표 전용 무료 자동매매 Assistant EA를 받으시려면 구매 후 작성자에게 메시지를 보내주시기 바랍니다. Code2Profit 채널 멀티 타임프레임 분석으로 시장을 마스터하세요! Trend Sniper X로 승률을 극대화하는 방법: 핵심 규칙 및 세션 팁 기술 사양 플랫폼 MetaTrader 5 지표 유형 멀티 타임프레임 추세 지표 운용 타임프레임 모든 차트 타임프레임 지원, 독립적으로 선택 가능한 상위 타임프레임(M1–MN1) 주요 상품 외환, 금(XAUUSD) 및 기타 C
새로운 왕의 등장 - 인디케이터 + 주문 관리 표시(TP1 + TP2 + TP3) + 선택형 텔레그램 시그널 전송 기능 포함 (무료) (완전한 트레이딩 및 시그널 시스템) 골드를 위한 최고의 EA: Gold Slayer 이 인디케이터는 고급 전략, 사용자 지정 가능한 주문 관리 시스템, 그리고 엔벨로프 확장을 결합한 평균 회귀(mean reversion) 시스템을 포함하고 있습니다. 또한 RSI와 같은 여러 지능형 확인 필터를 통해 높은 확률의 반전 진입 구간을 포착하여 BUY 및 SELL 시그널을 제공합니다. 단순히 거래 방법만 배우는 것이 아니라, 여러 포지션을 효과적으로 관리하고 이전에 수익 중인 오픈 포지션으로 손실 거래를 커버하는 방법까지 익힐 수 있습니다. M5 전용으로 설계 및 최적화되었으며, 유동성이 풍부해 시그널이 더 깔끔하고 신뢰도 높은 BTCUSD와 XAUUSD에서 뛰어난 성능을 발휘합니다. 이 인디케이터는 ATR 기반으로 자동 계산된 진입가, 손절가, 익절가와
Smart Trend Trading System — MetaTrader 5 구매 후 MQL5에서 저에게 메시지를 보내시면 Smart Universal Expert Advisor를 무료로 받으실 수 있으며, 온라인 강좌, PDF 매뉴얼 및 비공개 그룹 이용 권한도 함께 제공됩니다. STTS는 추세 방향, 진입·청산 신호, 반전 구간, 주요 가격 수준을 차트에 모아 보여줍니다. 시스템을 참고해 수동으로 거래하거나, 별도의 호환 EA를 연결하여 선택한 설정에 따라 자동으로 거래를 실행할 수 있습니다. 하나의 시스템, 네 가지 트레이딩 접근법 STTS의 트레이딩 접근법은 크게 네 가지로 나뉩니다. • 스캘핑 — 단기 신호와 시장 움직임을 살펴봅니다. • 추세 매매 — 방향을 평가하고 추세 안에서 기회를 찾습니다. • 반전 매매 — 잠재적인 전환 구간과 방향 변화를 파악합니다. • 거래량 매매 — 거래량 기반 정보로 시장 활동을 평가합니다. 진입·청산 화살표, 추세 정보, 지지·저항 수
Entry Points Pro for MT5
Yury Orlov
4.52 (152)
Entry Points Pro는 주문을 넣기 전에 어디에서 진입하고, 스탑을 어디에 두고, 어떤 랏으로 거래할지 보여 줍니다. 가격 지금 199 USD이며, 이 가격으로는 10카피입니다. 이후 가격은 249 USD, 최종 가격은 349 USD입니다. 저는 시장에서 트레이딩으로 돈을 벌고 그것을 보여 드립니다. 그래서 이 인디케이터를 모두에게 팔 필요가 없습니다. 스스로 생각하는 트레이더를 위한 도구이지, 마법 버튼이 아닙니다. 화살표는 캔들이 마감될 때 나타나며 리페인팅되지 않습니다. 설정은 두 가지: 예치금과 거래당 리스크. 결제 전에 확인하세요: 무료 데모는 MT5 전략 테스터에서 작동하며 2분이면 됩니다. 구매 후에는 제가 직접 설정을 도와 드리겠습니다. 2019년, 저는 이 지표가 무엇을 할 수 있는지 전 세계에 보여 주었습니다. 실계좌에서 지표의 시그널에 따라 수동으로, 모두가 볼 수 있게 공개적으로 거래했습니다 — 계좌는 Myfxbook에서 모니터링되었고, 저는 이 실험
Ultra Indicator
Ihor Otkydach
5 (1)
ULTRA는 “올인원” 방식으로 작동하는 기술적 지표로, 시장을 독자적으로 분석하고, 매매 신호를 생성하며, 손절매 주문 설정 수준을 표시하고, 이익을 실현하거나 손실을 최소화하기 위해 포지션을 청산해야 할 시점을 제안합니다. 다시 말해, 시장을 분석하는 법을 모르거나, 가격 수준(손절매를 어디에 설정할지)을 파악하지 못하거나, 자금 관리에 어려움을 겪더라도 상관없습니다. ULTRA가 그 모든 것을 대신 해줄 테니까요! 구매자 특전 : ULTRA 지표를 구매하신 후, 저에게 비공개 메시지를 보내주시면 “ULTRA BOT”을 무료 선물로 드립니다. 이 도구는 해당 지표의 신호를 바탕으로 개설한 거래를 관리하는 데 도움을 주는 특별한 도구입니다(각 거래에 대해 손절매를 설정하고, 최상의 결과를 얻을 수 있도록 전략의 규칙에 따라 거래를 자동으로 청산해 줍니다).  또한 구매자분들께 다양한 자산에 바로 적용할 수 있는 설정값을 제공해 드리고 있으며, 이를 통해 지표가 최대 효율로 작동할
SuperScalp Pro
Van Minh Nguyen
4.54 (37)
SuperScalp Pro - Professional Multi-Layer Confluence Scalping System SuperScalp Pro는 기존 Supertrend에 여러 지능형 확인 필터를 추가하여 기능을 강화한 고급 스캘핑 지표입니다. 잘못된 신호를 크게 줄이면서 성공 가능성이 더 높은 Buy/Sell 거래 기회를 식별하는 데 도움을 줍니다. 명확한 Buy 및 Sell 화살표가 차트에 직접 표시되며, ATR 기반 Stop Loss 및 Take Profit 레벨도 실시간으로 자동 계산됩니다. 구매 후 MQL5 메시지로 저에게 연락하시면 SuperScalp Pro Auto Trader EA를 무료로 받으실 수 있으며, 사용자 가이드와 비공개 그룹 이용 권한도 제공됩니다. 권장 설정 파일 다운로드: [Set File] 전체 문서는 제품 블로그에서 확인할 수 있습니다: [User Guide] 업데이트를 받으려면 공식 채널에 참여하세요: [Official Channel]
Gann Made Easy MT5
Oleg Rodin
5 (13)
Gann Made Easy 는 mr.의 이론을 사용하여 최고의 거래 원칙을 기반으로 하는 전문적이고 사용하기 쉬운 Forex 거래 시스템입니다. W.D. 간. 이 표시기는 Stop Loss 및 Take Profit Levels를 포함하여 정확한 BUY 및 SELL 신호를 제공합니다. PUSH 알림을 사용하여 이동 중에도 거래할 수 있습니다. 구매 후 거래 방법 안내 및 유용한 추가 지표를 무료로 받으시려면 저에게 연락주세요! 아마도 Gann 거래 방법에 대해 이미 여러 번 들었을 것입니다. 일반적으로 Gann의 이론은 초보자 거래자뿐만 아니라 이미 거래 경험이 있는 사람들에게도 매우 복잡한 것입니다. Gann의 거래 방식은 이론적으로 적용하기 쉽지 않기 때문입니다. 나는 그 지식을 연마하고 Forex 지표에 최고의 원칙을 적용하기 위해 몇 년을 보냈습니다. 표시기는 적용하기가 매우 쉽습니다. 차트에 첨부하고 간단한 거래 권장 사항을 따르기만 하면 됩니다. 지표는 지속적으로 시장 분석
Boba Analysis Suite
Trade Ready Solutions LLC
5 (2)
Boba Analysis Suite Boba Analysis Suite는 MetaTrader 5용 분석 지표입니다. 시장 구조, 주요 가격 영역, 전반적인 시장 상황을 하나의 차트 화면에 통합하여 표시합니다. 트레이더이자 트레이딩 코치로서의 실무 경험을 바탕으로 개발되었으며, 시장 방향 평가, 주요 가격 수준 식별, 여러 시간대의 종합적인 분석 등 체계적인 분석 과정을 지원합니다. 시장 맥락을 고려한 분석 개별 신호의 의미는 시장 상황에 따라 달라집니다. Boba Analysis Suite는 현재 차트 상황을 더 넓은 시장 구조와 연결하고, 사전에 정한 규칙에 따라 매매 아이디어를 검토할 수 있도록 돕습니다. 주요 분석 기능은 다음과 같습니다. 추세 및 시장 구조: 시장 방향과 관련 구조적 맥락을 평가합니다. 주요 가격 영역 및 수준: 추가 분석이 필요한 중요한 영역을 차트에 시각적으로 표시합니다. 여러 시간대: 서로 다른 시간대의 정보를 통합하여 전반적인 시장 상황을 평가합니다.
FiboSniper Pro
Van Minh Nguyen
5 (4)
FiboSniper Pro – Multi-Filter Fibonacci System with Auto SL/TP and Control Panel FiboSniper Pro는 동적 Fibonacci Envelopes와 여러 확인 필터를 결합하여 선별된 Buy 및 Sell 신호를 생성하는 기술적 지표입니다. Fibonacci 레벨은 Moving Average와 ATR을 기반으로 계산된 후 ADX, EMA, RSI, ATR, Volume, Time 및 Candle 구조를 통해 필터링됩니다. 이 지표는 ATR 기반의 자동 Stop Loss 및 Take Profit 레벨을 차트에 직접 표시하며, 빠른 설정 조정을 위한 인터랙티브 Control Panel을 제공합니다. 구매 후 MQL5 메시지로 저에게 연락하시면 Auto Trader X를 무료로 받으실 수 있으며, 이 지표의 거래 신호를 자동화하는 방법에 대한 안내도 제공됩니다. User Guide 및 Set Files: [Click here
다음 업데이트 — 버전 2.52 곧 출시! [신규] 시장 분석 및 트레이딩 워크플로를 향상시키기 위해 설계된 4가지 주요 신규 기능을 기대해 주세요. 트레이딩 요구 사항을 충족하도록 설계된 4가지 새로운 기능으로 시장 분석을 한 단계 더 발전시킵니다. 다음 기능을 소개합니다: 1. TRADE OVERVIEW DASHBOARD 2. CONFLUENCE AT ZONE 3. STRONG & WEAK HIGH/LOW 4. OTE 1. TRADE OVERVIEW DASHBOARD 시장 전체 상황을 더 쉽게 파악할 수 있도록 도와주는 대시보드입니다. 트레이딩 의사결정을 지원하는 가이드를 제공하며, 하나의 화면에서 시장을 분석하고 체계적으로 트레이딩을 계획할 수 있도록 도와줍니다. 멀티 타임프레임 시장 개요 (Multi-Timeframe Market Overview) 시장 방향과 가격 구조를 더욱 명확하게 파악 시장 상황을 빠르게 확인 체계적인 시장 분석 및 진입 계획을 위한 가이드 2. CO
M1 Sniper MT5
Oleg Rodin
5 (7)
M1 SNIPER 는 사용하기 쉬운 거래 지표 시스템입니다. M1 시간대에 맞춰 설계된 화살표 지표입니다. 이 지표는 M1 시간대 스캘핑을 위한 단독 시스템으로 사용할 수 있으며, 기존 거래 시스템의 일부로도 사용할 수 있습니다. 이 거래 시스템은 M1 시간대 거래용으로 특별히 설계되었지만, 다른 시간대에도 사용할 수 있습니다. 원래는 XAUUSD와 BTCUSD 거래를 위해 이 방법을 설계했지만, 다른 시장 거래에도 유용하다는 것을 알게 되었습니다. 이 지표의 신호는 추세 방향과 반대로 거래될 수 있습니다. 저는 지표의 신호를 활용하여 양방향으로 거래할 수 있도록 돕는 특별한 거래 기법을 알려드립니다. 이 방법은 특별한 동적 지지선과 저항선 가격 영역을 활용하는 것을 기반으로 합니다. 구매하시면 M1 SNIPER 화살표 지표를 바로 다운로드하실 수 있습니다. 또한, 아래 스크린샷에 표시된 Apollo Dynamic SR 지표는 M1 SNIPER 도구를 사용하는 모든 사용자에게 무료로
Auto Optimized SpeedAngle 은 지속적인 워크포워드 최적화(Walk-Forward Optimization, WFO)를 통해 곡선 적합(curve-fitting)을 제거한 기관 수준의 모멘텀 벡터화 시스템입니다. 시장 체제가 바뀔 때 성능이 떨어지는 정적 입력에 의존하는 대신, 이 지표는 표본 외(Out-of-Sample, OOS) 검증을 사용하여 매개변수를 동적으로 재보정하며, 표시되는 신호가 과거의 우연이 아닌 진정한 통계적 우위를 나타내도록 보장합니다. 핵심 기관용 프레임워크 워크포워드 최적화 엔진: 핵심 알고리즘은 수천 가지의 룩백(lookback) 및 임계값 조합을 지속적으로 스캔하며, 데이터를 인샘플(in-sample)과 표본 외(out-of-sample) 세트로 엄격하게 분리합니다. 미지의 데이터 환경에서 수학적 우수성이 증명된 경우에만 새로운 매개변수 구성을 채택합니다. 정량적 목적 함수: 순수한 총이익을 쫓는 대신, 최적화 엔진은 기관 수준의 안정성
SQN Max indicator for MT5 by ITC
Renaud Herve Francois Candel
Sqn Max Indicator Sqn Max is an exclusive indicator to trade the market with high effectiveness. The indicator is based on price action, volatility and trend. This indicator is as simple as possible but not too simple. The indicator can generate alerts to ease the trading process. You don't have to stay all day in front of your screen. The indicator can be used with any class of assets and with any time frame. It is possible to achieve better results trading our list of selected assets. We achi
Crystal Heikin Ashi Signals
Muhammad Jawad Shabir
5 (5)
Crystal Heikin Ashi Signals—Professional Trend & Signal Detection Indicator Advanced Heikin Ashi Visualization with Intelligent Signal System for Manual & Automated Trading Final Price: $149 ---------> Price goes up $10 after every 10 sales . Limited slots available — act fast . Overview User Guide PDF Crystal Heikin Ashi Signals is a professional-grade MetaTrader 5 indicator that combines pure Heikin Ashi candle visualization with an advanced momentum-shift detection system. Designed for both m
FX Power MT5 NG
Daniel Stein
5 (33)
FX Power: 통화 강세 분석으로 더 스마트한 거래 결정을 개요 FX Power 는 어떤 시장 상황에서도 주요 통화와 금의 실제 강세를 이해하기 위한 필수 도구입니다. 강한 통화를 매수하고 약한 통화를 매도함으로써 FX Power 는 거래 결정을 단순화하고 높은 확률의 기회를 발견합니다. 트렌드를 따르거나 극단적인 델타 값을 사용해 반전을 예측하고자 한다면, 이 도구는 귀하의 거래 스타일에 완벽히 적응합니다. 단순히 거래하지 말고, FX Power 로 더 스마트하게 거래하세요. 1. FX Power가 거래자에게 매우 유용한 이유 통화와 금의 실시간 강세 분석 • FX Power 는 주요 통화와 금의 상대적 강세를 계산하고 표시하여 시장 역학에 대한 명확한 통찰력을 제공합니다. • 어떤 자산이 앞서고 있고 어떤 자산이 뒤처지는지 모니터링하여 보다 현명한 거래 결정을 내릴 수 있습니다. 포괄적인 멀티 타임프레임 뷰 • 단기, 중기 및 장기 타임프레임에서 통화와 금의 강세를
Trend Catcher ind mt5
Ramil Minniakhmetov
5 (18)
트렌드 캐처 인디케이터 트렌드 캐처 인디케이터는 개발자가 자체 개발한 맞춤형 적응형 트렌드 분석 지표들을 조합하여 시장 가격 움직임을 분석합니다. 단기적인 노이즈를 제거하고 근본적인 모멘텀 강도, 변동성 확대, 가격 구조 움직임에 집중하여 진정한 시장 방향을 파악합니다. 또한 이동 평균, RSI, 변동성 필터와 같은 맞춤형 지표들을 활용하여 가격을 평활화하고 트렌드를 필터링합니다. 실제 운영 모니터링 및 기타 제품은 다음 링크에서 확인하실 수 있습니다:   https://www.mql5.com/en/users/mechanic/seller 텔레그램에서는 EA나 설정 파일을 판매하지 않습니다. 사기이니 주의하세요. 모든 설정 파일은 블로그에서 무료로 제공됩니다. 중요! 구매 후 즉시 연락 주시면 사용 방법 및 보너스를 드립니다!
Scalper Vault MT5
Oleg Rodin
5 (1)
Scalper Vault는 당일 매매(intraday trading)에서 일관된 성과를 내고자 하는 트레이더를 위해 설계된, 강력하고 모든 기능을 갖춘 트레이딩 시스템입니다. 이 고정밀 지표는 외환(Forex) 및 바이너리 옵션 트레이더 모두에게 기관급 분석을 제공하는 독립적인 종합 트레이딩 시스템 역할을 합니다. 구매 후 저에게 연락해 주시면, 트레이딩 팁과 함께 특별한 보너스를 제공해 드립니다! Scalper Vault는 추측에 의존하거나 복잡한 수동 분석을 할 필요를 없애주며, 사용하기 쉬운 트레이딩 기법을 통해 오직 매매 실행에만 집중할 수 있도록 돕습니다. 정확한 추세 추종 신호: 핵심 알고리즘이 시장 구조를 분석하여, 지배적인 시장 추세 방향과 일치하는 고확률 신호만을 제공함으로써 잘못된 진입을 획기적으로 줄여줍니다. 정밀한 고점 및 저점 탐지: 시장의 움직임이 소진되는 지점을 스캔하여 잠재적인 반전 구간을 식별합니다. 간(Gann) 이론 기반의 매수/매도 구간: 수학적
SIO Oscillator
Davit Beridze
SIO Oscillator: 자기 최적화 세미분산 불균형 오실레이터 지표를 구매하시면 이를 기반으로 한 전문가 어드바이저(EA)를 무료로 받으실 수 있습니다. 대부분의 오실레이터는 모든 가격 움직임을 똑같이 취급합니다. SIO는 상승 압력과 하락 압력을 분리하여 둘 사이의 불균형을 측정하고, 매수자와 매도자 중 어느 쪽이 실제로 시장을 주도하고 있는지 보여줍니다. 불균형이 극단에 도달하면 SIO는 진입가, 손절(Stop Loss), 익절(Take Profit) 수준이 포함된 명확한 신호를 표시합니다. SIO의 차별점은 고정된 설정에 의존하지 않는다는 것입니다. 내장된 자기 최적화 엔진이 현재 종목과 시간 프레임에 맞는 파라미터를 지속적으로 탐색하고, 사용하기 전에 검증합니다. 두 가지 신호 모드 평균 회귀(Mean Reversion): 불균형의 극단에서 거래하며 균형으로의 복귀를 노립니다. 추세 추종(Trend Following): 지속적이고 우세한 불균형의 방향으로 거래합니다. 자
Dynamic Forex28 Navigator MT5
Bernhard Schweigert
5 (1)
다중 통화 강도 및 모멘텀 지표 MT5 Dynamic Forex28 Navigator는 오랫동안 사랑받아 온 인기 지표들의 진화형으로, 다섯 가지의 힘을 하나로 결합했습니다. Advanced Currency Strength28 Indicator (리뷰 700개) Advanced Currency IMPULSE with ALERT (리뷰 530개) Currency Strength EXOTICS GOLD Impulse with Alert CS28 Combo Signals (최근 보너스) 지표 네 개를 따로 구매해 차트에 겹쳐 놓을 필요가 없습니다. 28개 Forex 페어의 강도, 이를 이끄는 시장의 모멘텀, 그리고 두 가지 모두의 알림이 하나의 강력한 지표로 통합되어 한 창, 한 차트에서 확인할 수 있습니다. 위 프로그램들은 MQL5 Market에서 1,200개 이상의 리뷰를 받았으며 2016년부터 MT4 커뮤니티의 필수 지표로 자리잡았습니다. Dynamic Forex28 Navigato
Adaptive Price Action Engine 지표를 구매하면 EA(자동매매 프로그램)가 무료 멀티 타임프레임 기반 자기 최적화 추세 & 캔들 패턴 분석 시스템 시장은 끊임없이 변화하며, 모든 Price Action 패턴이 모든 시장 환경에서 동일한 가치를 가지는 것은 아닙니다. Adaptive Price Action Engine 은 변화하는 시장 환경에 적응할 수 있도록 설계되었으며, 추세 구조, 멀티 타임프레임 분석, 캔들 패턴 및 통계적 최적화 를 하나의 분석 프레임워크로 결합합니다. 두 가지 적응형 모드 Dual Alpha Trend Mode 낮은 타임프레임과 높은 타임프레임에서 적합한 Alpha Trend 파라미터를 자동으로 탐색하여, 최근 시장 움직임에 맞춰 추세 분석을 조정합니다. Candlestick + Alpha Mode Alpha Trend를 통한 시장 국면 분석과 22개의 상승 및 하락 캔들 패턴 을 결합합니다. 모든 패턴을 동일하게 취급하는 대신, 다양
Azimuth Pro
Ottaviano De Cicco
5 (7)
Azimuth Pro V2: Synthetic Fractal Structure and Confirmed Entries for MT5 Overview Azimuth Pro is a multi-level swing structure indicator by Merkava Labs . Four nested swing layers, swing-anchored VWAP, ABC pattern detection, three-timeframe structural filtering, and closed-bar confirmed entries — one chart, one workflow from micro-swings to macro-cycles. This is not a blind signal product. It is a structure-first workflow for traders who care about location, context, and timing. Halloween P
Neuro Poseidon MT5
Daria Rezueva
4.68 (53)
Neuro Poseidon is a new indicator by Daria Rezueva. It combines precise trading signals with adaptive TP/SL levels - creating best possible trades as a result! Message me and get  Neuro Poseidon Assistant  as a gift to automize your trading process! What makes it stand out? 1. Proven profitability on all assets and timeframes 2. Only confirmed BUY and SELL signals present on the chart 3. Adaptive TP & SL levels generated by the software for each trade 4. Easy to understand - suitable for al
PZ Swing Trading MT5
PZ TRADING SLU
5 (5)
Protect against whipsaws: revolutionize your swing trading approach Swing Trading is the first indicator designed to detect swings in the direction of the trend and possible reversal swings. It uses the baseline swing trading approach, widely described in trading literature. The indicator studies several price and time vectors to track the aggregate trend direction and detects situations in which the market is oversold or overbought and ready to correct. [ Installation Guide | Update Guide | Tro
SkyHammer Signal Pro
Shengzu Zhong
5 (5)
SkyHammer Signal Pro Entry, SL, TP 레벨이 고정되는 전문 No-Repaint 추세 신호 인디케이터 SkyHammer Signal Pro는 명확하고 고정되며 검증 가능한 신호를 원하는 트레이더를 위해 설계된 구조적인 추세 및 모멘텀 신호 인디케이터입니다. 특히 M1 및 M5 같은 낮은 시간대에서 가장 효과적으로 작동합니다. 이 인디케이터는 시장의 고점이나 저점을 예측하려고 하지 않습니다. 대신 신호를 생성하기 전에 확인된 시장 구조, 추세 방향, 모멘텀 강도, 건강한 변동성, 그리고 목표까지의 충분한 공간을 기다립니다. 주요 기능 고정 신호 메커니즘 신호가 확인되면 화살표, Entry, Stop Loss, TP1, TP2 레벨이 차트에 영구적으로 고정됩니다. 이후 캔들 움직임 때문에 신호가 사라지거나, 이동하거나, 변경되지 않습니다. 이를 통해 트레이더는 각 신호를 명확하게 검토할 수 있으며, 실시간 시장에서 신호가 사라지는 일반적인 문제를 피할 수 있습니다
Advance AI Scanner
Mohamed Samsudeen
5 (1)
Advance AI Scanner is a multi-symbol analysis indicator for MetaTrader 5. It scans Forex pairs, metals, energy, stock indices and cryptocurrencies at the same time and rates each instrument with its own self-training model. It explains in plain English what moved each market and why, and it estimates how far upcoming economic news usually moves each symbol, measured on your broker's own price history. $199 instead of $499. 10 copies left at this price. One time purchase  Installation and User
가격이 역전되고 후퇴함에 따라 시장 구조가 변경됩니다. 시장 구조 반전 경고 표시기는 추세 또는 가격 움직임이 고갈에 가까워지고 반전할 준비가 되었음을 식별합니다. 일반적으로 반전이나 큰 하락이 일어나려고 할 때 발생하는 시장 구조의 변화를 알려줍니다. 지표는 가능한 고갈 지점 근처에서 새로운 고점 또는 저점이 형성될 때마다 초기에 돌파와 가격 모멘텀을 식별합니다. 표시기는 반대쪽에 있는 마지막 촛불에 직사각형을 그립니다. 그런 다음 현재의 단기 추세에서 계속 움직이기 때문에 가격과 함께 직사각형을 따라갈 것입니다. 가격이 사각형 위나 아래로 다시 닫힐 정도로 약해지면 시장 구조에 잠재적인 변화가 일어나고 있음을 나타냅니다. 그런 다음 표시기는 방향의 잠재적인 이동과 추세 또는 주요 하락의 가능한 반전 시작에 대해 경고합니다. 작동 방식을 보려면 아래의 작동 표시기를 참조하십시오! 모든 쌍 및 주요 기간을 모니터링하는 대시보드: https://www.mql5.com/en/m
Break and Retest Hunter
Mohamed Hassan
4 (4)
Break and Retest Hunter is a powerful MetaTrader 5 indicator designed to automatically identify support and resistance levels, breakout structures, and potential retest opportunities in real time. Bonus Indicator: After purchasing Break and Retest Hunter , contact me to receive Trade Indicator Assistant EA completely free as a bonus utility. $65 for the next 10 copies . Next price is $120.  Combining adaptive market analysis, clear BUY/SELL signals, Fibonacci-based profit targets, and a premiu
DayTrader PRO
Davit Beridze
5 (4)
DayTrader PRO DayTrader PRO는 존 에러스(John Ehlers)의 Laguerre 필터와 강력한 자동 최적화 엔진을 결합한 고급 트레이딩 지표입니다. 고정된 파라미터를 사용하는 대신, 최근 시장 상황을 바탕으로 최적의 설정을 자동으로 검색하므로 지속적인 수동 조정 없이도 변화하는 시장 변동성에 대응할 수 있습니다. 이 지표는 명확한 매수(BUY) 및 매도(SELL) 신호를 생성하며, 현재 시장 변동성을 기준으로 계산된 적응형 손절매(Stop Loss) 및 익절(Take Profit) 레벨을 제공합니다. 내장된 추세, 효율성 지수(Efficiency Ratio), 변동성 및 캔들 필터 기능은 저품질의 진입 신호를 제거하여 신호의 정확도를 높여줍니다. 실시간 성능 대시보드에서는 현재 최적화된 설정값, 수익 요인(Profit Factor), 승률(Win Rate), 최대 낙폭(Drawdown) 및 기타 트레이딩 통계를 확인할 수 있습니다. 또한 DayTrader PR
Apex Patterns PRO 인디케이터 구매 시 - 기반 Expert Advisor 무료 제공. 자체 최적화 차트 패턴 및 브레이크아웃 분석 시스템 기존의 패턴 스캐너는 고정된 파라미터에 의존하므로 시장 변동성과 구조가 변화할 때 성능이 저하되는 경우가 많습니다. Apex Patterns PRO는 구조적 차트 패턴 인식, 모멘텀 필터링, 통계적 자체 최적화를 하나의 분석 프레임워크로 결합하여 변화하는 시장 환경에 적응하도록 설계되었습니다. 적응형 스캐닝 엔진 자체 최적화 패턴 모드 최근 과거 데이터를 바탕으로 적절한 패턴 파라미터를 자동으로 탐색하여, 정적인 설정 대신 현재 시장 행보에 맞춰 인디케이터의 구조 감지 방식을 적응시킵니다. 스마트 브레이크아웃 필터링 클래식 패턴 인식과 모멘텀, 거래량, 프라이스 액션 지표를 결합합니다. 모든 브레이크아웃을 동일하게 다루는 대신, 시장의 기저 구조를 평가하여 현재 통계적 환경에 부합하는 셋업을 식별합니다. 주요 기능 리페인트 없는 고
Power Candles MT5
Daniel Stein
4.58 (12)
Power Candles V3 - 자체 최적화 강도 지표 파워 캔들 V3는 적용된 모든 차트에서 통화 및 상품의 강세를 실행 가능한 거래 계획으로 전환합니다. 단순히 캔들에 색상을 입히는 대신, 백그라운드에서 실시간 자동 최적화를 수행하여 현재 보고 있는 종목에 대한 최적의 손절매, 익절 및 신호 임계값을 제공합니다. 한 번의 클릭으로 실시간 거래에 적용할 수 있으며, 진입점, 손절매 및 익절 선이 정확한 가격에 맞춰 차트에 표시되고, 방향과 함께 알림이 발령됩니다. 이 도구는 Stein Investments 에코시스템의 일부입니다. 18개 이상의 도구와 함께 당신의 1대1 AI 트레이딩 멘토 Max.  항상 대기 중, 모든 인디케이터를 깊이 있게 이해, 무언가를 차근차근 생각해보고 싶은 순간에 도움을 줍니다.  https://stein.investments 에서 만나보세요 매 종가 바마다 3,000회 이상의 트레이딩 시뮬레이션. 9가지 강도 상태. 2가지 전략을 병렬로 테스트.
제작자의 제품 더 보기
Nova Volume Profile
Joseph Chege Githuku
Nova Volume Profile: Master Auction Market Theory with Precision Stop guessing where the smart money is positioning. See it. Standard MT5 volume tools are often clunky, visually overwhelming, and prone to flickering. Nova Volume Profile was built from the ground up for modern price action and Auction Market Theory traders. It delivers institutional-grade volume analysis with a sleek, non-intrusive design that keeps your charts clean and your focus sharp. Whether you are trading breakouts from th
Nova HT Liquidity Zones
Joseph Chege Githuku
HTF Liquidity Mapper: Trade Lower Timeframes with Institutional Context Stop chart-hopping and guessing market direction. The HTF Liquidity Mapper projects key Higher Timeframe (HTF) liquidity zones directly onto your Lower Timeframe (LTF) charts, giving you macroscopic market context in real-time.  By visualizing where institutional orders rest, you can objectively identify whether the market is setting a trap or establishing a new trend. Core Trading Concepts Visualized: 1. Liquidity Swee
Nova CVD: Master Market Momentum with the Volumatic Trend Filter Price action tells you what the market is doing. Volume tells you why.  Trading in the direction of rising volume is the foundational edge for profitable trading. But standard Cumulative Volume Delta (CVD) is notoriously noisy. Jagged, erratic spikes make it difficult to distinguish between genuine institutional accumulation and random market noise.  Enter Nova CVD.  We rebuilt the standard CVD from the ground up and engineere
Nova SuperTrend Follower
Joseph Chege Githuku
Nova SuperTrend Follower See the market clearly. Trade with precision. Follow the trend with confidence. The Nova SuperTrend Follower is a powerful, multi-layered indicator combining institutional VWAP with a fully customizable dual EMA system. It cuts through the noise to give you crystal-clear market visibility, perfect entry timing, and early reversal detection. The Core Components VWAP — The Volume Anchor Tracks institutional money flow. Unlike standard averages, VWAP filters out low-volum
Nova Liquidity Zones for MT5  Bookmap-Style Liquidity Zones for MetaTrader 5 See Where the Smart Money Hunts Stops — Before They Do. Nova Liquidity Grab Levels is a professional-grade liquidity visualization indicator that maps out where institutional traders place their orders — directly on your MT5 chart, in the iconic Bookmap heat-map style. Stop guessing where price will reverse.  Start seeing where the liquidity pools actually sit. What It Does Major price moves don't happen randomly.
필터:
리뷰 없음
리뷰 답변