Fisher Transform MSI

MSI-FT Bi-Driven

What It Does and Why It Matters

The problem it solves 

The Fisher Transform tells you where price sits within its recent range, and when momentum is turning. On its own it answers one question: is Fisher above or below its Trigger? Traders who rely on that alone enter late, exit late, and cannot tell whether a signal is fresh or stale.

MSI-FT Bi-Driven answers the questions that come after that one.

Trader's question What answers it
Is a cross actually coming, or is Fisher just moving fast? PROXIMITY
Is the move still building? SLOPE
Is Fisher on the right side of zero? REGIME
Is price at an extreme where a reversal is likely? ZONE
Do the higher timeframes agree? HTF filter
Is this signal still valid or has it aged out? Signal Age
Which direction does the evidence actually favour right now? Confidence meter
Why did the EA not take that trade? Status line

Five signal layers, not one

Each layer measures a different property of the same Fisher calculation. They are independent — they can agree, disagree, or split.

  • SIGNAL — Fisher crossed its Trigger. The classic crossover.

  • PROXIMITY — Fisher is closing on its Trigger. Detects the approach, not the arrival. This is the earliest warning the EA produces.

  • SLOPE — Fisher is trending up or down over the last three bars. Confirms the move is still in motion.

  • REGIME — Fisher is above or below zero. Slowest, most stable context.

  • ZONE — Overbought, oversold, or extreme. Context for whether a reversal is likely.

Each can be toggled on or off. Each contributes a fixed weight to the confidence score when enabled.

Confluence, not coincidence

A single layer firing is one opinion. Two or more agreeing is a decision.

The confidence meter aggregates the enabled layers into two independent scores — one for BUY alignment, one for SELL alignment. The weights are fixed and disclosed:

Layer Weight
SIGNAL 30
PROXIMITY 25
SLOPE 20
REGIME 15
ZONE ±10 / ±5

The two scores do not sum to 100. Both can be high when the layers disagree — which is exactly the moment to stand aside. Both low means no edge. The meter shows this instantly.

Entry logic: OR or AND

  • OR — any enabled layer triggers. More trades, earlier entries.

  • AND — all enabled layers must agree. Fewer trades, tighter filter.

A single input toggles between them. No code editing, no parameter rebalancing.

The HTF filter — five modes, one input

The EA reads one column across three higher timeframes and votes 2-of-3.

Mode What it filters on Character
SIGNAL Crossover consensus Fastest
PROXIMITY Cross-imminent consensus Earliest
SLOPE Trend consensus Balanced
REGIME Sign consensus Slowest
ZONE Extreme gate only — no directional filter Context only

BULLISH consensus allows BUY, blocks SELL. BEARISH does the opposite. NEUTRAL allows both. In ZONE mode the filter stops being directional and becomes a gate: extreme overbought blocks BUY, extreme oversold blocks SELL.

Event mode vs State mode — one switch

Mode Behaviour
STATE-DRIVEN Re-enters on the next bar if signals stay aligned. Pyramids into a running trend.
EVENT-DRIVEN One entry per signal transition. Waits for the state to flip before entering again.

Both modes respect every filter — HTF, ZONE gate, spread, session, position limits, staleness, proximity. The switch changes how often entries occur, not whether they are filtered.

Trade lifecycle management

The EA runs the position from open to close, not just at entry.

  • Take profit and stop loss — set at entry, enforced against broker minimum distance.

  • Breakeven — moves the stop to entry plus a buffer once profit reaches a threshold. Can be set as a percentage of TP or a fixed number of points.

  • Trailing stop — activates at a defined profit level and trails by a fixed distance with a step filter to prevent churn. Can be held back until breakeven is reached.

  • Partial close — closes a portion of the position at defined profit levels. Can be a fixed number of points or a percentage of TP.

  • Reversal — when an exit signal fires and the opposite direction is now valid, the EA closes and reverses in one operation.

Every management step respects the broker's stops level and freeze level.

Risk management

  • Position limits — separate caps for BUY and SELL. Set either to zero to run long-only or short-only. Set both positive for two-way operation.

  • Lot sizing — fixed lots, percent of balance risked against the stop, or a fixed percent of equity. The chosen method scales the lot automatically.

  • Margin safety — before every order, the EA checks that required margin stays within a fraction of free margin. If it does not, the lot is reduced to fit, or the trade is skipped. No margin-call-by-EA.

  • Spread filter — blocks entries when the spread exceeds a threshold. The threshold is yours to set.

  • Session filter — restrict trading to chosen hours, or leave it open 24/7.

  • Entry spacing — optional minimum distance between same-direction entries, to prevent clustering.

The panel — what the trader sees

One panel, read top-down.

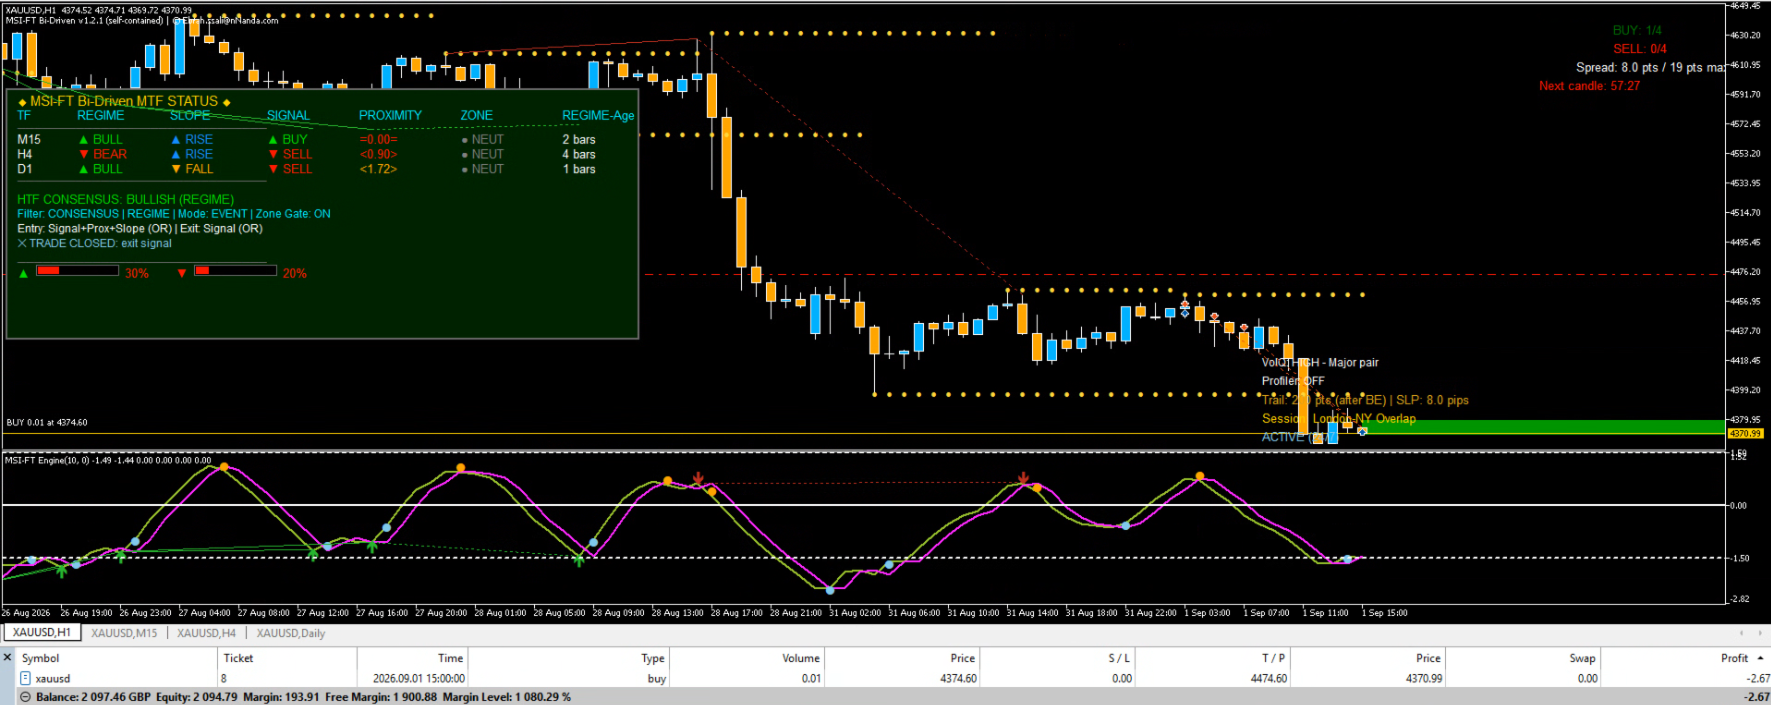
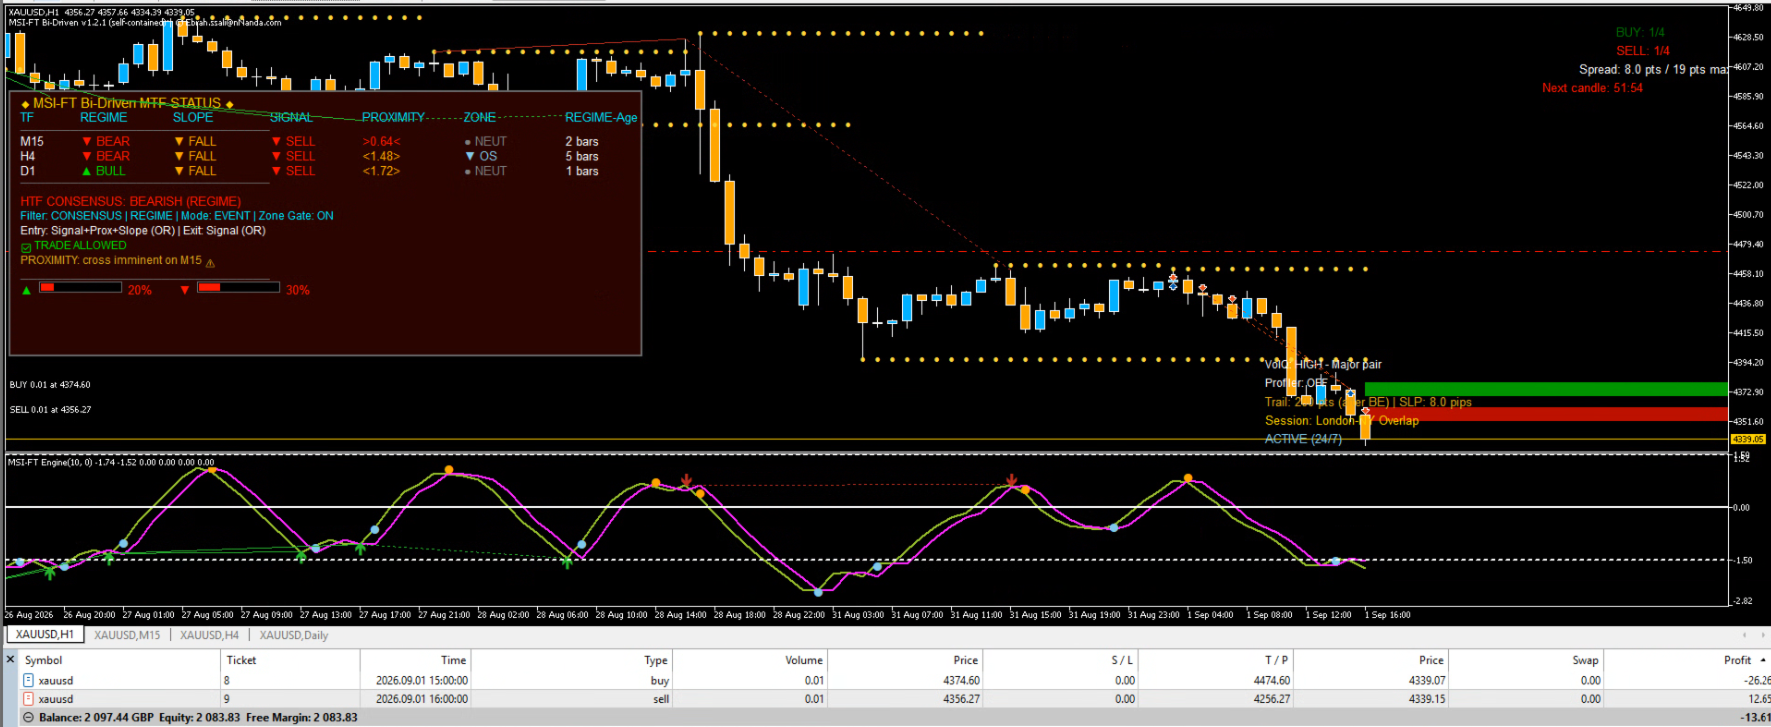
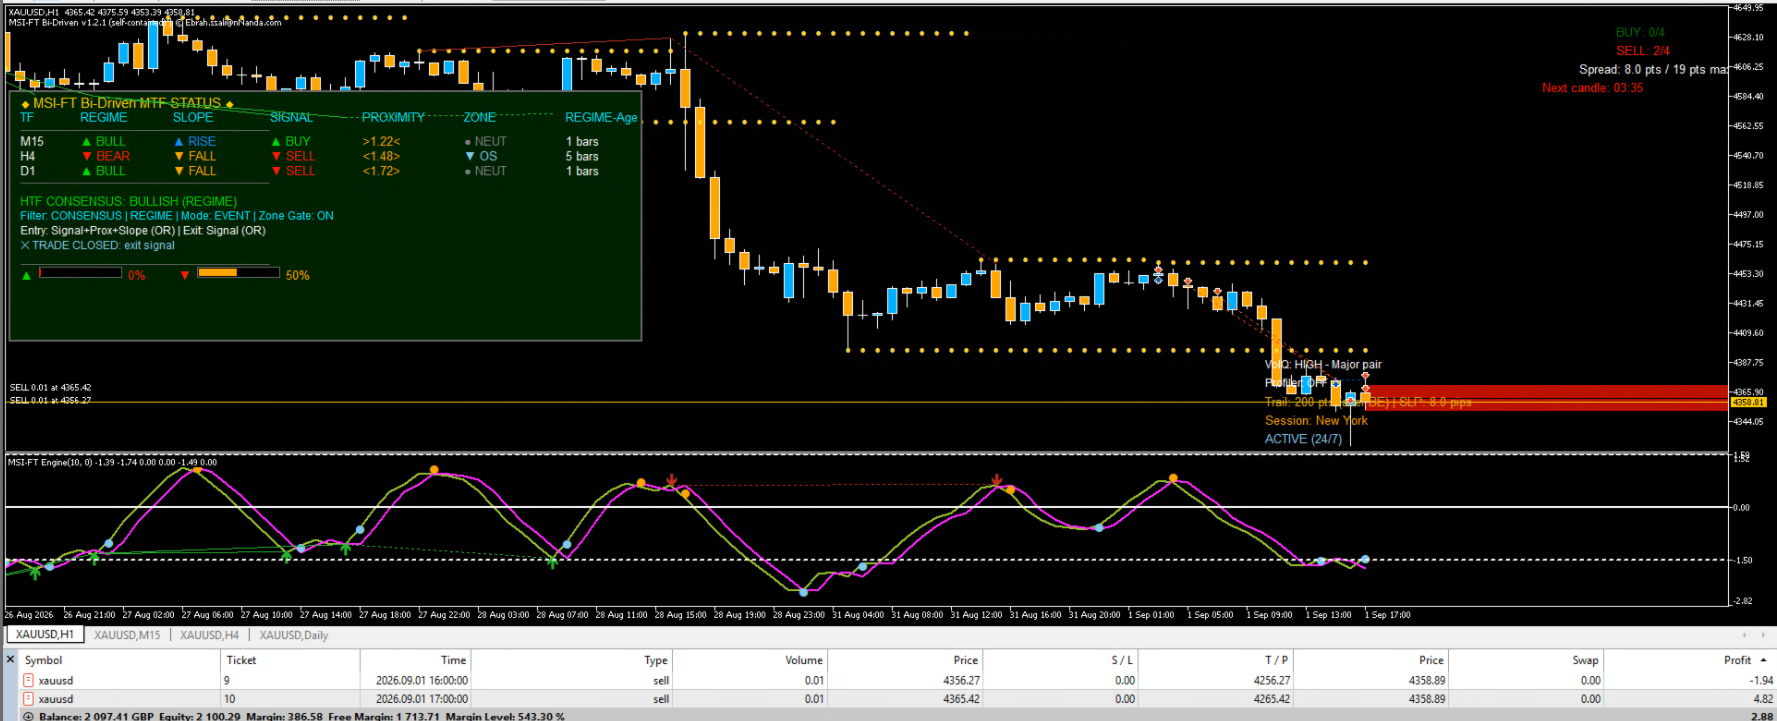
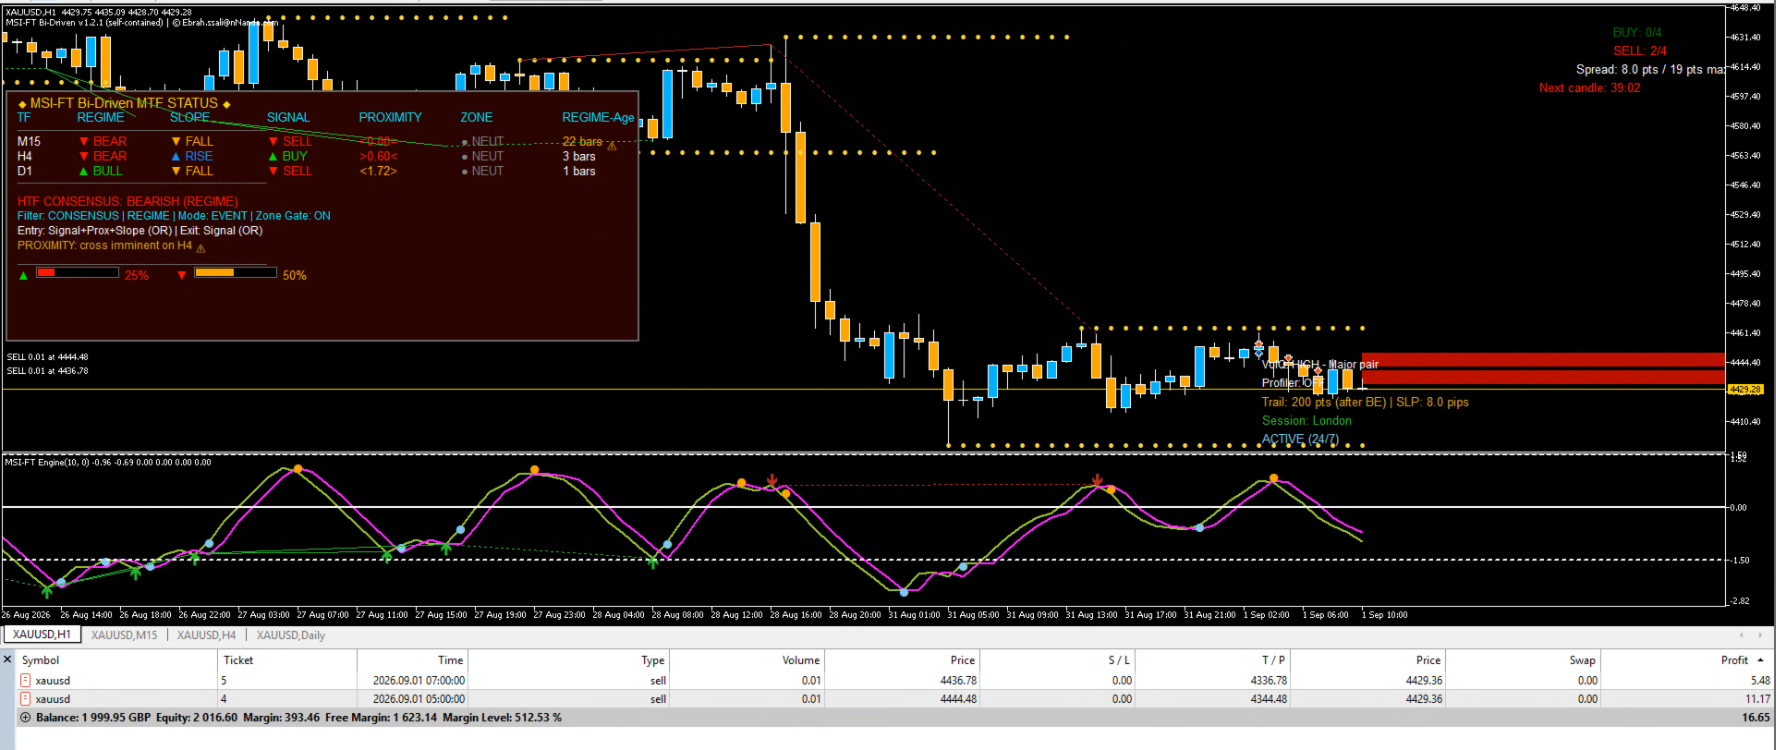
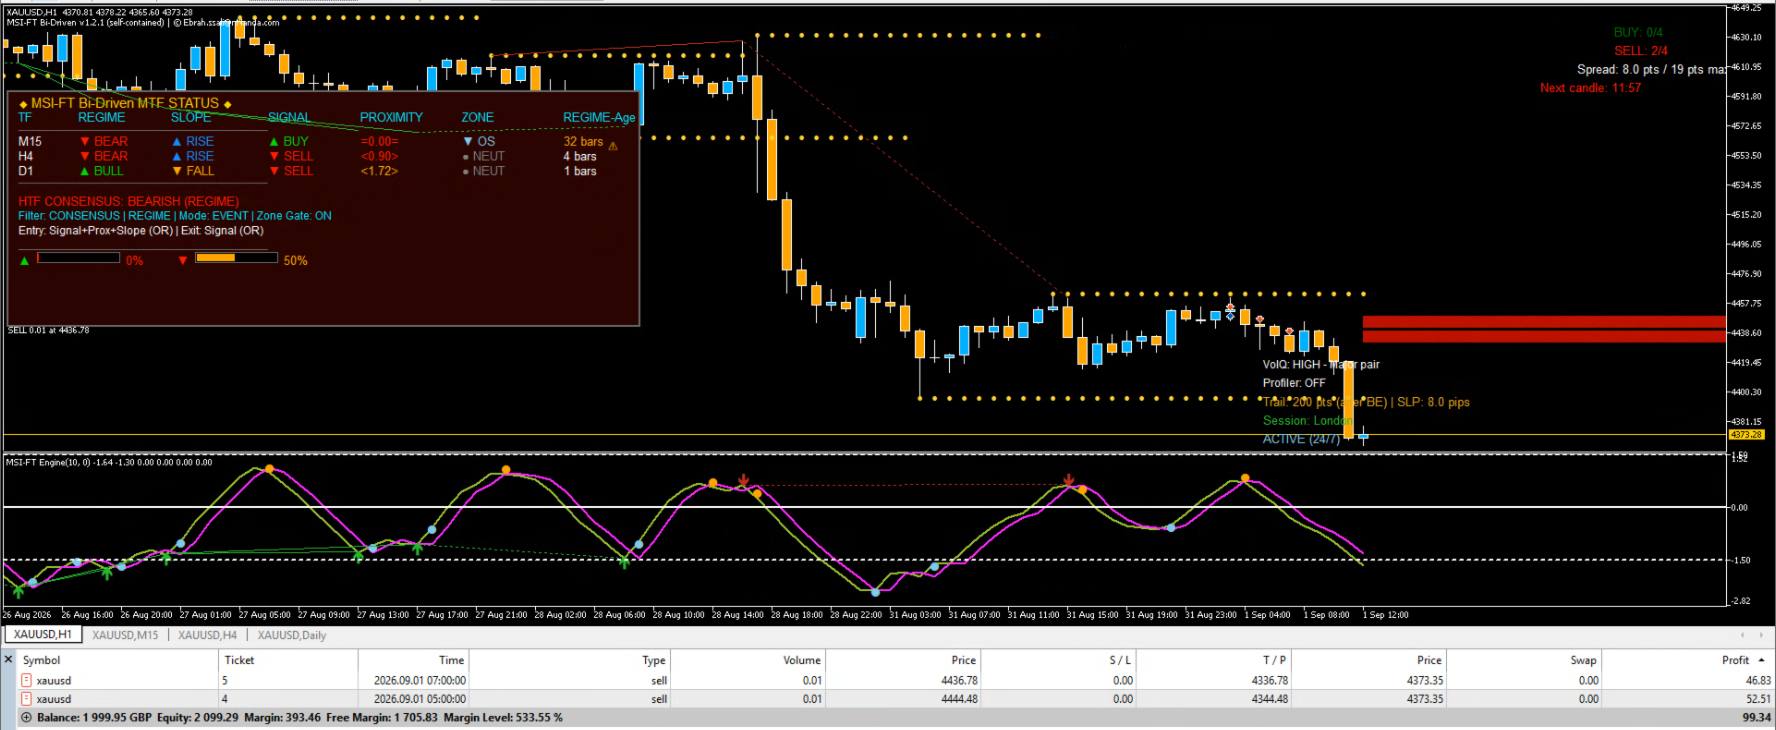
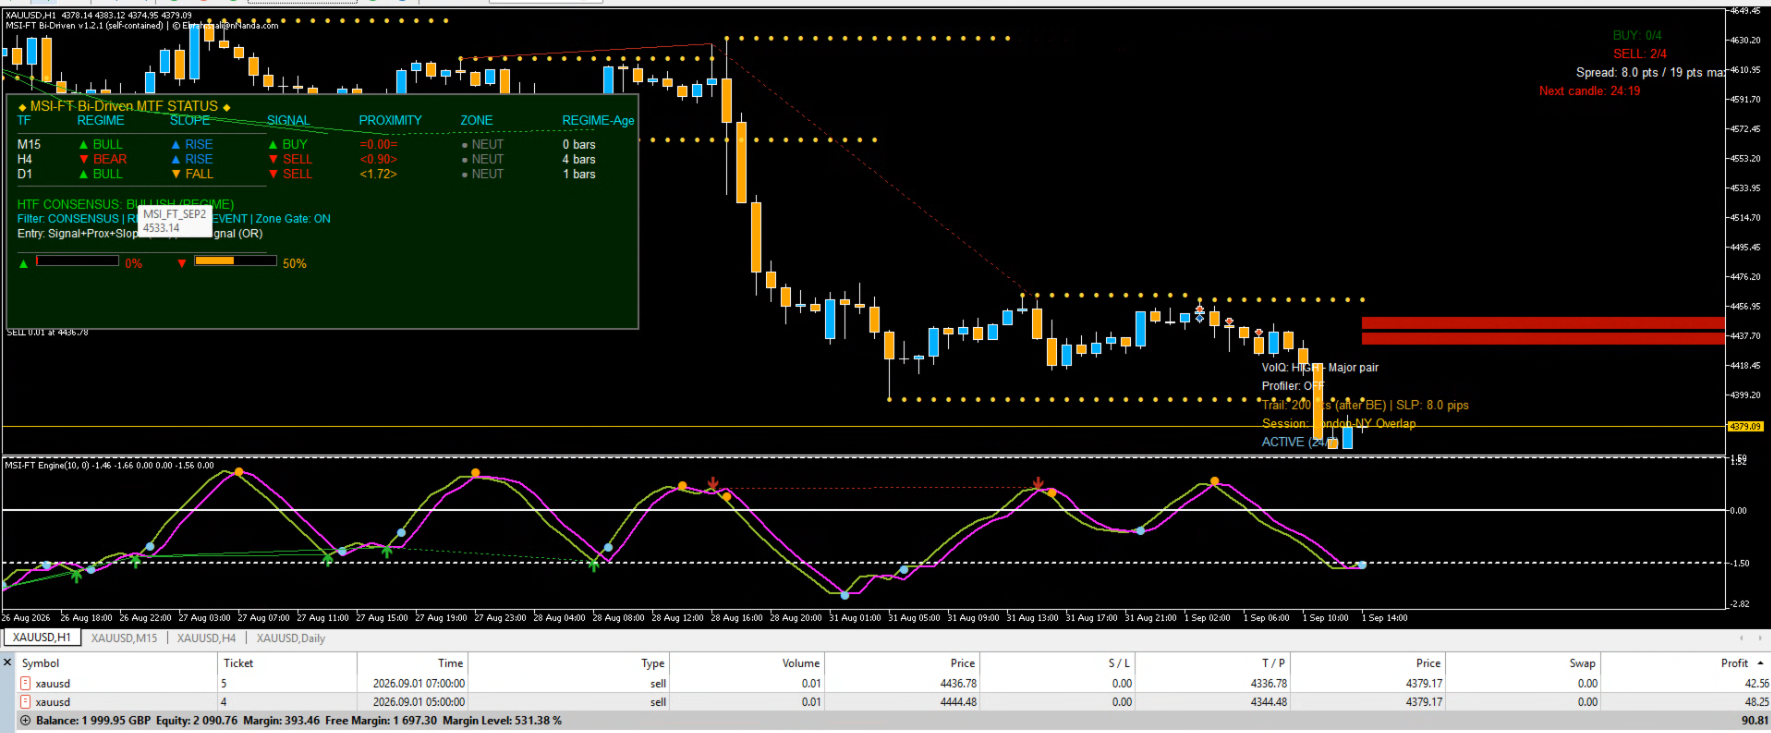
  1. Multi-timeframe table — the five layers for each of the three HTFs, colour-coded, with ages.

  2. HTF consensus — current vote.

  3. Configuration summary — what is enabled, in what logic.

  4. Status line — one of three states, shown only when relevant:

    • ⛔ TRADE BLOCKED: <reason> (red)

    • ✕ TRADE CLOSED: <reason> (sky-blue)

    • ✅ TRADE ALLOWED (green)

  5. PROXIMITY footer — names the timeframes where a cross is imminent. Shown only when applicable.

  6. Confidence meter — two independent bars for BUY and SELL alignment.

Nothing is shown unless it means something. The panel is quiet when nothing is happening and informative when something is.

The PROXIMITY layer — the edge

The classic Fisher crossover plots on the closed candle. By the time it appears, the move has begun.

PROXIMITY measures whether Fisher is closing on its Trigger, not merely moving fast. It detects the approach and reads the direction from the sign of the gap:

  • Fisher above Trigger and closing → down-cross imminent → SELL precursor

  • Fisher below Trigger and closing → up-cross imminent → BUY precursor

The distance is normalised by Fisher's own recent volatility, so the same thresholds work on gold, FX, indices, and crypto without re-tuning. Two safeguards filter false starts:

  • A touch band — when the gap is inside it, the state goes neutral because direction is ambiguous.

  • A minimum convergence count — require N consecutive converging bars before reporting.

The result is a signal that arrives before the plotted crossover without firing on every Fisher wiggle.

Configuration

Eight inputs cover the entire signal engine:

Input What it does
EventDrivenMode State or event entry behaviour
EntryLogic / ExitLogic OR or AND
UseEntry / UseExit Which layers participate
HTFColumn Which column the HTF filter reads
UseZoneGate Extreme-zone block
ProximityTouchNorm / ProximityVeryCloseNorm Touch band and footer threshold
ProximityATRLen / ProximityMinConvergeBars Normalisation length and confirmation

Everything else is risk, display, or notification, and all of it has a working default. The EA trades out of the box with no configuration change. Tuning is optional, not required.

What it does not claim

It does not predict price. It does not guarantee profit. It does not publish a win rate. It aggregates Fisher state across five independent properties, weights them, filters them, and acts when the aggregate meets your configured logic. Whether that produces an edge on your instrument and timeframe is a question only your own testing can answer.

Who it is for

The trader who already uses the Fisher Transform and wants it to answer more than one question at a time. The trader who wants a multi-timeframe view without maintaining three charts. The trader who values a status line that says why the EA did nothing, as much as one that says what it did. The trader who wants the signal engine disclosed, weighted, and visible — not hidden behind a black box.
作者的更多信息
The Ultimate Ichimoku MTF Dashboard: Your All-In-One Trading Edge Transform Your Trading with One Powerful Indicator Imagine having a professional trading assistant that monitors multiple timeframes simultaneously, identifies high-probability entries, warns you of potential reversals, and provides clear risk management guidance-all in one clean, intuitive display. That's exactly what the Ichimoku MTF Dashboard delivers.     Why This Isn't Just Another In
Cumulative Volume Delta (CVD) MA-X Plus:终极订单流分析架构 通过 CVD MA-X Plus 洞察市场的隐藏机制。普通成交量指标只能告诉你交易了多少,而 CVD MA-X Plus 能告诉你: 谁 在赢得战斗、 何时 赢得战斗,以及“ 聪明钱 ”锚定在 何处 。通过聚合逐笔报价级价格行为(在股票/期货/黄金等监管市场使用时可设置为“真实成交量”)和多层成交量分布,该指标为市场信心、衰竭和流动性提供了极其清晰的蓝图。这是 CVD MA-X 的进化版本,原版见: https://www.mql5.com/en/market/product/162375?source=Site+Profile+Seller 交易者优势:为什么要升级到 Plus 版? 大多数交易者失败是因为他们对滞后的价格行为做出反应。Plus 版本通过分析影线与实体的比例(受成交量加权,并新增机构级平滑选项)来分析蜡烛图的内部压力,从而为您提供领先优势。 成交量均衡: 每日公允价值在哪里?(新增 VWAP-Delta 锚定) 市场信心: 这一走势是否有真金白银支持?(CVD 与零轴对
MTF Connecting Fractals Multi-Timeframe Market Structure. One Glance. Real Decisions. MTF Connecting Fractals is not just another arrow-printing indicator. It’s a complete multi-timeframe market structure intelligence system designed to answer the most important trading questions in real time - clearly, visually, and without clutter. Built around fractals as objective structure anchors, this tool gives traders a decisive edge by combining price action, structural context, proximity risk, and
Critical Market Session Information with a Single Glance Stop juggling multiple tools and squinting at time zone converters. The SessionInfoDisplay Indicator is your new, indispensable trading co-pilot that puts real-time market intelligence directly on your chart.   What It Does: Your Essential Trading Dashboard   This intelligent indicator provides three critical pieces of information at a glance: 1. Real-Time Session Detection    - Automatically identifies which major financial session is act
FREE
Clr-Dynamic RSI v SMA Indicator : A Comprehensive Analysis of Features and Advantages The Clr-Dynamic RSI v SMA indicator represents a significant evolutionary leap in technical analysis tools, transforming the classic Relative Strength Index (RSI) from a potentially ambiguous oscillator into a sophisticated, multi-dimensional trading system. At its core, this indicator retains the mathematical foundation of the RSI, measuring the speed and change of price movements, but radically enhances its
MTF Candlestick Patterns Detector: 您的终极价格行为 (Price Action) 指挥中心 在快节奏的交易世界中,错过一个反转形态可能意味着盈利周与错失良机之间的巨大差距。 MTF Candlestick Patterns Detector 是一款专业级的 MQL5 指标,旨在同时扫描、检测并整合所有时间框架内的 24 种以上传奇 K 线形态。 告别在图表中盲目搜寻和猜测。让算法为您带来高概率的交易设置。 交易者的优势:为何选择此指标? 大多数 K 线指标会用滞后的数据使您的图表变得混乱。我们的探测器提供了一个 多时间框架 (MTF) 面板 ,充当您的飞行驾驶舱,一眼即可回答最关键的交易问题: 趋势结构如何? 面板将“趋势形态”(MN1 至 H4)与“入场形态”(H1 至 M5)分开显示。 最佳入场点在哪里? 实时精准定位早晨之星或看跌吞没等反转点。 信号强度如何? 通过查看 M5 到月线的共振(Confluence),您可以验证头皮交易信号是否与大周期趋势一致。 现在该做什么? 颜色代码按钮立即告知:看涨 (SkyBlue)、看跌 (DeepPi
MTF VWAP Indicator - Quick Overview   This indicator shows you where institutional money is flowing across multiple timeframes using Volume Weighted Average Price (VWAP) to identify high-probability trading zones. New version has VWAP bands plotting capability if user enabled and display panel (whose background changes colour on confluence) can be toggled on/off.      What It Actually Does:     1. Tracks Smart Money Levels: - Shows Daily, Weekly, and Monthly VWAP lines where big players (banks,
Indicator Overview This is a sophisticated Multi-Timeframe (MTF) indicator that not only applies the classic Fisher Transform formula but integrates it into a comprehensive trading system featuring a real-time dashboard. The indicator excels at pinpointing reversals through advanced divergence detection and providing a clear, multi-timeframe view of market structure.     How It Works: Core Fisher Logic   1.   Normalization and Signal Generation         The indicator transforms price (using med
MTF WAD Simplified Indicator - Professional Trading Solution     Overview The MTF WAD Simplified is a sophisticated multi-timeframe volume-based indicator designed to track smart money flow across financial markets. By monitoring the Williams Accumulation/Distribution (WAD) across 8 different timeframes, this tool provides traders with unprecedented insight into institutional accumulation and distribution patterns.     Core Benefits for Traders     1. Smart Money Tracking - Detect Institutional
RSI v SMA MTF Indicator : Professional Trading Edge in One Tool   Summary The RSI v SMA MTF Indicator is a sophisticated, multi-timeframe momentum analysis tool that transforms the traditional RSI into a powerful, actionable trading system. By combining RSI slope analysis with SMA crossover signals, divergence detection, and real-time multi-timeframe confluence, this indicator provides traders with a more comprehensive view of market momentum across all relevant timeframes.     Core Utility an
Cumulative Volume Delta MA-X MTF(带梯度动量) 该指标为 MetaTrader 5 提供多时区累积成交量德尔塔(CVD)分析。它通过分析报价成交量(Tick Volume)或真实成交量(Real Volume)数据,计算买盘与卖盘压力之间的净差值,从而直观地展示订单流(Order Flow)情绪。 指标逻辑与特性 本指标采用数学方法进行成交量分析: 数据来源 :支持交易所资产的 真实成交量 (Real Volume) ,以及针对外汇/CFD 市场的 OHLC 影线代理算法 (OHLC Wick Proxy) 。 梯度系统 :4 色移动平均线用于识别趋势阶段: 深天蓝 (DeepSkyBlue) :数值为正且正在上升。 橙色 (Orange) :数值为正但正在下降。 洋红色 (Magenta) :数值为负且正在下降。 紫色 (Purple) :数值为负但正在上升。 五层共振系统 (5-Layer Confluence System) 指标集成了五种不同的分析方法: 第一层:成交量德尔塔核心 (Volume Delta Core) —— 计算成交量德尔塔的
累积成交量增量 (CVD) MA-X:智能订单流情绪工具 通过 Cumulative Volume Delta (CVD) MA-X 揭示市场的隐藏机制。传统的成交量指标只能告诉你交易了 多少 ,而 CVD MA-X 则能告诉你 谁 在胜出以及 何时 胜出。通过聚合 Tick 级的价格行为和成交量分布,该指标为你提供了一张清晰的市场信念与衰竭地图。 交易者优势:为什么选择 CVD MA-X? 大多数交易者失败是因为他们对滞后的价格做出反应。CVD MA-X 通过分析 K 线的内部压力(影线与实体的比例)并结合成交量权重,为你提供 领先优势 。它实时回答了三个关键问题: 这次波动是否有真金白银支持? (CVD 与零轴的配合) 趋势是否正在失去动力? (MaxBuy/MaxSell 衰竭点) 大资金是否与价格背离? (内置背离引擎) 强大功能与实用性 智能权重阈值: 不同于简单的 Delta 计算,该指标通过解构 K 线影线和实体长度来计算“买入 vs 卖出成交量”,提供更细腻的意图观察。 双层信号逻辑: 兼具 CVD 零轴交叉 和 MA(CVD 移动平均线)零轴交叉 。这使你能够区分短
Multi-Timeframe Money Flow Index (MTF MFI) with Smart Divergence and Dashboard Unlock the flow of institutional money across every timeframe. Are you tired of guessing the trend only to be trapped by a sudden reversal? The Multi-Timeframe Money Flow Index (MTF MFI) is a professional-grade trading tool designed to provide a bird's-eye view of market liquidity and momentum. By aggregating volume-weighted data from W1 down to M1, this indicator eliminates noise and highlights high-probability tra
MTF Parabolic SAR Maximize your trading efficiency with the Multi-Timeframe Parabolic SAR Trend and Momentum Dashboard. Designed for serious traders who value clarity over clutter, this tool aggregates price action across six timeframes into a single, sleek visual interface.  By combining that reliable classic Parabolic SAR logic with advanced momentum scoring and risk assessment, this indicator transforms raw data into actionable trade signals.  The Strategic Edge: Why This Indicator? Most tra
Multi-Timeframe Heiken Ashi (Smoothed with Dashboard) Professional Market Structure Visualization with Weighted Confluence Scoring Transform your trading with crystal-clear multi-timeframe analysis. This indicator combines smoothed Heiken Ashi candles with an intelligent weighted scoring system to give you unprecedented clarity in any market condition. YOUR TRADING QUESTIONS – ANSWERED INSTANTLY: 1. What's the REAL trend direction? Dashboard Reveals:   Higher timeframe (MN1, W1, D1, H4) trend a
Hybrid BB-LRMA [Trend and Volatility Engine]   Master the markets with the Hybrid BB-LRMA, a professional-grade technical analysis tool that fuses the volatility-tracking power of Bollinger Bands (BB) with the hyper-responsive Linear Regression Moving Average (LRMA) to eliminate lag and pinpoint high-probability entries with arrow Signals   Why Hybrid BB-LRMA? Most moving averages are too slow, and Bollinger Bands alone can be noisy. The Hybrid BB-LRMA solves this by using a gradient-based LRMA
Hybrid FATL Fractal: Professional Digital-Signal Logic   Simplify the Complexity of Market Structure.   Unlock the power of digital signal processing combined with price action geometry. The Hybrid FATL Fractal is a professional-grade technical analysis tool designed to eliminate market noise and pinpoint high-probability institutional turning points. By merging the Fast Adaptive Trend Line (FATL) algorithm with Dynamic Fractal Breakout logic, this indicator provides a dual-layered filter that a
VOLUME PROFILE SAF-XII 专业级 MT5 市场轮廓(成交量概况)分析仪 —— 网格交易者的梦幻指标 什么是成交量概况 (Volume Profile)? 成交量概况是一种专业的机构级工具。与传统的随时间显示成交量的指标不同,它显示的是 特定价格水平 上的交易活动。它揭示了交易发生在 哪里 ,帮助您识别: 价值区 (VAH/VAL) :大部分交易发生的价格区间。 控制点 (POC) :成交量最高的核心价格水平。 流动性失衡 :每个层级的多空主导力量对比。 支撑/阻力 :基于实际交易活动形成的天然价格位。 三种操作模式 —— 真正的“设置后即忘” VP_MANUAL(波段交易与关键位分析) 用户通过拖动垂直线自定义分析范围。 仅在移动线条时重新计算。 适用场景 :新闻前夕分析、财报发布、特定日期范围。 VP_AUTO(头寸与动量交易) 随新柱线自动向后滚动。 使用自定义回溯周期(默认 100 根柱线)。 适用场景 :动量策略、突破交易。 VP_SESSION(日内交易与机构流向) 锚定逻辑交易时段(伦敦、纽约、亚洲盘开盘)。 适用场景 :日内交易、基于时段的机构化策略
Fisher Transform MTF Pro v4.03 Professional Multi-Timeframe Trading Decision System Fisher Transform MTF Pro turns complex multi-timeframe data into clear, actionable trade decisions in seconds. It answers instantly:  What’s the trend?  Where’s the entry?  How strong is the setup?  What are the risks?  Should I buy, sell, or wait?  The Edge   Zero-Line Filter (Trend Protection) Prevents counter-trend trades by default:  No buys above zero  No sells below zero This forces alignment with th
Turtles Pro
Ebrah Ssali
Turtles Professional v2.0 The Legendary Turtle Strategy, Reimagined for the Modern Trader Turtles Pro transforms the iconic 1980s Turtle Trading System into a high-performance, multi-timeframe decision engine. It eliminates guesswork by providing institutional-grade analysis on trend structure, entry quality, and volatility all on a single chart. The Strategic Edge Turtles Professional uses a Smart Weighted Bias Engine to prioritize higher time frames, ensuring your trades align with the d
Hybrid Hull-LSMA : The Trend Meets Momentum Powerhouse Are you struggling with moving averages that are either too slow to react or too noisy to trust? The Hybrid Hull-LSMA is a solution, engineered to solve the "lag vs. noise" dilemma. By fusing the ultra-smooth Hull Moving Average (HMA) with the predictive Least Squares Moving Average (LSMA), this indicator delivers a high-definition view of market structure and entry timing. Why the Hybrid Hull-LSMA? Standard indicators follow the market; t
T3 MTF PureMaths :多周期 Tillson T3 指标 带交互式面板的零延迟共振交易系统 多周期交易的制胜优势 T3 MTF Pure Maths 是一款专业级交易面板,能够同时聚合从月线到 5 分钟图等 8 个时间周期 的市场结构。它为您提供即时、可操作的洞察,无需频繁切换图表或进行复杂的脑算。 该指标基于 纯数学优化 (零指标句柄、无 CopyBuffer 调用)构建,运行速度比标准实现快 5-10 倍 ,是实盘交易和高强度策略测试的理想选择。 该指标能解决哪些问题? 交易者疑问 T3 MTF Pure 如何解答 整体趋势结构如何? 颜色编码的趋势面板一目了然地显示 MN1-W1-D1-H4 的一致性。 最佳入场点在哪? 入场周期(H1-M30-M15-M5)提供精确的时机信号。 信号强度如何? 强牛、 看涨、 看跌、 强熊 —— 清晰的强度层级。 风险在哪里? 信号强度阈值过滤掉弱势设置。 我现在该做什么? 推荐框显示即时动作:强力买入、买入、卖出、强力卖出或观望。 是否支持自动化交易? 箭头信号存储在缓冲区中,方便 EA 集成。 智能共振逻辑
Divergent Fisher Transform MT5  Precision Momentum. Intelligent Filtering. EA-Ready Automation. The Divergent Fisher Transform for MT5 is a professional-grade momentum trading indicator designed to help traders answer the most important question in the market: “What should I do right now?” It transforms raw price into high-probability, structured trading decisions using a powerful combination of:  Fisher Transform momentum modeling  Zero-line structural filtering  Multi-level overbought/o
Divergent Stochastic Filter II Catch Reversals Early, Filter Noise, Trade with Confidence The Edge: Why This Stochastic is Different  Every trader knows the Stochastic oscillator. But knowing when to trust its signals, that's the real challenge. The Divergent Stochastic Filter II transforms this classic indicator into a precision reversal detection system by adding critical elements: divergence intelligence, signal filtering and exhaustion detection.  While standard Stochastic oscillators fire s
X-Hybrid Modular Z – 智能执行交易平台 将任何指标转化为全自动交易系统 X-Hybrid Modular Z 是一款模块化执行引擎,能够将任何设计精良的自定义指标转换为完整的自动化交易系统。 它专为追求专业级执行和风险控制的交易者设计,在信号生成与机构级交易管理之间搭建了桥梁——无需任何编程基础。 为什么这款 EA 与众不同 与传统的专家顾问(EA)不同,它不仅仅是一个“信号读取器”。 X-Hybrid Modular Z 是一个具备执行感知能力的交易框架,其核心特性包括: 自适应滑点控制 (基于 ATR + 点差感知) 经纪商行为画像 (自学习式执行调整) 基于重试机制的执行引擎 带视觉间距区的入场过滤 (用户可切换间距可视化开关) 动态经纪商限制水平检测 (如止损距离限制) 全生命周期交易管理 它能实时根据市场波动、经纪商状况和执行质量调整滑点容忍度。 专家顾问中的“瑞士军刀”——运作原理: 您可以将此 EA 视为一个通用的执行引擎: 提供指标 :任何带有可读缓冲区的优质自定义指标(例如:Market\Fisher Transform)。 映射信号 :映射买入
Hybrid FATL-LRMA : Digital Precision Meets Statistical Certainty The Ultimate Trend-Momentum Convergence System with clear action protocols. Why Hybrid FATL-LRMA? The Edge some Traders Miss Are you tired of lagging indicators that signal entries after the move has already happened? Frustrated by noisy oscillators that keep you in chop while trends pass you by? The Hybrid FATL-LRMA is a dual-engine trading system that bridges the gap between high-frequency digital signal processing and stat
ADX ClrDynamic Slope-Aware, Low-Lag Trend & Momentum Engine Tired of lagging indicators that signal a trend only after the move is over? Traditional ADX calculations are often too slow for modern market volatility. ADX ClrDynamic bridges this gap by combining customizable low-lag smoothing algorithms (EMA, SMA, Wilder, or Hull Acceleration) with slope-aware momentum logic, giving you a lean, high-precision decision engine for timing trend entries and exits. Key Trading Questions Answered What is
ADX ClrDynamicPro Plus III Multi-Timeframe Trend, Momentum & Divergence Command Center Tired of lagging indicators that signal a trend only after the move is over? ADX ClrDynamicPro Plus III is a complete decision engine for trend, momentum, and reversal traders. By combining customizable smoothing algorithms (EMA, SMA, Wilder, or optional Hull Acceleration) with multi-timeframe (HTF) confirmation, institutional divergence detection, and an embedded subwindow dashboard, this tool delivers clear,
SERA - Sigma-Enhanced Regression Analysis – The Non-Repaint, Early-Entry MTF Trading System The Problem with Most Regression Tools (And How We Solved It) Traditional regression indicators lie to you. They repaint, they lag, and distort actionable data. Their flaws cost you in false back-tests, late entries/exits and therefore missed profits. Avoid catching a falling knife or chasing a train with SERA, she eliminates ALL three problems. One-Click Trading Style Selection – Choose Conservative, R
精简版 三色带逻辑 (Tri-Color Band Logic) 优先考虑价格行为的可视化,同时保留了挤压状态(Squeeze)检测功能。 1. 交易哲学切换:随心所欲 SignalMode 设置允许您选择指标如何解读触碰波带的行为。这可以看作是您的“交易性格”: 当价格触及... 突破模式 BREAKOUT (趋势交易者) 反弹模式 BOUNCE (反转猎人) 自动模式 AUTO (全能型) 上轨 买入 – “动能加速,顺势而为!” 卖出 – “价格超买,准备反做!” 由价格决定:收盘于上方 = 买入 / 收盘于内部 = 卖出 下轨 卖出 – “下行压力大,果断上车!” 买入 – “超卖反弹即将到来!” 由价格决定:收盘于下方 = 卖出 / 收盘于内部 = 买入 SignalMode 参数是指标的核心交易智能,决定了价格与外轨(缓冲区 8 和 9)的交互如何被解读,使指标能与您的特定交易策略保持一致。 2. 柱内优先级与置信度评估 触碰波带不再仅仅是简单的“真/假”触发,而是由 优先级引擎 (Priority Engine) 评估的加权事件: 突破模式: 优
筛选:
无评论
回复评论